Detection of thermal X-ray emission in the halo of the plerionic supernova remnant G21.5-0.9
Abstract
The detection of a soft thermal X-ray component in the spectrum of a bright knot in the halo of the plerion G21.5-0.9 is reported. Using a collisional ionization equilibrium model for an hot optically thin plasma, a temperature kev, a mass of 0.3–1.0 M⊙ and a density of 1.6-6 cm-3 is derived. The spectral analysis suggests a possible overabundance of Silicon with respect to the solar value in the knot; if this will be confirmed this object may be a clump of shocked ejecta.
keywords:
PWN , ejecta , G21.5-0.9 , plerion , X-rays1 Introduction and data analysis
The plerion G21.5-0.9 has been the subject of various studies in radio (Bock et al. 2001 and references therein), infrared (Gallant and Tuffs 1998) and X-ray (Safi-Harb et al. 2001; La Palombara and Mereghetti 2002). However, its weak X-ray halo was discovered only recently (Slane et al. 2000; Warwick et al. 2001) thanks to the larger sensitivity of Chandra (Weisskopf et al. 2000) and XMM-Newton (Jansen et al. 2001) with respect to previous X-ray astronomy satellites. The weakness of the halo has prevented a detailed study of its features up to now. Luckily, G21.5-0.9 is a calibration source for both Chandra and XMM-Newton and a large number of calibration datasets have been accumulated and is still being accumulated to this purpose. In this paper, this large collection of public data is used to investigate the nature of the brightest spot in the X-ray halo of this plerion, namely the North Spur (Warwick et al. 2001).
For XMM-Newton, the data consist of the observation of G21.5-0.9 with the source positioned on the axis and off the axis of the EPIC cameras (observation ID 0122700101, 0122700201, 0122700301, 0122700401, 0122700501), which have a total summed live time of 142 ks for PN and 146 ks for the MOS cameras. The observations were taken on April 7–17, 2000. The original event files were screened to eliminate the contribution of soft proton flares. After the screening, the summed exposure time were 79 ks for PN and 116 ks for MOS. All the analysis of XMM data was performed with the software SAS v6.0. The XMM-Newton spectra of the North Spur, collected in the single observations using a circular region of 20 arcsec radius centered at location 18h33m32.7s RA and -10d32m49s DEC (J2000), were summed and their response averaged. The spectra of the two MOS cameras were also summed and their effective areas and response matrices were averaged. The fit was performed separately for the PN and MOS, and then, after checking that they give consistent results, they were fitted simultaneously. The spectra have been rebinned to a minimum of 20 counts per bin and the 0.5–9 keV energy range was selected for the spectral fitting. The background used for the spectral analysis was collected in an annulus centered on RA and DEC J2000 between 85′′ and 120′′ from the center (this region is inside the X-ray halo at the same average off-axis angle as the North Spur). This method subtracts the contribution of the underlying continuum due to diffuse emission of the X-ray halo from the source spectrum, and concentrate the study on the intrinsic spectral properties of the North Spur.
For Chandra, 21 observations from the Chandra archive for which the source was located on the ACIS S3 chip were selected, in order to maximize the instrument response in the soft X-ray band, and at off-axis angle . The sequence number of the selected observation are 0159, 1433, 1554, 1717, 1769, 1771, 1839, 2873, 3693, 4353, 5166,1230, 1553, 1716, 1718, 1770, 1838, 1840, 3474,3700, 4354. The datasets include the dataset used by Safi-Harb et al. (2001), the latest report on X-ray data of the North Spur. However, they used only 6 observation for a total of 65 ks, whereas we also include all the more recent observation that have been done, for a total of 196.5 ks. This is the reason why they did not detect the thermal emission reported in this work. The observations were reprocessed using CIAO 3.1 and CALDB 2.28 in order to apply the most recent calibrations to all the data, including time dependent gain correction. Afterwards, the data were filtered to retain grade 0,2,3,4,6 and the status column equal zero. All the filtered datasets were merged together using the CIAO merge_all task. The spectrum of the North Spur was extracted using a circular region centered at the same location as before, but with a smaller radius (13 arcsec) to exploit the high resolution of the Chandra mirrors. The spectrum was rebinned like the EPIC spectrum and the band 0.5–8 keV was used. The response matrix and effective area were generated using the CIAO tasks for the analysis of extended sources. The background was selected in the same way as the XMM-Newton background. All the fits were performed using XSPEC v11.3.
2 Results of spectral fitting
The spectra were first fitted with a power law model modified by the interstellar absorption of Morrison and McCammon (1983) and a reasonable fit was found. All the best-fit parameters and their uncertainties are reported in Table 1. However, given the non uniform distribution of residuals in the soft band and the possibility that the North Spur may show signs of thermal emission due to hot plasma, as part of a shell or ejecta associated to G21.5-0.9, the spectra were fitted with a combination of a power law model and the mekal optically-thin thermal plasma model (Mewe et al. 1985, Liedahl et al. 1995). The results, also showed in Table 1, indicate that the two components fit is better then the power law only fit. The decrement of is significant according to the F-test (probability ), and the distribution of residuals is more homogeneous. The discrepancy between XMM-Newton and Chandra derived fluxes are due to different extraction region area and suggests that the source is extended (especially its non-thermal emission).
| Model | Norm | flux111Absorbed flux due to the thermal component only, in the 0.5–2.0 keV. | ||||
| cm-2 | photon | cm-2 s-1 keV-1 | keV | erg cm-2 s-1 | ||
| index | ||||||
| XMM-Newton PN and MOS | ||||||
| Power-law | - | - | 442/407 | |||
| P.L.+MEKAL | 423/405 | |||||
| P.L.+VMEKAL222Only Mg and Si abundances were fitted (best-fit values and 90% uncertainties are 1.0(0.1–2.3) and 4(1.3–8), respectively). Flux of Mg XI line at 1.34 keV is ph cm-2 s-1, whereas flux of Si XIII line at 1.86 keV is ph cm-2 s-1. | 410/403 | |||||
| Chandra ACIS S3 | ||||||
| Power-law | - | - | 237/187 | |||
| P.L.+MEKAL | 217/185 | |||||
| P.L.+VMEKAL333Only Mg and Si abundances were fitted (90% confidence range is for Mg and for Si). Flux of Mg XI line at 1.34 keV is ph cm-2 s-1, whereas flux of Si XIII line at 1.86 keV is ph cm-2 s-1. | 206/183 | |||||
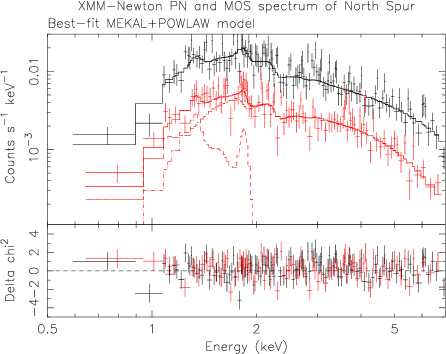

The XMM-Newton and Chandra spectra are shown in Fig. 1 and 2, along with the best-fit two component model. Emission lines of Mg XI at 1.34 keV and Si XIII at 1.86 keV may be identified in FIg. 2. Other expected emission lines at different energies are not evident due to limited statistics of these highly absorbed spectra and moderate CCD spectral resolution.

Fig. 3 shows the contour levels in the temperature-emission measure plane corresponding to confidence levels of 68%, 90% and 99% on parameter uncertainties.

Fig. 4 shows the same contours levels of Fig. 3, but for the Mg and Si abundances when these parameters are left free to vary. The obtained in this case is better than the case of abundances fixed to solar values (F-test probability of ), but the solar values for both elemental abundances are still within the 99% confidence level.
3 Discussion
The best-fit Si abundances obtained from the fit is around 4 and its 90% confidence level range is between about 2 and 10 for the XMM-Newton EPIC and above 5 for Chandra ACIS-S. Even though the solar value cannot be excluded at a 99% confidence level for XMM-Newton, the fact that both Chandra and XMM-Newton independently give a best-fit Si abundance above solar can be considered a hint that this element is somewhat overabundant with respect to solar. On the other hand, Mg abundance is found to be compatible with the solar value.
The best-fit Si abundance is not compatible with the abundances found in shocks of young SNR interacting with the circumstellar material (see, e.g., Park et al. 2004). Instead, it may indicate that the North Spur is an ejecta knot. The fact that the Mg abundance ranges between 0.3 and 2 with a best-fit of may imply that we are seeing at a Si-rich knot like the one observed in Cas A (Laming and Hwang 2003) and in other remnant. However, given the lack of other emission line in the spectrum and the overall weakness of the thermal component, a full comparison with the abundance patterns observed in ejecta of other young SNRs is not possible, so the interpretation of North Spur as a Si-rich ejecta knot needs more data to be confirmed.
Assuming a reasonable line of sight of the emitting plasma in the North Spur (about 1 pc), a density of the knot of cm-3 were derived (where is the distance in units of 5 kpc, Becker and Szymkowiak 1981), and a total mass of the thermal plasma of M⊙. Both density and mass are consistent with an ejecta of a Type II SN. However, the measured temperature (between 0.12 and 0.2 keV, considering both the EPIC and ACIS measurements) is lower then typical ejecta knot temperature measured in young SNRs (e.g. Laming and Hwang 2003 for Cas A).
This discrepancy can be eliminated if we assume that the ejecta we are observing have not been heated by the passage of the reverse shock, but by the supersonic shock of the expanding pulsar wind nebula. The expansion of a PWN in the freely expanding ejecta of its SNR has been studied by several authors (Reynolds and Chevalier 1984, van der Swaluw et al. 2001, Chevalier 2004). The X-ray emission associated to the PWN supersonic shock into the ejecta have been observed up to now only in 3C58 (Bocchino et al. 2001), while for the Crab and 0540-69 has been observed in the optical (Sankrit and Hester 1997, Kirshner et al. 1989). There are no other established observational signature of PWN expanding into ejecta (see Chevalier 2004 for a review). In 3C58, Bocchino et al. (2001) measured an X-ray temperature of 0.2 keV, which is remarkably similar to the one found here in the North Spur of G21.5-0.9. However, the mass reported in the case of 3C58 was only 0.1 M⊙ and Chevalier (2004) noted that these was higher then the predicted swept-up mass of ejecta for the evolutionary stage of that remnant. If we assume a similar evolutionary stage for G21.5-0.9, our mass estimate in the North Spur is even more problematic for this scenario.
We note that the interpretation of the North Spur in term of ejecta overrun by the PWN would imply a radius of the X-ray plerion much larger then the radio plerion (about 120 arcsec vs. 50 arcsec of the radio plerion, Furst et al. 1988), a feature which is not expected and indeed not observed in any other PWN. Even if such a large radius of the X-ray nebula compared to the radius of the radio nebula was suggested elsewhere in literature for G21.5-0.9 (Safi-Harb et al. 2001), it would be hard to explain it in terms of conventional PWN models.
Finally, we note that the differences of best-fit values between Chandra and XMM in Table 1 do not affect the conclusion of the paper about the presence of an additional thermal component in the spectrum. One of the reason of the differences may be the different extraction radii used for Chandra and XMM (this fully explains the differences in the fluxes, for instance). Further discussions about the nature of the differences are outside the scope of this work.
References
- Becker and Szymkowiak (1981) Becker, R. H. and Szymkowiak, A. E., High resolution X-ray and radio images of the Crab-like supernova remnant G21.5-0.9, ApJ , 248, L23–L26, 1981.
- Bocchino et al. (2001) Bocchino, F., Warwick, R. S., Marty, P., et al., The X-ray nebula of the filled center supernova remnant 3C 58 and its interaction with the environment, A&A , 369, 1078–1087, 2001.
- Bock et al. (2001) Bock, D. C.-J., Wright, M. C. H., and Dickel, J. R., The Crab-like Supernova Remnant G21.5-0.9 at Millimeter Wavelengths, ApJ , 561, L203–L206, 2001.
- Chevalier (2004) Chevalier, R. A., Pulsar wind nebulae: theoretical aspects and observational constraints, Advances in Space Research, 33, 456–460, 2004.
- Furst et al. (1988) Furst, E., Handa, T., Morita, K., et al., Detection of axisymmetric filaments in the filled-center supernova remnant G21.5-0.9, PASJ , 40, 347–356, 1988.
- Gallant and Tuffs (1998) Gallant, Y. A. and Tuffs, R. J., Infrared observations of plerions with ISO, Memorie della Societa Astronomica Italiana, 69, 963–970, 1998.
- Jansen et al. (2001) Jansen, F., Lumb, D., Altieri, B., et al., XMM-Newton observatory. I. The spacecraft and operations, A&A , 365, L1–L6, 2001.
- Kirshner et al. (1989) Kirshner, R. P., Morse, J. A., Winkler, P. F., et al., The penultimate supernova in the Large Magellanic Cloud - SNR 0540-69.3, ApJ , 342, 260–271, 1989.
- La Palombara and Mereghetti (2002) La Palombara, N. and Mereghetti, S., Timing analysis of the core of the Crab-like SNR, A&A , 383, 916–918, 2002.
- Laming and Hwang (2003) Laming, J. M. and Hwang, U., On the Determination of Ejecta Structure and Explosion Asymmetry from the X-Ray Knots of Cassiopeia A, ApJ , 597, 347–361, 2003.
- Liedahl et al. (1995) Liedahl, D. A., Osterheld, A. L., and Goldstein, W. H., New calculations of Fe L-shell X-ray spectra in high-temperature plasmas, ApJ , 438, L115–L118, 1995.
- Mewe et al. (1985) Mewe, R., Gronenschild, E. H. B. M., and van den Oord, G. H. J., Calculated X-radiation from optically thin plasmas. V, A&AS , 62, 197–254, 1985.
- Morrison and McCammon (1983) Morrison, R. and McCammon, D., Interstellar photoelectric absorption cross sections, 0.03-10 keV, ApJ , 270, 119–122, 1983.
- Park et al. (2004) Park, S., Hughes, J. P., Slane, P. O., et al., Nucleosynthesis in the Oxygen-rich Supernova Remnant G292.0+1.8 from Chandra X-Ray Spectroscopy, ApJ , 602, L33–L36, 2004.
- Reynolds and Chevalier (1984) Reynolds, S. P. and Chevalier, R. A., Evolution of pulsar-driven supernova remnants, ApJ , 278, 630–648, 1984.
- Safi-Harb et al. (2001) Safi-Harb, S., Harrus, I. M., Petre, R., et al., X-Ray Observations of the Supernova Remnant G21.5-0.9, ApJ , 561, 308–320, 2001.
- Sankrit and Hester (1997) Sankrit, R. and Hester, J. J., The Shock and Extended Remnant around the Crab Nebula, ApJ , 491, 796–807, 1997.
- Slane et al. (2000) Slane, P., Chen, Y., Schulz, N. S., et al., Chandra Observations of the Crab-like Supernova Remnant G21.5-0.9, ApJ , 533, L29–L32, 2000.
- van der Swaluw et al. (2001) van der Swaluw, E., Achterberg, A., Gallant, Y. A., et al., Pulsar wind nebulae in supernova remnants. Spherically symmetric hydrodynamical simulations, A&A , 380, 309–317, 2001.
- Warwick et al. (2001) Warwick, R. S., Bernard, J. ., Bocchino, F., et al., The extended X-ray halo of the Crab-like SNR G21.5-0.9, A&A , 365, L248–L253, 2001.
- Weisskopf et al. (2000) Weisskopf, M. C., Tananbaum, H. D., and van Speybroeck, L. P. Chandra X-ray Observatory (CXO): overview. In Proc. SPIE Vol. 4012, p. 2-16, X-Ray Optics, Instruments, and Missions III, Joachim E. Truemper; Bernd Aschenbach; Eds., pages 2–16, 2000.