Broad band variability of SS433: Accretion disk at work?
We present broad band power spectra of variations of SS433 in radio, optical and X-ray spectral bands. We show that at frequencies lower than Hz the source demonstrates the same variability pattern in all these bands. The broad band power spectrum can be fitted by one power law down to frequencies Hz with flattening afterwards. Such a flattening means that on time scales longer than sec the source variability becomes uncorrelated. This naturally leads to the appearance of quasi-poissonian flares in the source light curve, which have been regularly observed in radio and optical spectral bands. The radio flux power spectrum appears to have a second break at Fourier frequencies Hz which can be caused by the smearing of the intrinsic radio variability on timescale of the light-crossing time of the radio emitting region. We find a correlation of the radio and optical fluxes of SS433 and the radio flux is delayed by about days with respect to the optical one. Power spectra of optical and X-ray variabilities continue with the same power law from Hz up to Hz. The broad band power spectrum of SS433 can be interpreted in terms of self-similar accretion rate modulations in the accretion disk proposed by Lyubarskii (1997) and elaborated by Churazov et al. (2001). We discuss a viscous time-scale in the accretion disk of SS433 in implication to the observed broad band power spectrum.
Key Words.:
accretion, accretion disks– black hole physics – instabilities – stars:binaries:general – X-rays: general – X-rays: stars1 Introduction
SS433 is a high-luminosity massive X-ray binary system with steadily precessing accretion disk and jets (Margon (1984), see Fabrika 2004 for a recent review). Most of the system luminosity ( erg/s) is emitted in optical and UV spectral bands (Cherepashchuk et al., 1982; Dolan et al., 1997). The compact source in this binary system, probably a black hole, accretes the material from the companion late A-supergiant (Gies et al. 2002; Hillwig et al. 2004; Cherepashchuk et al. 2003; 2004) at a highly super-Eddington rate. Mildly relativistic (c) baryonic jets are launched from the innermost parts of the supercritical accretion disk.
The system demonstrates several periodicities (Cherepashchuk 2002): the precessional one (162 days), the orbital one (13 days), and the nutational one ( days). Studies of these periodicities made it possible to tightly constrain some of the system’s parameters (Eikenberry et al. 2001; Collins & Scher 2002) including the binary system inclination angle () and the jet precession angle ().
X-ray emission produced in the innermost regions of the accretion flow is completely screened from the line of sight by the optically and geometrically thick inner disk and outflowing wind. The observed X-ray flux from SS433 can be modeled by thermal bremsstrahlung emission from a keV plasma moving in the jets (Watson et al. 1986; Kotani et al. 1996). A detailed analysis of high resolution X-ray spectra taken by CHANDRA (Marshall et al. 2002) basically confirms previous findings. The recent analysis of hard X-ray spectra of SS433 obtained by INTEGRAL, however, indicates that a mixture of plasmas with different temperatures and geometries could be present in the jet region (Cherepashchuk et al. 2003; 2004).
The source demonstrates variability in all spectral bands and on various time scales (see e.g. Fiedler et al. (1987), Goranskii et al. 1987, Zwitter et al. 1991, Kotani et al. 2002). However, thus far no systematic studies of aperiodic variability of SS433 at different wavelengths have been carried out. Previous works were mainly focused on the analysis of periodic variabilities found in the source. SS433 has been regularly monitored at different wavelengths over the last decades and appears to be also well suitable for analysis of aperiodic variations. The long-term optical observations indicate that the source demonstrates on average a very stable behavior with no drastic changes in its activity pattern (Eikenberry et al. 2001; Goranskii et al. 1998). It is the only known persistent galactic microquasar with nearly constant kinetic power in jets (Fabrika 2004).
An enhanced radio flux is observed from the source at some periods. These were classified as active states on top of the quiescent (passive) states (Bonsignori-Facondi et al. 1986; Fiedler et al. 1987; Trushkin et al. 2003). However, on the long range, it can be shown that the appearance of the active radio states in SS433 is aperiodic process and can be well described in the language of power spectra.
In this paper we for the first time attempt to systematically study the aperiodic variability of SS433 by constructing power spectra of its flux variations in radio, optical and X-ray spectral bands. We found that variabilities at different wavelengths can be described by one power law spanning several orders of magnitude in frequency, which is suggestive of their common nature. We discuss the possible origin of the obtained power spectra as being due to the mass accretion rate modulation in the underlying accretion disk.
2 Observations and data analysis
To estimate power spectra of the source variability in different spectral bands we have combined all data available to us. As the data were obtained by different instruments, are not evenly spaced and have significant time gaps, we can not use the simple discrete Fourier transform, which is usually applicable for evenly spaced data (e.g Leahy et al. (1983)).
The optical and radio data are analyzed by means of periodograms that provide estimations of the Fourier amplitude at a given Fourier frequency in the form (Deeming (1975); Lomb (1976); Scargle (1982)):
Here is the flux measurement at a given time with subtracted average flux value, is the number of measurements in the set. To obtain the fractional rms squared normalization we calculate the power in the form:
where is the time span of the set (). The power spectrum calculated with this normalization has one important property: The integral of the power spectrum from to gives the square of fractional rms variability which is present in the lightcurve of the source on time scales from to .
The longest time series were divided into a few parts and the power spectrum was evaluated for each of them. Estimates of the power of different parts lying at close Fourier frequencies were averaged and the standard deviations of these values were calculated.
For all our data sets we have made simulations in order to check the effect of uneven sampling. Simulations show that this effect distorts the power spectrum in the form of a power law () at the low frequency end, but not very significantly. In most cases such a distortion does not exceed the uncertainty in the power estimates.
2.1 SAI database of observations of SS433
The optical broad band power spectrum of SS433 was calculated using a data-base of optical V-band photometry of SS433 obtained in 1979–1996. The data-base consists of 2200 individual nights of observations collected at Sternberg Astronomical Institute (Goranskii et al. (1998)). In this data–base all published V-band observations are reduced to one photometrical system. The average uncertainty of the photometrical data in individual nights is 5-10%. The data–base also includes series of photometric observations taken during several consecutive nights (for example, Goranskii et al. 1987; 1997), with each night containing from several to a few tens individual observations. The contribution of measurements uncertainties to the obtained power spectrum (the white noise component) have been subtracted. Besides, we have removed from the power spectrum the peaks due to coherent modulations with orbital, nutational and precessional periods.
2.2 RTT150
The high-frequency power spectrum of optical fluctuation was calculated using observations of SS433 performed with 1.5-m Russian-Turkish Telescope (RTT150) at TÜBITAK National Observatory (TUG), Bakyrly mountain. The observations were carried out in September 2004 during seven nights under clear sky but poor seeing () conditions. In our analysis, we used points out of the orbital eclipse. A low readout noise back-illuminated 22 K Andor Technologies DW436 CCD mounted in F/7.7 Cassegrain focus of the telescope was used. The photometric R filter was utilized because of lower Galactic absorption in this filter and larger magnitude of SS433 (R) than in blue bands. The method of fast photometry we used is described in some detail in Revnivtsev et al. (2004)
2.3 X-ray data: RXTE/ASM and EXOSAT/ME
In order to construct the broad band power spectrum of variability of SS433 in X-ray band we have used two sets of data. Until now, the longest time-series of SS433 in X-rays is provided by the All Sky Monitor (http://xte.mit.edu/ASM_lc.html) onboard the Rossi X-ray Timing Explorer (Bradt et al. (1993)).
The power spectrum calculated from the observed X-ray ASM light curve should have the statistical noise contribution (a constant component in the power spectrum of the source). The value of this constant component in the power spectrum in principle can be calculated theoretically by using the values of statistical uncertainties quoted in the light curve. However, the errors quoted in the ASM light curves often underestimate the real uncertainties of the measured fluxes (see e.g. Grimm, Gilfanov, & Sunyaev, (2002)). Therefore in order to estimate the contribution of the noise component we have studied the power spectra of persistent weak sources, the supernova remnants Cas A and Puppis A. The obtained noise component after the appropriate renormalization was then subtracted from the power spectrum of SS433.
To construct the X-ray power spectrum at frequencies Hz we have used data of EXOSAT/ME observations. The EXOSAT observatory had orbit much longer than that of RXTE thereby providing much longer uninterrupted sets of observations. Preprocessed lightcurves of SS433 were taken from the HEASARC archive at GSFC (http://legacy.gsfc.nasa.gov). Only observations performed at precessional phases were considered. At these precessional phases the X-ray flux from jets of SS433 is maximal. Power spectra were constructed using the standard task of FTOOLS 5.2 package.
2.4 Radio observations
The longest available set of radio flux from SS433 at frequencies 2.25 GHz and 8.3 GHz is provided by the GBI monitoring (http://www.gb.nrao.edu/ fgdocs/gbi/gbint.html). We have used measurements at the frequency 2.25 GHz because these have higher signal to noise ratio than those at 8.3 GHz. The contribution of statistical noise was subtracted from the obtained power spectrum. The available data allowed us to estimate the power at frequencies from Hz to Hz and at Hz. Before the binning of the power spectrum we have removed the peak of coherent variations with the nutational period (6 days, Trushkin, Bursov, & Smirnova (2001)).
In order to extend the power spectrum of radio variability of SS433 to higher frequencies we have included the estimate of the SS433 variability on time scales of tens and hundreds of seconds made by Rand et al. (1988). Note that these measurements were done at the frequency 0.4GHz (different from 2.25 GHz for the GBI measurements), so the relative normalization of the power estimates might be different. However, comparison of available long time scale measurements of radio flux of SS433 at 0.4 GHz (e.g. Bonsignori-Facondi et al. (1986)) with that at 2.25 GHz tells us that the normalization correction factor between variabilities at these two frequencies does not exceed .
3 Results
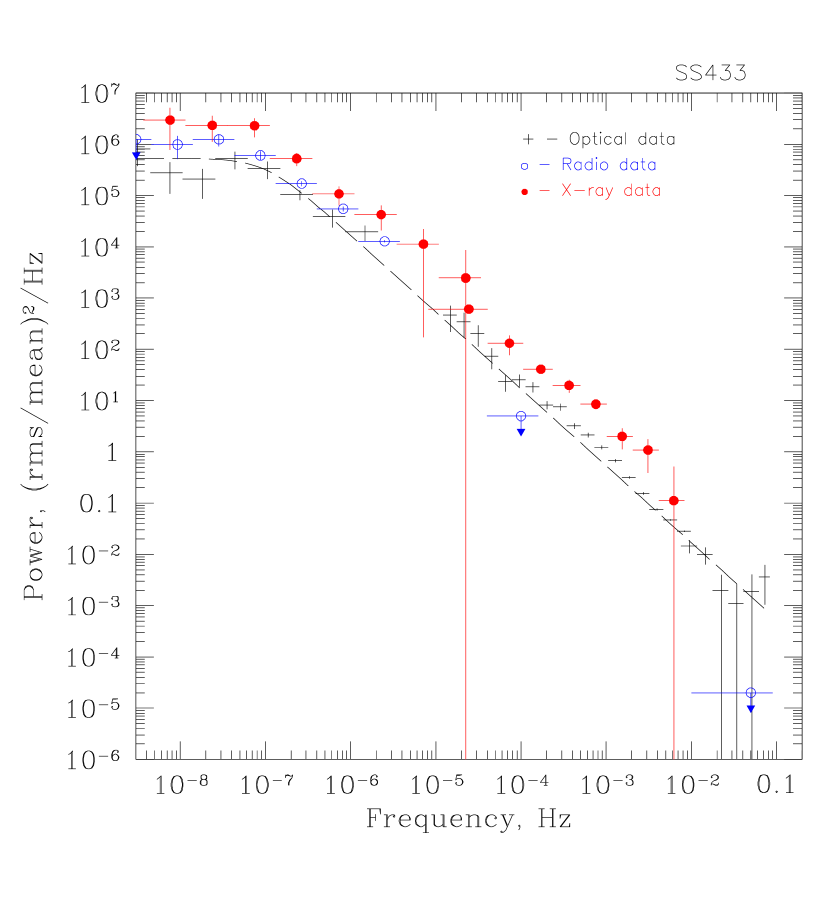
The resulting broad band power spectra of aperiodic variability of SS433 in different spectral bands is shown in Fig. 1. Two most important features of the power spectra are clearly seen.
-
•
First: stochastic flux variabilities in all three energy ranges (radio, optical and X-ray) follow very similar patterns. The power spectra in these ranges are flattened in Fourier frequencies Hz.
-
•
Second: the power-law part of the optical and X-ray power spectra (which can be traced up to Fourier frequencies of the order of 0.01-0.1 Hz) spans over more than five orders of magnitude in frequency. The power spectrum in radio is likely to have a break between Hz and Hz.
3.1 Self-similar power spectrum – is it produced by accretion disk?
The self-similar behavior of variability of sources is observed not for the first time. Decades ago it was noted that at low Fourier frequencies (Hz) X-ray binaries demonstrate a self-similar power law component in their power spectra (e.g. van der Klis et al. (1987); Hasinger & van der Klis (1989)). A detailed study of variability of the black hole binary system Cyg X-1 in the soft spectral state (when the optically thick accretion disk presumably extends down to the last stable orbit around the black hole) have demonstrated that this power-law component can extend over four orders of magnitude in Fourier frequency (Churazov et al. (2001)). An extensive study of low mass X-ray binary systems revealed that such power-law behavior is observed in practically all LMXBs (Gilfanov & Arefiev 2005).
It was suggested that the observed self-similar variability in X-ray binary systems is a result of mass accretion rate variations in the accretion disk around the compact object (Lyubarskii (1997); Churazov et al. (2001), Gilfanov & Arefiev 2005). The observed variability in X-ray binaries at all Fourier frequencies is rather strong (a significant part of the total luminosity varies), which implies that inner regions of the accretion disk, where the most of the energy release takes place, are involved. These regions, in turn, respond to the accretion rate modulations which have diffused there from the outer parts of the disk. If modulations of the accretion rate occur at any given radius of the accretion disk, imprinting the characteristic frequency to the inflowing matter, one can readily get the self similar power spectrum of the form , where for a wide range of accretion disk models (Lyubarskii (1997)).
3.2 Viscous time scale in the accretion disk
Such a power-law shape of the accretion disk power spectrum is expected to extend up to time scales on which the disk variability becomes uncorrelated, i.e. up to the longest time scale of the accretion disk (Churazov et al. (2001), Gilfanov & Arefiev 2005). From theoretical point of view this time scale is the time of viscous diffusion of matter from the outermost regions of the accretion disk to the innermost parts. For example, in the framework of standard optically thick accretion disk (Shakura & Sunyaev (1973), see also Lynden-Bell & Pringle (1974)):
where is the hydrostatic height of the disk at radius , is the Keplerian rotation period at this radius, is the viscosity parameter.
At frequencies below the variability becomes uncorrelated and consequently the power spectrum should flatten. As mentioned above, this indeed was found to be the case for all LMXBs (Gilfanov & Arefiev 2005). The uncorrelated variability at frequencies should appear on the light curves of the source in different energy bands as a set of random flares with durations around . Such “flares” have been actually often observed in radio and optical spectral bands, which led to the classification of the so-called “active” and “passive” states of SS433 (e.g. Bonsignori-Facondi et al. (1986), Irsmambetova (1997), Fabrika 2004 ). Such a flaring behavior in reality appears to be a natural observational appearance of the uncorrelated variability on time scales larger than the longest (viscous) time scale of the accretion disk. Note that a very similar phenomenon (but on much shorter time scales) has been observed many times from the best studied black hole candidate Cyg X-1,whose variability can be described as a series of random shots (the “shot noise” model, e.g. Terrell (1972), Vikhlinin et al. (1994), Negoro, Miyamoto, & Kitamoto (1994))
The break in the power spectrum of SS433 at Hz corresponds to a time scale of 50-100 days. The ratio of this time scale to the orbital period 13.6 days in SS433 is , which is in a reasonable agreement with results obtained by Gilfanov & Arefiev (2005) for LMXBs. 111Note here that the ratio of orbital to the break frequency of the order of 5-10 may indicate that the mass ratio in the binary system SS433 is larger than (see results of Gilfanov & Arefiev 2005) Such a low value of the ratio may indicate that the outer accretion disk is relatively thick (see also the discussion in Gilfanov & Arefiev 2005). In the case of SS433 the thickness of the outer parts of the disk should be at least not smaller than that found in LMXB systems because of the very high accretion rate. So in principle for a low alpha-parameter the viscous time scale of the accretion disk in SS433 evaluated from the above formula can be comparable to the value derived from the power spectrum analysis.
Note here that the ratio of orbital to the break frequency of the order of 5-10 may indicate that the mass ratio in the binary system SS433 is larger than (see results of Gilfanov & Arefiev 2005).
However, there are observational evidences of the large thickness of the disk in SS433. The approximate equality of the amplitudes of the precessional modulation and of the primary eclipses (the latter measured in the precessional phases when the disk is maximum open) in optical bands (Fabrika & Irsmambetova (2002); Fabrika 2004 ) indicates that the size of the donor is almost equal to that of the geometrically thick disk. The same relationship was found in different X-rays bands (Cherepashchuk et al. 2004): from 1.5 keV to 100 keV both the precessional and eclipsing amplitudes increase while keeping comparable to each other. This means that for all acceptable binary mass ratios in SS433 () both the donor and the outer disk rim sizes are about in units of the binary separation and the estimate looks quite plausible. This may be a point of concern. For a disk with the long viscous time (recall that relates to the Keplerian time at the outer disk radius) seems to be unlikely unless a small effective viscosity is assumed.
So to have a long viscous time scale in the accretion disk in SS433 we can admit that either some outer parts of the disk (through which matter diffuses on the longest time scales) have a moderate thickness , or the viscosity parameter in the accretion disk of SS433 is smaller than 0.1
The viscous time scale in an accretion disk can be treated as the time it takes for the accreting material to pass through the disk. This time may be estimated from the analysis of the nutational variability of jets in SS433 (see e.g. Katz et al. (1982); Collins & Newsom (1986); Fabrika 2004 ). The idea is that the nodding motions of the jets and the inner accretion disk have to be delayed with respect to tidal perturbations of the outer parts of the disk induced by the secondary companion. This time-delay was estimated to be of the order of a day. This means that the time for the passage of material through the disk is either extremely short (practically the free-fall time) or it is an integer multiple of the nutational period because of the periodic nature of the nodding motions.
A short travel time of the material passing through the disk is in strong disagreement with our estimates inferred from the noise power spectrum. We should note here that the estimate of the travel time from the nutational variability actually measures the propagation time of tidal perturbations from the outer parts of the accretion disk to the inner parts. Periodic tidal forces from the optical component may form a standing (in the binary’s reference frame) structures in the outer accretion disk (see e.g. model calculations in Blondin (2000) and references to earlier works therein) which can translate the nutational perturbations from outer parts of the disk to its inner parts on time scales much shorter than the matter travel time through the disk. In this picture, tidal perturbations may propagate through the disk with velocities close to the sound velocity.
Of course, the disk in SS433 is far from being the standard one. It is strongly supercritical and is inclined to the orbital plane (). However, we can use as a guide the analogy with the twisted tilted subcritical accretion disk observed in accreting binary system Her X-1. In that system the observed X-ray flux is strongly modulated with a period of days. The binary inclination in Her X-1 is close to 90 degrees, so we observe the system nearly edge-on. Over the 35-day period the X-ray emission appears twice – the bright “main-on” state and then a weaker “low-on” state. In Her X-1 the observed 35-day modulation can be understood as the precessional motion of the outer parts of the inclined accretion disk (Gerend & Boynton 1976). The analysis of the beginning of an X-ray cycle (the so-called turn-on phase) observed by RXTE (Kuster et al. 2005) confirms that it is the outer edge of the accretion disk that opens the central X-ray source at the turn-on. The disk is not flat, it is warped (or twisted) because of the strong interaction of the innermost parts with the rotating magnetosphere of the central neutron star in Her X-1. The inner parts of the disk start screening the central X-ray source at the end of the main-on X-ray state (see e.g. Shakura et al. 1999 and references therein). The disk in Her X-1 precesses as a whole in the direction opposite to the orbital revolution, so the inner parts of the disk appear to lead the outer parts in the precessional motion. This can be realized only when the tidal interaction from the outer parts is translated to the inner parts of the disk on a time scale which is shorter than the viscous time of the disk (of order of 20-30 days).
3.3 Accretion disk imprints in SS433 variability
Optical. It can be considered well established observationally that most of the optical variability in SS433 comes from the so-called accretion disk funnel, the open cone in the innermost part of a supercritical accretion disk (see e.g. Fabrika 2004 for a review and recent calculations by Okuda et al. 2004). The funnel itself may by partially hidden from the direct view by the strong wind from inner accretion disk. In this case some fraction of the optical radiation and variability will come from the wind photosphere. Both the funnel and the inner wind surround the bases of the jets. The structure of this region is not a subject of this paper, the most important thing here is that the energy emitted in optical and UV bands is very large, of the order of erg/s. This undoubtedly tells us that most of the optical emission should be originating from reprocession of the internal X-rays generated in the inner accretion disk. Therefore in the framework of self-similar variability of the mass accretion rate in the disk (Lyubarskii (1997); Churazov et al. (2001)) the optical variability of SS433 should share the same time properties as observed in X-ray range. It naturally should have the self-similar power spectrum from to , where is the viscous time at the outer boundary of the accretion disk (the longest time scale in the disk) and is the light crossing time of the funnel. At frequencies above the optical photometric variability should be smeared out.
In SS433 the size (height) of the funnel can be evaluated to be of the order of cm (van den Heuvel (1981), Marshall, Canizares, & Schulz (2002), Revnivtsev et al. (2004)) and therefore the limiting frequency Hz. Unfortunately, the existing data do not allow us to detect the decline of the power spectrum at frequencies higher than Hz (see Fig. 1) but future observations with higher statistics may reveal it.
It is interesting to note here that the variability of optical emission lines, which are emitted in the jets at distances above cm (Borisov & Fabrika 1987) from the compact object where the jet cross size is of the same order, should start washing out at the jet light-crossing frequencies of the order of Hz, which should be detectable.
X-ray. The X-ray flux of SS433 originates at the base of hot outflowing jet formed in the innermost regions of the accretion flow. Therefore we can naturally anticipate the X-ray flux to contain information about the mass accretion rate variations present in the innermost parts of the disk which are presumably brought in from the outer parts of the disk with the accreting matter. In this picture the similarity of the power spectra of variability of SS433 in optical and X-ray spectral band is quite natural. Indeed, the direct correlation of variability of SS433 in optical and X-ray bands was recently discovered by Revnivtsev et al. (2004).
Note that the X-ray variability should also be smeared out at high frequencies (in X-rays we observe the cooling jets). The limiting frequencies depend directly on the X-ray jets length , which presumably is cm (Watson et al. (1986), Kotani et al. 1996). So a decline in the X-ray power spectrum at frequencies higher than Hz is expected.

Radio. Most radio emission observed from SS433 originates in the jets. The power spectrum obtained by us at very low Fourier frequencies ( Hz, see Fig. 1) clearly indicates that variability of radio emission in SS433 has the same origin as the optical and X-ray variability. Even more direct confirmation of this hypothesis can be extracted by cross-correlating the optical and radio time series. From Fig. 2 we can see that the light curves at these spectral bands are significantly correlated. The radio flux is delayed with respect to the optical photometric variability with a time lag of 2 days. This time lag approximately corresponds to the jet travel time from the accretion disk funnel (where most photometric variability is generated, see above) to the distance where the radio emission appears, cm (Paragi et al. 1999).
The observed power spectrum (Fig. 1) indicates that there is no additional generation of the radio flux variability in jets on longer time scales ( sec). The points on the power spectrum at frequencies above Hz show that radio flux have a smaller variability amplitude than that found in the optical and X-rays at same frequencies. This can be a result of strong smearing of any possible intrinsic variability in the radio flux on time scales shorter than the light-crossing time of the radio emitting region.
4 Discussion
As we have shown above, the straightforward interpretation of the obtained broad-band power spectra of aperiodic flux variations in SS433 can be made in terms of self-similar accretion rate modulations by the disk. How solid is this interpretation? It is based on the assumption that the observed frequency of the flattening of the power spectrum can be associated with the viscous time scale of the accretion disk. This assumption seems to be supported by the analysis of power spectra of a dozen of LMXBs made by Gilfanov and Arefiev (2005).
The accretion disk in SS433 is a complex structure and clearly is different from disks in LMXBs. A time-dependent hydrodynamic model of an accretion disk in a close binary (Blondin 2000) shows that the tidal forces truncate the accretion disk to radii of order half the average radius of the Roche lobe and an effective –parameter is of order 0.1 near the outer edge of the disk. The disk in SS433 has to be even more complex, it is inclined by an angle of 20 degrees to the orbital plane. So the resulting thickness of the disk must be further increased in comparison with any estimates based on the standard accretion disk theory.
From the observational point of view there are clear indications that the inner disk around compact object in SS433 should be very thick (1). If the parameter of viscosity in such a disk is the disk viscous time scale can not be as large as 100 days. To obtain such a long viscous time, which are necessary to ensure the long time scale modulations of the mass accretion rate, we can assume that there is some (probably small) part of the outer disk with a moderate disk thickness
A possible alternative explanation can be delineated as follows. Let the viscous time of the disk be actually small, of order of a few days. The short viscous time scale is favored from the nutational periodicity analysis. The disk will generate the power-law modulations in the accretion rate all the way down to the frequency Hz irrespective of what kind of fluctuations are originally supplied with the incoming matter from the companion. So to explain the same power-law continuation of the spectrum to lower frequencies, as observed, we need to invoke some physical mechanism of generation of the power-law fluctuation spectrum from the donor star. In principle, such a mechanism could be a feed-back between the optical/UV flux fluctuations in the luminous central source (and the disk wind) and the illuminated photosphere of the donor, which will be transferred to the outer disk region with matter passing through the vicinity of the inner Lagrangian point in the binary system. Indications of a strong heating effect in the donor of SS433 have been recently found through optical spectroscopy of the companion A-supergiant carried out at the precessional phases close to the maximum disk opening (Cherepashchuk et al. 2004). Depending on orbital and precessional orientations (phases) different parts of the donor’s surface should be exposed for the heating.
The self-similar behavior of fluctuations is quite common in various natural phenomena, and the power-law noise spectrum can be generated in the turbulent disk outflow (e.g. Zeleny & Milovanov 2004 for a recent review). In this picture, the lower limit frequency of correlated fluctuations can be associated with star’s precession frequency Hz, which does not contradict to the observed flattening frequency. However, the inspection of the obtained power spectrum does not reveal a significant break at frequencies about Hz corresponding to the short viscous time scale of the disk.
So the simplest approximation of the obtained fluctuation power spectrum as one power law from to Hz appears to support the long viscous time scale of the accretion disk in SS433 and the interpretation of this spectrum in terms of self-similar modulations of the accretion rate in the disk.
5 Summary
We constructed the broad band power spectra of aperiodic variability of high-mass X-ray binary system SS433 in radio, optical and X-ray spectral bands. The obtained properties of the spectra can be summarized as follows:
-
•
Power spectra of variability of SS433 in radio, optical and X-ray spectral bands have the power law shape () from Hz down to Hz with flattening afterwards. At frequencies Hz the power law index is approximately
-
•
The power spectrum of radio variability presumably has one more break (steepening) at frequencies Hz which can be a result of smearing with large light-crossing time of the radio emitting region ( sec)
-
•
Radio and optical (photometric) fluxes of SS433 are correlated and the radio flux is delayed by about days with respect to the optical one. The correlated variability in optical and X-ray spectral bands was previously detected by Revnivtsev et al. (2004)
The observed behavior of fluxes of SS433 in different spectral bands can be interpreted in the framework of self-similar accretion disk variations proposed by Lyubarskii (1997) and elaborated by Churazov et al. (2001) and Gilfanov & Arefiev (2005). The accretion disk introduces the mass accretion rate variations at any given radius for example due to fluctuations of the viscosity parameter . The resulted variable mass accretion rate enters the region of the maximum energy release near the compact object and generates powerful variations in the emitted X-rays which then are reradiated in optical and UV spectral bands by a funnel surrounding the jets. We do not see directly this X-ray emission from the innermost parts of the accretion flow because of the high inclination of the binary system and a large optical depth of the geometrically thick accretion disk and the outflowing wind. Mass accretion rate fluctuations are translated to the density variations in the outflowing hot baryonic jet and give rise to the observed X-ray variability correlating with the optical one (Revnivtsev et al. 2004). As the expanding jet cools down, it starts emitting in optical lines and in radio. The time lag between the radio flux and the optical photometric flux (emission of the accretion disk funnel) equals to the jet travel time from the funnel to the radio emission region.
Acknowledgements.
The authors acknowledge N.I.Shakura for discussions. This work was partially supported by grants of Minpromnauka NSH-2083.2003.2, NSH-1789.2003.02 and program of Russian Academy of Sciences “Non-stationary phenomena in astronomy”. Partial support through RFBR grants 03-02-16110, 04-02-16349 and 02-02-17174 is acknowledged. PK acknowledges the University of Oulu for hospitality and support through grant of Academy of Finland 100488. MR,IB,RB and MP thank International Space Science Institute (ISSI, Bern, Swiss) for partial support. Research has made use of data obtained from High Energy Astrophysics Science Archive Research Center Online Service, provided by the NASA/Goddard Space Flight Center. Also data from GBI-NASA monitoring program were used. The Green Bank Interferometer is a facility of the National Science Foundation operated by the NRAO in support of NASA High Energy Astrophysics programs.References
- Blondin (2000) Blondin, J. M. 2000, New Astronomy, 5, 53
- Bonsignori-Facondi et al. (1986) Bonsignori-Facondi, S. R., Padrielli, L., Montebugnoli, S., Barbieri, R. 1986, A&A 166, 157
- (3) Borisov, N.V. & Fabrika, S.N. 1987, Sov. Astr. Lett. 13, 200
- Bradt et al. (1993) Bradt H., Rotshild R., Swank J. 1993, A&A Suppl. 97, 355
- (5) Brinkmann, W. and Kawai, N. 2000, A&A 363, 640
- (6) Calvani, M. and Nobili, L. 1981, Astrophys. Space Sci. 79, 387
- (7) Cherepaschuk, A. 2002, Space Sci. Rev. 102, 23
- (8) Cherepashchuk, A.M., Aslanov, A.A. and Kornilov, V.G. 1982, Sov. Astron. 26, 697
- (9) Cherepashchuk A. M., Sunyaev R. A., Fabrika S. N., et al., 2004, in Proc. V INTEGRAL Workshop, ESA SP-552, in press (astro-ph/0405338)
- (10) Cherepashchuk A. M., Sunyaev R. A., Fabrika S. N., et al., 2004, A&A, submitted
- Churazov et al. (2001) Churazov E., Gilfanov M., Revnivtsev M. 2001, MNRAS, 321, 759
- Collins & Newsom (1986) Collins, G. W. & Newsom, G. H. 1986, ApJ, 308, 144
- (13) Collins, G. W., Scher, R. W. 2002, MNRAS, 336, 1011
- Deeming (1975) Deeming, T. J. 1975, Astroph.Sp.Sci., 36,
- (15) Dolan, J.F., Boyd, P.T., Fabrika, S. et al. 1997, A&A, 327, 648
- (16) Eggum, G.E., Coroniti, F.V. and Katz, J.I. 1988, ApJ, 330, 142
- (17) Eikenberry, S. S., Cameron, P. B., Fierce, B. W., Kull, D. M., Dror, D. H., Houck, J. R., Margon, B. 2001, ApJ, 561, 1027
- (18) Fabrika, S. 2004, Astrophysics and Space Physics Reviews, 12, 1
- Fabrika & Irsmambetova (2002) Fabrika, S., Irsmambetova, T. 2002, In New Views on Microquasars”, the Fourth Microquasars Workshop, Ph. Durouchoux, Y. Fuchs, J. Rodriguez (eds). Center for Space Physics, Kolkata (India), p. 268
- Fiedler et al. (1987) Fiedler, R. L., et al. 1987, AJ, 94, 1244
- (21) Gerend, D., Boynton, P.E. 1975, ApJ, 209, 562
- Gies et al. (2002) Gies, D.R., McSwain, M.V., Riddle, R.L., Wang, Z., Wiita, P.J. and Wingert, D.W. 2002, ApJ, 566, 1069
- Gilfanov & Arefiev (2005) Gilfanov M., Arefiev V. 2005, MNRAS submitted, see also astro-ph/0501215
- (24) Goranskij, V.P., Kopylov, I.M., Rakhimov, V.Yu. et al 1987, Commun. Spec. Astrophys. Obs. 52, 5
- Goranskii et al. (1997) Goranskii, V.P., Fabrika, S.N., Rakhimov, V.Yu. et al. 1997, Astron. Rep. 41, 656
- Goranskii et al. (1998) Goranskii V.P., Esipov V.F., Cherepashchuk A.M. 1998, Astron. Rep. 42, 209
- Grimm, Gilfanov, & Sunyaev, (2002) Grimm, H.-J., Gilfanov, M., & Sunyaev, R. 2002, A&A, 391, 923
- Hasinger & van der Klis (1989) Hasinger, G. & van der Klis, M. 1989, A&A, 225, 79
- (29) Hillwig, T. C., Gies, D. R., Huang, W., McSwain, M. V., Stark, M. A., van der Meer, A., Kaper, L., 2004, ApJ615, 422
- Irsmambetova (1997) Irsmambetova, T. R. 1997, Astronomy Letters, 23, 299
- Katz et al. (1982) Katz, J. I., Anderson, S. F., Grandi, S. A., & Margon, B. 1982, ApJ, 260, 780
- (32) Kotani, T., Kawai, N., Matsuoka, M. and Brinkmann, W. 1996, PASJ, 48, 619
- (33) Kotani, T., Trushkin, S. and Denissyuk, E.K. 2002, In New Views on Microquasars”, the Fourth Microquasars Workshop, Ph. Durouchoux, Y. Fuchs, J. Rodriguez (eds). Center for Space Physics, Kolkata (India), p. 257
- (34) Kuster, M., Wilms, J., Staubert, R., et al. 2005, Astron. Astrophys. submitted
- Lawrence et al. (1983) Lawrence A., Cominsky L., Engelke C. et al. 1983, ApJ, 271, 793
- Leahy et al. (1983) Leahy, D. A., Darbro, W., Elsner, R. F., Weisskopf, M. C., Kahn, S., Sutherland, P. G., & Grindlay, J. E. 1983, ApJ, 266, 160
- Lomb (1976) Lomb, N. R. 1976, Astroph.Sp.Sci., 39, 447
- Lynden-Bell & Pringle (1974) Lynden-Bell, D. & Pringle, J. E. 1974, MNRAS, 168, 603
- Lyubarskii (1997) Lyubarskii Yu. 1997, MNRAS, 292, 679
- Margon (1984) Margon, B. 1984, ARAA, 22, 507.
- Marshall, Canizares, & Schulz (2002) Marshall, H. L., Canizares, C. R., & Schulz, N. S. 2002, ApJ, 564, 941
- Negoro, Miyamoto, & Kitamoto (1994) Negoro, H., Miyamoto, S., & Kitamoto, S. 1994, ApJ, 423, L127
- Okuda et al. (2004) Okuda, T., Teresi, V., Toscano, E., & Molteni, D. 2004, MNRAS in press (astro-ph/0411743)
- (44) aragi, Z., Vermeulen, R. C., Fejes, I., Schilizzi, R. T., Spencer, R. E., Stirling, A. M. 1999, A&A, 348, 910
- Revnivtsev et al. (2004) Revnivtsev, M., et al. 2004, A&A, 424, L5
- Scargle (1982) Scargle, J. D. 1982, ApJ, 263, 835
- Shakura & Sunyaev (1973) Shakura, N. I. & Sunyaev, R. A. 1973, A&A, 24, 337
- Shakura et al (1999) Shakura, N. I., Prokhorov, M.E., Postnov, K.A., & Ketsaris, N.A. 1999, A&A, 348, 917
- Terrell (1972) Terrell, N. J. J. 1972, ApJ, 174, L35
- Trushkin, Bursov, & Smirnova (2001) Trushkin, S. A., Bursov, N. N., & Smirnova, Y. V. 2001, Astronomy Reports, 45, 804
- (51) rushkin, S. A., Bursov, N. N., Nizhelskij, N. A. 2003, Bull. of Spec. Astrophys. Observ., 56, 57
- van den Heuvel (1981) van den Heuvel, E. P. J. 1981, Vistas in Astronomy, 25, 95
- van der Klis et al. (1987) van der Klis, M., Jansen, F., van Paradijs, J., Lewin, W. H. G., Sztajno, M., & Truemper, J. 1987, ApJ, 313, L19
- Vikhlinin et al. (1994) Vikhlinin, A., et al. 1994, ApJ, 424, 395
- Watson et al. (1986) Watson M., Stewart G., Brinkmann W. , King A. 1986, MNRAS, 222, 261
- Zeleny & Milovanov (2004) Zeleny, L.M., & Milovanov, A.V. 2004, Physics-Uspekhi, 174, N8, 809
- (57) Zwitter, T., Calvani, M. and D’Odorico, S. 1991, A&A. 251, 92