Rotation periods for stars of the TW Hydrae association: the evidence for two spatially- and rotationally-distinct pre-main sequence populations
Abstract
We have conducted a photometric study of late-type members of the TW Hydrae association (TWA) and measured the rotation periods for 16 stars in 12 systems. For TWA stars listed by Webb et al. and Sterzik et al. (TWA ; led by TW Hya = TWA 1) we find a median period of 4.7 d. However, for stars that we measured in the TWA group identified by Zuckerman et al., we find a median period of only 0.7 d. The period distributions of the two groups cannot be reconciled at the 3- significance level. Using photometric arguments supported by the Hipparcos distance to HD 102458 (= TWA 19A), we find that TWA reside at an average distance of pc, spatially at the near boundary of the Lower Centaurus-Crux (LCC) subgroup of the Ophiuchus-Scorpius-Centaurus OB-star association (OSCA). Proper motions for HD 102458, TWA 14, 18 and 19B link these stars to the LCC subgroup. From Hertzsprung-Russell (H-R) diagram placement, we derive an age of Myr for the HD 102458 system that may be the representative age for the TWA group. Merging various lines of evidence, we conclude that these stars form a spatially- and rotationally-distinct population of older pre-main sequence (PMS) stars, rather than being an extension of the TWA beyond those stars associated with TW Hya that have an age of Myr and reside at pc. Instead, TWA likely represent the population of low-mass stars still physically associated with the LCC subgroup.
keywords:
stars: pre-main sequence — stars: rotation — stars: activity — open clusters and associations: individual: TW Hydrae1 Introduction
The TWA remains one of the most extensively studied PMS populations, owing to the novelty of the association’s namesake; TW Hydrae is a classical T Tauri (CTT) star remote from the nearest sites of star formation (Herbig, 1978). The proximity of the association to Earth and the brightness of its component stars and brown dwarfs enables high sensitivity spatial, photometric and spectroscopic study at all wavelength regimes, e.g. the TW Hya has an Hipparcos distance of pc. The TWA is also at the astrophysically important age of Myr, comparable to the timescales for the end of disc accretion (Muzerolle et al., 2000; Lawson, Lyo & Muzerolle, 2004), and the dissipation of circumstellar discs and the incorporation of disc material into planetisimals. Disc dissipation is also believed to be related to the angular momentum evolution of PMS stars as they ‘unlock’ from their discs at the end of the accretion phase and spin up as they evolve down their Hayashi tracks; for a recent study, see Rebull, Wolff & Strom (2004).
The history of the discovery of other T Tauri stars in the region of TW Hya is documented by Webb et al. (1999) who defined the TWA as including 11 star systems containing at least 19 stars and one brown dwarf spanning spectral types of A0 to M8.5. From X-ray and kinematic study, surveys have since added other stars purported to be TWA members (Sterzik et al. 1999; Zuckerman et al. 2001a; Reid 2003; Song, Zuckerman & Bessell 2003), bringing the TWA membership to 25 systems, despite speculation as to whether all of these T Tauri systems truly form a physical association; e.g. (1998); Song et al. (2003).
By back-tracking space motions for some of the brighter TWA stars with accurate distances and kinematics, the TWA appears to be an outlying population of the LCC (or perhaps the Upper Centaurus-Lupus) subgroup of the OSCA, possibly formed within small molecular clouds that were collected by expanding supernova bubbles Myr ago (Mamajek, Lawson & Feigelson 2000; Mamajek, Meyer & Liebert 2002). The TWA is one of several nearby PMS groups of similar age ( Myr), but Myr younger than the OSCA OB-star subgroups (Mamajek et al., 2002), that are thought of as dispersed groups of OSCA origin. Other outlying populations include the Cha (Mamajek, Lawson & Feigelson 1999) and Cha clusters (Feigelson, Lawson & Garmire 2003) and the Pic moving group (Zuckerman et al., 2001b).
Whatever the concern over the homogeneity or origin of the TWA, there is intense interest in this group of nearby T Tauri stars. However the available suite of fundamental information on TWA members is still incomplete. Within a study based on published rotational information for the stellar populations of young clusters by Rebull et al. (2004), a notable omission was the lack of rotation periods for members of the TWA, except for TW Hya itself. In this paper we in-part remedy this situation with the measurement of rotation periods for 16 TWA stars in 12 TWA systems, the outcome of a multi-epoch multi-colour photometric survey of many of the TWA systems.
2 Observations and Data Reduction
An initial trial of multi-epoch -band observations for many of the TWA stars listed by Webb et al. (1999) and Sterzik et al. (1999) was made using the 1-m telescope and 1k 1k SITe charge-coupled device (CCD) at the Sutherland fieldstation of the South African Astronomical Observatory (SAAO) over 3 weeks of observing time during 2000 February and March. The acquisition of these observations was secondary to a programme to measure rotation periods for stars of the Chamaeleontis cluster (Lawson et al., 2001) and for that reason only measurements were obtained for each TWA star, an insufficient number for a definitive evaluation of the rotation periods in many cases. To address this outcome, a 2-week observing run from 2001 May using the same instrumentation was dedicated to the TWA stars, including several additional members identified by Zuckerman et al. (2001a). For most of the run the weather was ideal for differential photometry, with observations being obtained on 11 nights of which the final 9 were consecutive.
All of the TWA stars observed were measured at the - and Cousins -bands, with 3 stars (TWA 1 = TW Hya, TWA 6 and TWA 12) also observed at -band based upon the preliminary 2000 results that suggested either an irregular light curve (TW Hya) or high-amplitude light curves (TWA 6 and 12). For most of the stars, observations were made each night to reduce the 1-day aliasing errors in the light curve analysis that might be introduced from the single-site observations. Most stars were observed on occasions, while TW Hya was observed times, and TWA 6 was observed times. Not all TWA stars were observed; several were too bright for the 1-m telescope and/or resided in sparse fields without suitable comparison stars within the small (5.3 arcmin) field-of-view of the CCD, or they consisted of binary systems with arcsec-level separations that were unresolved in the arcsec seeing conditions typical for the observing run. Based on the membership lists of Webb et al. (1999), Sterzik et al. (1999) and Zuckerman et al. (2001a), we did not observe TWA 4AB, 11AB and 19AB. Of the 24 stars we did observe (this number includes companions), several fields had data of poor quality owing to the same problems that we identified above. These were TWA 2AB, 3AB, 5AB and 16AB. Thus of the 30 stars in 19 TWA systems listed by Webb et al. (1999), Sterzik et al. (1999) (TWA ) and Zuckerman et al. (2001a) (TWA ), we analyzed the light curves for 16 stars in 12 systems111The TWA has been expanded since our survey to include the star denoted TWA 20 by Reid (2003) for which membership of the TWA is disputed by Song et al. (2003), and 5 stars (denoted TWA ) announced as TWA members by Song et al. (2003)..
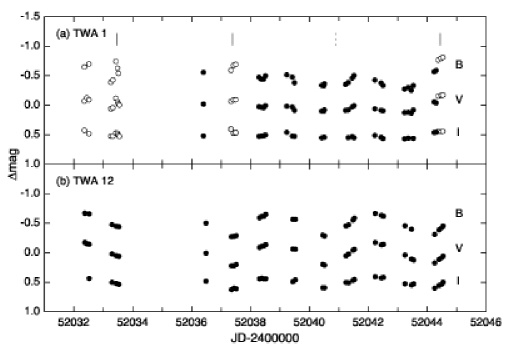
The production of the differential light curves for the TWA stars and their subsequent analysis using the Lomb-Scargle Fourier method follows that described by Lawson et al. (2001) for their analysis of photometry of the late-type stars of the Cha cluster using the same telescope and instrumentation. For the TWA stars, with VI or BVI multi-colour light curves available for study, we concentrated our analysis on the -band datasets which had superior signal-to-noise (S/N) ratio compared to the data obtained at the other photometric bands. However, we still repeated the analysis for the - and -band datasets, to confirm the period derived from the -band datasets and to produce amplitudes for all of the observed colours. We list in Table 1 the periods derived from the -band datasets, the BVI amplitudes derived from the analysis of the individual colour curves (we list the peak-to-peak amplitude of the most-significant periodicity), and the S/N ratio of the -band periodicity based upon measurement of the noise level in the Fourier spectrum following pre-whitening of the original datasets. In Fig. 1 we show two examples of our datasets: the BVI light curves for TW Hya and TWA 12. Both stars are clearly variable, with a periodicity of d duration being visible in the TWA 12 light curves. These light curves also serve to demonstrate the temporal coverage achieved during our survey. Most of the TWA stars were observed on as many epochs as TWA 12 (), and only one star (TWA 6) was observed more often than the examples shown here.
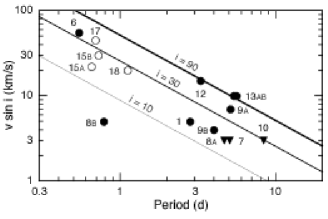
We can address the reliability of our measured periods for the TWA stars in several ways. First, we appeal to our study of rotation periods in the Cha star cluster. Lawson et al. (2001) observed these stars during 3 week observing runs in both 1999 and 2000, and found excellent agreement in the periods across the 2 observing seasons. Our measurements of the TWA stars were made at a higher frequency than the Cha stars which will reduce the risk of aliasing errors, thus we are confident about the periods listed for the TWA stars in Table 1. Secondly, the period of 2.80 d measured for TW Hya (see Section 3.1 for more details of the analysis of the TW Hya light curve) agrees well with values of d determined from Hipparcos photometry by Koen & Eyer (2002) and d determined from H veiling-corrected equivalent widths by Alencar & Batalha (2002). TW Hya is the only TWA star with a previously published period. We also note that TW Hya is a classical T Tauri (CTT) star with ongoing mass accretion from its circumstellar disk (Muzerolle et al., 2000). Thus rotational variability in TW Hya is likely to be modulated by accretion hotspots rather than cool starspot activity, and stochastic variations in the light curve owing to variable accretion and flaring activity might translate into differences in the measured period. The other TWA stars that we observed are non-accreting T Tauri stars and their light curves will not be similarly affected. Third, in Fig. 2 we compare our periods to another rotational measure; projected rotational velocities for the TWA stars taken mostly from the compilation of Reid (2003) except for TW Hya, for which we adopt km s-1 from Alencar & Batalha (2002). Reassuringly, Fig. 2 contains no unpleasant surprises, i.e. there are no stars that have the unphysical combination of long periods and high values. Most of the stars are located within a narrow band between relations for a rotating M⊙, R⊙ star seen at inclination angles and 90∘. According to the PMS evolutionary tracks of Siess, Dufour & Forestini (2000) these are roughly appropriate values for mass and radius for a late K-type PMS star of age Myr. For simplicity when calculating the relations, we assumed solid body rotation. With the exception of TWA 8B, a low-mass star of spectral type M5, all of the TWA stars plotted in Fig. 2 occupy a limited range of spectral types from K5 – M2.5 (Reid, 2003). Thus the comparison shown in Fig. 2 is reasonable. As a further test, for TW Hya (indicated in Fig. 2 by its TWA number of ‘1’) that has a spectral type of K7, we derive an inclination angle , in agreement with the value of determined from an analysis of emission line profiles by Alencar & Batalha (2002).
| Period | S/N | ||||
|---|---|---|---|---|---|
| Star | (d) | (mag) | (mag) | (mag) | ratio |
| TWA 1 | 2.80 | 0.22 | 0.12 | 0.06 | 3 |
| TWA 6 | 0.54 | 0.54 | 0.49 | 0.27 | 30 |
| TWA 7 | 5.05 | — | 0.05 | 0.03 | 6 |
| TWA 8A | 4.65 | — | 0.05 | 0.02 | 3 |
| TWA 8B | 0.78 | — | 0.08 | 0.05 | 5 |
| TWA 9A | 5.10 | — | 0.09 | 0.05 | 6 |
| TWA 9B | 3.98 | — | 0.08 | 0.04 | 5 |
| TWA 10 | 8.33 | — | 0.14 | 0.08 | 7 |
| TWA 12 | 3.28 | 0.35 | 0.36 | 0.16 | 10 |
| TWA 13A | 5.56 | — | 0.21 | 0.13 | 5 |
| TWA 13B | 5.35 | — | 0.27 | 0.17 | 13 |
| TWA 14 | 0.63 | — | 0.11 | 0.05 | 25 |
| TWA 15A | 0.65 | — | 0.13 | 0.06 | 12 |
| TWA 15B | 0.72 | — | 0.05 | 0.02 | 8 |
| TWA 17 | 0.69 | — | 0.12 | 0.07 | 15 |
| TWA 18 | 1.11 | — | 0.07 | 0.05 | 13 |
3 Analysis of the light curves
In describing in detail the photometric behaviour of the TWA stars, we consider two groups of TWA members: the compliation of members (TWA ) by Webb et al. (1999) and Sterzik et al. (1999), and the several stars (TWA ) added by Zuckerman et al. (2001a). We have two important reasons for doing so. First, these two groups appear to be spatially separate. While the TWA stars listed by Webb et al. (1999) and Sterzik et al. (1999) are distributed across an area deg2, most of the stars appear roughly proximate to TW Hya (galactic coordinates , b = , ). Three of the four members of the original association with Hipparcos parallaxes, TW Hya, TWA 4A and TWA 9A, are located at very similar distances of pc, pc and pc, respectively. The fourth star, HR 4796 (= TWA 11A), appears at , b = , and lies at the greater distance of pc.
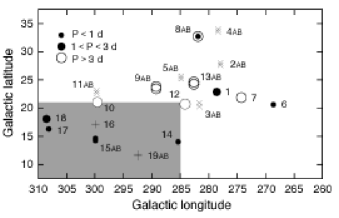
The six TWA systems announced by Zuckerman et al. (2001a) are centred at , b 300∘, 15∘ and contain the star TWA 19A (= HD 102458) with an Hipparcos distance of pc. The relative proximity of these stars to HR 4796 (on the sky) lead Zuckerman et al. (2001a) to consider them ‘near HR 4796’ but if they, as a group, have distances comparable to TWA 19A then they lie considerably ‘beyond’ HR 4796. They also have optical photometry that is fainter than most of the TWA stars ‘near’ TW Hya of similar spectra type, consistent with them having a distance pc. (We elaborate and quantify this point in Section 4.2.) The claimed three-dimensional extent of the TWA is thus immense; HR 4796 lies to the east of TW Hya and is pc more-distant, while TWA 19A lies to the south of TW Hya and is pc more-distant222Of the several TWA members announced by Song et al. (2003), TWA 22 is claimed to have a distance of only 22 pc based on colour-magnitude diagram placement.. (2002) have even questioned the TWA membership of the TWA 19AB binary. While they are clearly young stars owing to the detection of strong 6707 Li I absorption and chromospheric activity in both TWA 19A and 19B (Zuckerman et al., 2001a), the location of TWA 19A appears to place it within the LCC subgroup of the OSCA. LCC subgroup stars with Hipparcos distances have an average distance of pc (range of pc); see table 4 of Mamajek et al. (2002) for details. Fig. 3 shows TWA 19A (and the entire TWA group) superimposed on the confines of the LCC subgroup. The placement of TWA 19A within the LCC subgroup would then distinguish the star from the nearer TWA stars, and other nearby PMS groups such as the Cha and Cha clusters, which are thought of as dispersed OSCA groups (Mamajek et al., 2000; Feigelson et al., 2003). (The nature of the TWA 19AB system is further discussed in Section 4.2.)
Secondly, a cursory evaluation of the periods listed in Table 1 indicates that these two groups of TWA stars may be rotationally distinct. For the TWA stars ‘near’ TW Hya (TWA ) the group median is d (range of d), whereas for the TWA stars lying ‘beyond’ HR 4796 (TWA ) the group median is only d (range of d). As the range of spectral types for the stars in both groups with rotation periods is similar, the TWA group will be expected to have higher rotational velocities than the TW Hya group. This is strongly indicated in Fig. 2. Indeed, TWA 15A, 15B, 17 and 18 (shown as open symbols in Fig. 2) straddle km s-1, whereas within the TWA group only TWA 6 has a higher velocity of 55 km s-1.
Both spatial and rotational distinctions are summaried graphically in Fig. 3, where we plot the galactic distribution of TWA . This figure not only shows the location of the TWA stars, but the symbols for those stars with measured rotation periods are coded into three coarse period bins. Most of the TWA stars near TW Hya are seen to have periods d, whereas two-thirds (4/6) of the stars with d are associated with the TWA group of stars. TWA stars without measured periods are denoted as crosses for stars in the TWA group, or as pluses for stars in the TWA group.
Throughout the remainder of this paper, we proceed with the distinction between the two groups of TWA stars: those that appear to be located ‘near’ TW Hya (TWA ), and those that appear to be located ‘beyond’ HR 4796 (TWA ). In the following subsections we discuss the light curves of the stars that we measured, and then in Section 4 we discuss further the results of the period analysis. We also adopt, other than for TW Hya (= TWA 1), HR 4796 (= TWA 11A) and HD 102458 (= TWA 19A), the TWA number when discussing individual stars. The SIMBAD database provides a translation service from TWA number to other catalogue designations. Common names for the brighter TWA stars are listed by Reid (2003).
3.1 TWA stars located ‘near’ TW Hya
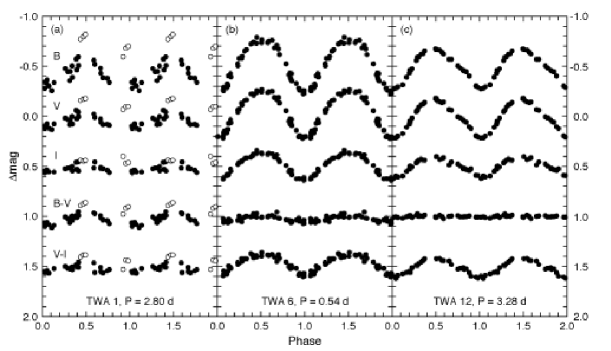
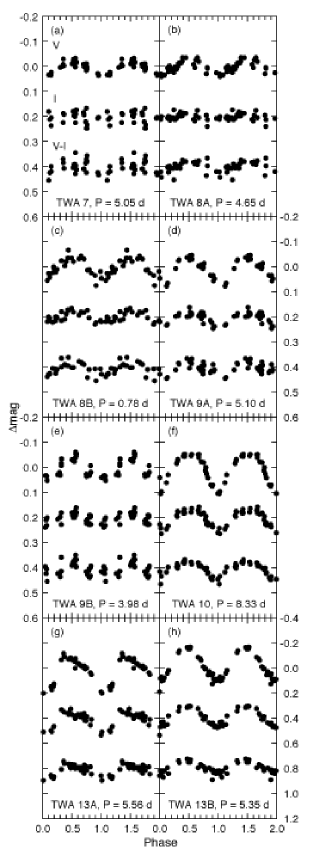
Phased BVI light curves for TW Hya, TWA 6 and 12 are shown in Fig. 4, and phased VI light curves for TWA 7, 8AB, 9AB, 10 and 13AB are shown in Fig. 5.
For most of these T Tauri stars, the VI light curves appear to be reasonably regular over the 13-d observing window, indicative of amplitude modulation due to cool starspots that are not evolving significantly during the course of the observations. With the exception of TW Hya, discussed below, these stars are WTT stars with low levels of optical emission and photospheric veiling, and no observed mass accretion observed from inner circumstellar disks that might influence the photometry (Webb et al., 1999; Muzerolle et al., 2000; Uchida et al., 2004). The regularity of the WTT star light curves is particularly well-demonstrated in Fig. 4, where the light curves for TWA 6 (Fig. 4b) and TWA 12 (Fig. 4c) are phase-wrapped over 22 and 4 cycles, respectively. Several stars, e.g. TWA 7 (Fig. 5a) show poor -band light curves owing to these stars often being the brightest -band source in the CCD field, and thus the local comparison stars in the CCD field used to define the differential -band magnitudes were under-exposed compared to the TWA star. A common feature of these light curves is that the ratio of the - to -band amplitudes is , therefore the colour amplitude is about half the -band light amplitude; the measured amplitudes for these stars are listed in Table 1. A decrease in photometric amplitude with increasing wavelength is characteristic of the reduced contrast between the starspots and the surrounding photosphere; see Bouvier et al. (1993). Most of these stars have -band amplitudes comparable to that observed in the similarly-aged Cha cluster (Lawson et al., 2001), with peak-to-peak amplitudes of magnitudes indicating per cent differences in the -band flux between the most- and least-spotted hemispheres of the star. The exceptions are the large amplitude variations seen in TWA 6 and 12 where the peak-to-peak amplitudes indicate flux differences at the per cent level during the rotation cycle of these stars (an analogue in the Cha cluster is RECX 10; see Lawson et al. 2001). The behaviour of the colour curves – a negligible amplitude, but significant amplitude – eliminates any prospect that the light curves are the result of an eclipsing binary system which would result in near-grey variations. TWA 6 does not appear to be a binary according to Reid (2003), while TWA 12 remains a candidate binary star based upon one discrepant velocity (of only four measurements) obtained by Torres et al. (2003).
The exception within the TWA group of stars with measured rotation periods is TW Hya itself. The star is a CTT star with ongoing moderate levels of mass accretion from its circumstellar disk at the level of M⊙ yr-1 (Muzerolle et al., 2000). The star shows a rich optical emission spectrum and strong blue and ultraviolet excess emission owing to the mass accretion. All of these factors might influence the light curve of the star. Of all the TWA stars that we measured for rotation periods, the light curve for TW Hya proved to be the most challenging to interpret. The light curve (see Figs 1a and 4a) lacks the regularity seen in the WTT stars owing to rotational modulation likely driven by accretion hotspots rather the passage of cool slowly-evolving starspots. In addition to rotational variations, we appear to have resolved a second (pseudo-) periodic feature in the light curve. Compared to the general appearance of the -band light curve, with low-amplitude 2.80-d variations that we ascribe to rotation (see below), we detected three short-lived (timescale d) unusually blue excursions in the photometry at JD 2452033.4, 2452037.3 and 2452044.4, respectively. The interspacing of these features suggest a characteristic timescale of d. If real, while the period is not strictly regular, another blue feature might have been expected near JD 2452040.9 which was during the daytime in South Africa.
We wonder if this feature is related to the d variations seen in the -band veiling by Batalha et al. (2002), and in some H and H line intensity and equivalent width datasets by Alencar & Batalha (2002). Although less visible in - and -band, these features have a major impact on the Fourier analysis of the light curves, and prevented identification of any statistically-significant periodicity. Reasoning that these features might not be related to stellar rotation, we removed the data points around the times of the blue features from the periodic analysis. We also considered only the continuous series of observations between JD , as few epochs then remained in the JD interval. The remaining data points are shown as filled symbols in Fig. 1(a). Fourier analysis of these observations recovered the d periodicity that we list in Table 1. This period is visible in all the light and colour curves; see Fig. 4(a) where we phase-plot the data obtained between JD . The low S/N ratio of 3 for the detection of the 2.80-d period in the -band is evidence for the variations being caused by hotspots, resulting in irregular amplitudes. As we discussed in Section 2, periodicities of comparable value have been recovered in other datasets, in particular a 2.88-d period found in the Hipparcos light curve for TW Hya (Koen & Eyer, 2002). The ratio of the d period to the d period is . We speculate that a 3:2 resonance exists between the d rotational period of the star and the in-fall of accreted material on a d cycle, causing an enhancement of photospheric veiling which drives the -band photometry, and a strengthening of optical line emission.
The photometric amplitude of TW Hya is near the average of that seen in the other TWA stars we measured. This is in contrast to observations of other CTT stars that show high levels of optical variability; see, e.g. Bouvier et al. (1993). The relatively low level of variability seen is likely a consequence of the near pole-on alignment of the rotation axis of TW Hya, for which Alencar & Batalha (2002) derived an inclination .
3.2 TWA stars located ‘beyond’ HR 4796
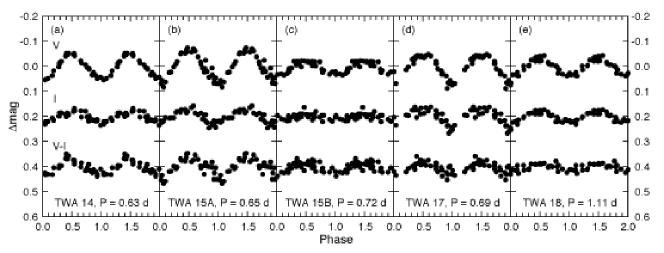
Phased VI light curves for TWA 14, 15AB, 17 and 18 are shown in Fig. 6. Owing to the short periods of d detected in these stars and the number of observations made, the phased light curves appear well-filled with the photometry wrapped over rotation cycles. All five stars showed regular light curves over the course of the observations, as is expected for WTT stars with light curves rotationally modulated by cool starspots.
4 Discussion
4.1 Statistical comparisons
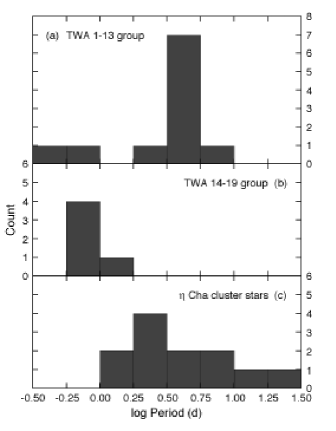
To assess the significance of the short rotation periods found for the TWA group, we compared these periods to those obtained for the TWA group associated with TW Hya, and also with the periods measured for stars in the Cha cluster by Lawson et al. (2001, 2002). The distribution of rotation periods for these three groups of PMS stars is shown in Fig. 7. We performed a Mann-Whitney non-parametric test to statistically evaluate the differences betwen the three samples. This test makes no underlying assumptions concerning the distribution of the datasets, e.g. there is no assumption that samples are normally distributed with the same variances. In comparing pairs of samples, we found the probability that the two groups have been drawn from the same parent population are for: (i) the TW Hya group compared to the Cha group; , (ii) the TW Hya group compared to the TWA group; , and (iii) the Cha group compared to the TWA group; . Thus at the level, the TW Hya group and the Cha cluster stars show a similar distribution of rotation periods. This result is not surprising as both groups of stars are believed to be similarly aged at Myr, and they are both outlying populations of the OSCA (Mamajek et al., 2000). However, the comparison with the TWA group of stars presents a very different result, with (or greater) likelyhood that the periods of these stars are not drawn from the same parent population as that for the TW Hya or Cha groups.
4.2 The distance to the TWA 14 – 19 group
Zuckerman et al. (2001a) noted that the TWA group of stars were ‘somewhat fainter at optical and infrared wavelengths than previously known members of comparable spectral type’. Since most of the stars that we measured for rotation periods occupy a limited range of spectral types of K5 – M2.5, with the single exception being the M5 star TWA 8B, we quantified the difference in brightness by considering the average 2MASS -band flux for the stars in the two groups for which we measured rotation periods. (By only comparing the stars with rotation periods, we ensured we were dealing with the photometry of individual stars, not the merged photometry of binaries.) We chose the 2MASS survey as it provided a uniform source of photometry and -band fluxes are a reasonable surrogate for stellar luminosity in this spectral range. For dwarf stars of spectral type K5 – M2.5, the bolometric correction required to correct -band magnitudes into stellar luminosities varies by only 0.15 magnitudes; see fig. 5 of Lawson, Feigelson & Huenemorder (1996).
For the 10 stars in the TWA group with rotation periods listed in Table 1, excluding the M5 star TWA 8B, we find (standard error; se). For the 5 stars in the TWA group listed in Table 1, we find (se). If both groups are coeval and unreddened, then a magnitude difference corresponds to the TWA group being located more-distant than the TWA group. This places TWA at an average distance of pc, in comparison with the average of Hipparcos distances to TW Hya, TWA 4A, TWA 9A and HR 4796 of = 55 pc. A similar result can be gleaned from table 2 of Song et al. (2003), who derived distances to the TWA stars from colour-magnitude diagram placement, assuming that the stars were coeval. Of course, if the two groups are not coeval then the above arguments need to be modified; a younger TWA group would be more-distant owing to the higher luminosity of younger PMS stars, and accordingly an older less-luminous TWA group would be located closer. However, the two groups cannot be codistant unless the TWA stars, excluding HD 102458 with an astrometric distance, have an age of Myr. This can be ruled out owing to the detection of largely-undepleted lithium in these stars (Zuckerman et al., 2001a).
An average distance of pc to the TWA group is consistent with the Hipparcos distance to HD 102458 of pc. However, H-R diagram placement of HD 102458 and its companion TWA 19B, when compared to the PMS tracks of Siess et al. (2000), suggests that the two stars are not coeval333To locate HD 102458 in the H-R diagram, we converted Hipparcos/Tycho , photometry to the Johnson/Cousins BV system using transformation equations given by Mamajek et al. (2002). We adopted a spectral type of G5 with no reddening from Zuckerman et al. (2001a), or F9 with magnitudes from Mamajek et al. (2002). For TWA 19B we adopted VI photometry from Reid (2003), and a spectral type of K7 or M0 with no reddening. We then used the dwarf bolometric correction and temperature sequences given by Kenyon & Hartmann (1995), which are appropriate for older PMS populations (Mamajek et al., 2002; Lyo, Lawson & Bessell, 2004).. For HD 102458, our derived age is Myr, in agreement with values of Myr derived using various PMS grids by Mamajek et al. (2002). TWA 19B appears to have an age of only Myr. The apparent age discrepancy can only be explained if the stars are unrelated or if TWA 19B has elevated luminosity, as the difference is too large to be explained by uncertainties in the PMS tracks and the reddening towards these stars is low. From proximity and kinematic arguments the two stars are clearly related; TWA 19B resides arcsec east of HD 102458 and they are comoving; HD 102458 has an Hipparcos proper motion of , = , mas yr-1 (se), whereas TWA 19B has a UCAC2 proper motion of , = , mas yr-1 (se). The apparent youthful age of TWA 19B can be reconciled with that of HD 102458 if it is an undocumented binary. Assuming that TWA 19B is a binary with equal luminosity components, they then have an age of Myr. Merging the above age estimates for HD 102458/TWA 19B, we adopt Myr as the age of the system.
An age of Myr for the HD 102458 system is encompassed within the distribution of ages derived from H-R diagram placement for LCC subgroup PMS stars and PMS candidates of Myr (1 ) by Mamajek et al. (2002), using the PMS grids of Siess et al. (2000). Both HD 102458 and TWA 19B have proper motions consistent with LCC membership; see table 1 of Mamajek et al. (2002). The spatial location, age and proper motions of HD 102458/TWA 19B together present a convincing case for a LCC subgroup origin for the HD 102458 binary.
Other TWA group members with UCAC2 proper motions similarly present a strong case for LCC subgroup membership444TWA 16 has UCAC2 proper motions of , = , mas yr-1 (se), discordant with LCC subgroup membership (Mamajek et al., 2002). However, TWA 16 is a binary with a separation of arcsec and a brightness ratio (Zuckerman et al., 2001a). The UCAC2 catalogue does not resolve the components, and the proper motion is likely in error.. TWA 14 is located near HD 102458 (see Fig. 3) and has similar proper motions of , = , mas yr-1 (se). TWA 18 has proper motions of , = , mas yr-1 (se), comparable to LCC stars at a similar Right Ascension (Mamajek et al., 2002).
If the age of the HD 102458 system reflects that of other stars in the TWA group, then these stars are clearly not coeval with the TWA group which has a derived age of only Myr from H-R diagram placement; see e.g. fig. 3 of Webb et al. (1999). The average photometric distance calculated above for the TWA group would then reduce to pc, which locates the group pc beyond stars in the TWA group while still remaining consistent with the astrometric distance to HD 102458 and other members of the LCC subgroup.
5 Summary
Our photometric study of 16 members of 12 TWA systems found that stars measured in the TWA group led by TW Hya have a distribution of rotation periods (median period d) that differs significantly from that measured for stars in the TWA group (median period d). The two rotation period distributions cannot be reconciled at the 3- significance level; see Sections 3 and 4.1 for details of the light curve analysis. Summarizing our discussions presented in Section 4.2, the TWA group likely resides at an average distance of pc, coincident with the Hipparcos distance to HD 102458 (= TWA 19A) of pc and the location of the near boundary of the LCC subgroup at pc. HD 102458, TWA 14, 18 and 19B also have proper motions consistent with the LCC subgroup. From the derived age of HD 102458, these stars might also be Myr older than the TW Hya group ( Myr versus Myr), compatible with the ages derived for LCC subgroup PMS stars and candidate members by Mamajek et al. (2002).
The difference in the rotation period distributions of the two groups of TWA stars may be further evidence that the TWA group have a greater age than the TWA group; these stars may have had an additional Myr to undergo rotational spin-up following dissipation of their circumstellar discs. The disc dispersal process in low mass PMS stars might even be accelerated within the environs of an OB-star association compared to that for a dispersed PMS group such as TWA , e.g. winds from resident O- and B-type stars or an aggressive dynamical environment within the association might prematurely disrupt their discs.
We conclude that the two groups of TWA stars, TWA and TWA , are spatially- and rotationally-distinct populations of PMS stars that might also differ in age by a factor of . The availability of rotation periods has been a useful tool to help distinguish these two populations. We therefore do not consider that the stars denoted TWA represent an extension of the original TWA as proposed by Zuckerman et al. (2001a). Most likely they are representive of the population of low mass PMS stars still physically associated with the LCC subgroup of the OSCA.
Acknowledgments
We thank the SAAO Time Allocation Committee for the generous award of telescope time towards this and other projects related to the study of the nearest PMS populations. We also thank Rich Webb for providing us with pre-publication identifications for TWA , and Eric Feigelson for useful discussions concerning this work. We made extensive use of the SIMBAD and VizieR databases held at the Centre de Données astronomiques de Strasbourg. WAL’s research is supported by UNSW@ADFA Faculty Research Grants and Special Research Grants. LAC acknowledges support from the National Research Foundation and the University of Cape Town.
References
- Alencar & Batalha (2002) Alencar S. H. P., Batalha C., 2002, ApJ, 571, 378
- Batalha et al. (2002) Batalha C. C, Batalha N. M., Alencar S. H. P., Lopes D. F., Duarte E. S., 2002, ApJ, 580, 343
- Bouvier et al. (1993) Bouvier J., Cabrit S., Fernández M., Martín E. L., Matthews J. M., 1993, A&A, 272, 176
- (4) de Geus E., de Zeeuw P., Lub J., 1989, A&A, 216, 44
- Feigelson et al. (2003) Feigelson E. D., Lawson W. A., Garmire G. P., 2003, ApJ, 599, 1207
- Herbig (1978) Herbig G. H., 1978, in Origin of the Solar System, Wiley-Interscience, New York, p. 219
- (7) Jensen E. L. N., Cohen D. H., Neuhäuser R., 1998, AJ, 116, 414
- Kenyon & Hartmann (1995) Kenyon S. J.., Hartmann L., 1995, ApJS, 101, 117
- Koen & Eyer (2002) Koen C., Eyer L., 2002, MNRAS, 331, 45
- Lawson, Feigelson & Huenemorder (1996) Lawson W. A., Feigelson E. D., Huenemorder D. P., 1996, MNRAS, 280, 1071
- Lawson et al. (2001) Lawson W. A., Crause L. A., Mamajek E. E., Feigelson E. D., 2001, MNRAS, 321, 57
- Lawson et al. (2002) Lawson W. A., Crause L. A., Mamajek E. E., Feigelson E. D., 2002, MNRAS, 329, L29
- Lawson, Lyo & Muzerolle (2004) Lawson W. A., Lyo A-R., Muzerolle J., 2004, MNRAS, 351, L39
- Lyo et al. (2003) Lyo A-R., Lawson W. A., Mamajek E. E., Feigelson E. D., Sung E-C., Crause L. A., 2003, MNRAS, 338, 616
- Lyo, Lawson & Bessell (2004) Lyo A-R., Lawson W. A., Bessell M. S., 2004, MNRAS, 355, in press
- Mamajek et al. (1999) Mamajek E. E., Lawson W. A., Feigelson E. D., 1999, ApJ, 516, L77
- Mamajek et al. (2000) Mamajek E. E., Lawson W. A., Feigelson E. D., 2000, ApJ, 544, 356
- Mamajek et al. (2002) Mamajek E. E., Meyer M. R., Liebert J., 2002, AJ, 124, 1670
- Muzerolle et al. (2000) Muzerolle J., Calvet N., Briceño C., Hartmann L., Hillenbrand L., 2000, ApJ, 535, L47
- Rebull et al. (2004) Rebull L. M., Wolff S. C., Strom S. E., 2004, AJ, 127, 1029
- Reid (2003) Reid N., 2003, MNRAS, 342, 837
- Siess et al. (2000) Siess L., Dufour E., Forestini M., 2000, A&A, 358, 593
- (23) Song I., Bessell M.S., Zuckerman B., 2002, A&A, 385, 862
- Song et al. (2003) Song I., Zuckerman B., Bessell M.S., 2003, ApJ, 599, 342
- Sterzik et al. (1999) Sterzik M. F., Alcalá J. M., Covino E., Petr M. G., 1999, A&A, 346, L41
- Torres et al. (2003) Torres G., Guenther E. W., Marschall L. A., Neuhäuser R., Latham D. W., Stefanik R. P., 2003, AJ, 125, 825
- Webb et al. (1999) Webb R. A., Zuckerman B., Platais I., Patience J., White R. J., Schwartz M. J., McCarthy C., 1999, ApJ, 512, L63
- Uchida et al. (2004) Uchida K. I., et al., 2004, ApJS, 154, 439
- Zuckerman et al. (2001a) Zuckerman, B., Webb R. A., Schwartz M., Becklin E. E., 2001a, ApJ, 549, L233
- Zuckerman et al. (2001b) Zuckerman, B., Song I., Bessell M. S., Webb R. A., 2001b, ApJ, 562, L87