11email: roberto.nesci@uniroma1.it
Optical follow-up of BL Lac candidates in the 2BL sample
We investigate the nature of the BL Lac candidates in the northern part of the 2BL sample (Londish et al. (2002)) searching for optical variability by means of band photometry with the Asiago 1.8 and Loiano 1.5 meter telescopes during years 2002, 2003 and 2004. We also made aperture photometry of the candidates on the plates available on the web from the Palomar and UK Schmidt telescopes. No significant variability was detected for the majority of the objects without detected radio and/or X-ray emissions, while clear variability was found for the few sources of the sample with strong radio and/or X-ray emission, which is a constant feature of the ”classical” BL Lacs. Some considerations on the nature of the 2BL sources are made, taking into account their most recent data available in proper motions catalogues (SuperCOSMOS, USNO-B1) and in the Sloan Digital Sky Survey.
Key Words.:
galaxies: active – galaxies: BL Lacertae objects: general1 Introduction
The history of the BL Lacertae objects started in 1968 (Schmitt (1968)) with the discovery of the radio emission from the prototype of the class, the variable “star” BL Lac. A few years later, after that some other similar objects have been found (OJ 287, W Com, ON 325 and AP Lib), Strittmatter et al. (1972) made the first definition of the class. Subsequent observations with X-ray satellites showed that BL Lac objects were also remarkable X-ray sources. The first attempts to derive a sample of BL Lacs starting from catalogues of optically variabile sources were unfruitful, while those based on Flat Spectrum Radio Sources provided soon a good deal of objects, indicating that the radio emission was a better discriminant. Several samples of BL Lac objects have been collected up to now, using different selection criteria (e.g. 1 Jy sample, Stickel et al. (1991); Extended Medium Sensitivity Survey, Morris et al. (1991), Wolter et al. (1994); Rosat-Greenbank survey, Laurent-Muehleisen et al. (1999); Sedentary Survey, Giommi et al. (1999), DXRBS, Landt et al. (2001); HRX-BL Lac survey, Beckmann et al. (2003)). In all these samples, the presence of a non thermal radio or/and X-ray emission was required.
Nowadays, BL Lac objects are considered a subsample of the population of the Active Galactic Nuclei, and are generally defined as sources with featureless optical spectra, strong and fast variability in the radio, optical and X-ray bands, strong and variable radio and X-ray emission and often with a high degree of polarization. The precise definition of the BL Lac class is still a matter of debate: the optical spectrum was defined as “featureless” if the equivalent widths of the emission lines were less than 5 Å and/or the CaII break was less than 0.25 (Stocke et al. (1991)). This definition was later relaxed by Marchã et al. (1996) who included in the BL Lac class also objects with stronger features (e.g. CaII break 0.40). A recent discussion of these criteria was made by Landt et al. (2004), who pointed out that the relative intensity of the AGN and of the host galaxy is a key factor for the optical line equivalent width.
Recently Londish et al. (2002) defined the first “optically selected” sample of BL Lac candidates, the 2BL sample, as a by-product of the 2QZ sample of QSO (Croom et al. (2001)). Two strips of sky were surveyed by the 2QZ project: one centered on the celestial equator and one at declination 30. The selection of the QSO candidates was made on UK Schmidt photographic plates scanned with the APM, searching for point-like sources with photographic and Quasar-like colours. Spectra for these candidates were then obtained with the 2dF fiber spectrograph mounted on the 3.9 m AAT telescope. BL Lac candidates were selected from these spectra, looking for objects in the magnitude range (19.9718.25) and appearing featureless. High proper motion sources were then rejected as probable DC white dwarfs.
The remarkable feature of this sample is that the large majority of the sources (47 out of 56) have no radio emission at the NVSS (Condon et al. (1998)) sensitivity level (2.5 mJy) and that only 5 sources have been detected on the ROSAT All Sky Survey (RASS; Voges et al. (1999), Voges et al. (2000)), all of them being radio loud. Only three of these RASS sources were already reported in the literature as BL Lacs. The lack of X-ray and Radio emission in the large majority of the 2BL sources is puzzling, because it implies an emission model somehow different from that generally accepted for BL Lacs.
The Spectral Energy Distribution (SED) of BL Lacs is indeed well represented, in the Log()-Log() plane, by a double-bell shape. The first bump may be well described by a log-parabolic law (Landau et al. (1986); Massaro et al. 2004a ) and can be explained by a synchrotron radiation from relativistic electrons moving in a jet aligned along our line of sight; the second one, from X to -ray energies, is presently less well constrained in shape by the observations and is generally attributed to Inverse Compton scattering of low-energy photons on the same relativistic electrons. According to the peak frequency of the first bump, BL Lac objects are further subdivided into HBL (high-energy peaked) and LBL (low-energy peaked), following the scheme introduced by Giommi & Padovani (1994).
The faintness (actually upper limits) of the radio/optical and X-ray/optical ratios of the 2BL objects means that the low-energy bump of the SED is much narrower than that of the “typical” BL Lacs. There is however no doubt about the extragalactic nature of a number of 2BL sources: some of them have indeed a definite redshift from faint emission or absorption lines. The most notable case is 2QZ J215454.3305654 (Londish et al. (2004)), a radio- and X-quiet source which appeared featureless in the 2dF spectrum but showed a redshift in a high S/N spectrum obtained with the ESO-VLT. A thermal origin for the bulk of the emission (e.g. from an accretion disk) rather than from a synchrotron process might be an explanation, as suggested by Londish et al. (2004): this raises however the question whether such sources can still be properly classified as BL Lacs.
To further explore the characteristics of the 2BL candidates we performed a search for optical variability, which is one of the defining features of the class. In the optical range the LBL sources show a large variability (3-4 magnitudes), while HBL sources show a moderate variability range (about half magnitude, see e.g. Heidt & Wagner (1996); Kurtanidze & Nikolashvili (2002); Marchili et al. (2004)). It is, however, unlikely that the 2BL candidates are of the HBL type: actually their plot in the radio-optical and optical-X spectral index plane (, Londish et al. (2002) fig. 13) shows that all the X-ray undetected sources have , while HBL sources have (Beckmann et al. (2003)). We expect therefore to detect a variation of the order of at least several tenths of magnitude if the 2BL candidates behave like “normal” LBLs.
In this paper we report the results of our optical observations, covering a time interval of three years (2002-2004), of the 2BL sources well observable from northern mid-latitudes (the equatorial 2BL sample). Furthermore we retrieved from on-line archives (ESO, STScI) a number of the Palomar and UK-ESO Schmidt survey plates and derived photographic red magnitudes to explore the historical behaviour of these sources. Finally, we considered the Sloan Digital Sky Survey Data Release 2 (SDSS-DR2, http://www.sdss.org/dr2/) photometric and proper motion data, recently availables for all the sources of the equatorial sample.
In October 2003 Londish revised the 2BL sample in her PhD thesis (Londish (2003)) using, for a number of sources, updated proper motions from the SuperCOSMOS sky survey, 5 band photometry from the Sloan Digital Sky Survey Early Data Release (Stoughton et al. (2002)), her own JHK and optical photometry. These data allowed to recognize a number of candidates in the former (Londish et al. (2002)) list as probable white dwarfs (from proper motion, variability or black-body spectral energy distribution). We present anyway in this paper our observational results for all the sources monitored by us, even if some of them are most likely stellar.
2 Observations
2.1 CCD observations
The 2BL sample (Londish et al. (2002)) consists of 56 objects. We found that two sources in the equatorial strip, 2QZ J105534.36012617 and 2QZ J121834.8011955, both detected in the NVSS, were already classified as BL Lac objects. The former was identified because detected in the RASS with a flux of (Appenzeller et al. (1998)) while the latter was known as the optical counterpart of a radio source in the PKS catalogue (Condon et al. (1976)).
Our follow-up observations were made during the years 2002, 2003 and 2004 in the band with the Asiago (1.8 m) and Loiano (1.5 m) telescopes, respectively equipped with the AFOSC and BFOSC instruments, covering a field of view slightly larger than 8 arcmin. Some Asiago observations were made in service mode. Weather conditions did not permit a uniform time sampling for all the objects. Table 1 reports the dates of the observing runs.
|
Twentynine out the 31 sources in the equatorial strip were observed. The typical integration time for the esposures was 10 minutes; two exposures were made for the fainter sources and then averaged. The three “radio detected” candidates of the equatorial strip (i.e. 2QZ J105534.36012617, 2QZ J121834.88011956 and 2QZ J142526.20011826) were initially not included in the monitoring list so our sampling for them is poorer. Two sources, 2QZ J114221.4014812 (redshift =1.276) and 2QZ J114327.3005050 (redshift 1.591; Londish et al. (2002)), were never observed.
Differential photometry of the BL Lac candidates was performed using a set of about ten stars in the field of each source, spanning a range of two or three magnitudes around the object of interest. These were selected so that 5 stars were nearly as faint as the target, to estimate the actual photometric accuracy achievable (check stars), while the brighter ones were used to put on a common scale the instrumental magnitudes from different runs (reference stars). The zero point of the magnitudes for each field has been established adopting the GSC2 magnitude for the brightest reference star. A table of the adopted reference stars and magnitudes is given in Appendix (Table A1). For each frame a photometric radius equal to the average FWHM of the reference stars was used. Aperture photometry was carried out using the DAOPHOT routine of the IRAF package. All the 2BL sources showed a point-like PSF in our images.
During the consistency check between the instrumental magnitudes obtained with the two telescopes, an appreciable systematic difference was found for a few stars: inspection of their colours using the public SDSS magnitudes showed that this difference was present only for “red” star (SDSS 0.7). These stars were then discarded for the magnitude zero point definition in the final data reduction. In no field did we find more than one “red” star. The typical average accuracy of our magnitudes as a function of a star luminosity can be derived from Fig. 1, where the rms deviation of the instrumental magnitudes for each check star of all our fields is plotted against its average magnitude, separately for the Asiago (crosses) and Loiano (squares) data sets. The general trend of this plot is of a larger dispersion for fainter stars, as expected. Some stars however show a very large dispersion, so we considered them as variables and discarded them as check stars in the data analysis.
To discriminate between true variability of a BL Lac candidate and photometric uncertainty we binned the magnitude values of the check stars at steps of 0.4 mag and computed for each bin the average rms value and the dispersion of the data around this average. Then we assumed as upper limit of the ”statistical” deviations for each bin its average rms plus the dispersion. A smooth line approximating these upper limits is shown in Fig. 1 and was adopted as the border-line for detecting variability.

Table 2 gives the source name, the photographic red magnitude derived from the and () values published by Londish et al. (2002), the average magnitude, rms deviation and number of observations for the Loiano and Asiago datasets and the border-line value of the photometric uncertainty.
|
A first consideration from the data of Table 2 is that, for the large majority of the sources, the average magnitudes in the Asiago and Loiano datasets are very similar, but the Loiano values are systematically slightly brighter, on average by 0.04 mag. Given that the Loiano and Asiago observations were made each year typically at an interval of about one month (see Table 1, it is unlikely that we observed our sources always in a brighter state at one telescope, so we attribute this difference mainly to the presence of a colour equation in the instrumental magnitudes rather than to intrinsic source variability. We applied therefore a systematic correction of 0.04 mag to the Asiago (the less numerous) data quoted in Table 2 before merging the two datasets.
A second consideration is that generally the rms deviations of both datasets are smaller than the borderline derived from the comparison stars, highly suggestive of a limited, if any, optical variability, at variance with the expectations for BL Lac objects.
The resulting light curves are shown in Figs 2 to 6 where we plot for each object our magnitudes and error estimates. The average value is shown as a dashed line, while the range () of the distribution of the magnitudes of each source is shown by the dotted lines.
We found large variability only for two sources: 121801, a radio loud (not X-ray detected) source, and 1106+00, which has a hot (32000 K) thermal spectrum according to the SDSS photometry (Londish (2003)). The latter source is very faint ( 20.3, by far the faintest of our sample), and our photometry is rather inaccurate at this flux level (expected rms 0.14) so we are unsure of its variability.
A comparison of our data with the photographic 2QZ values in Londish et al. (2002) (column 3 of our Table 2) is not straightforward because of the possible presence of systematic effects in the magnitude scale for each field, and to the limited accuracy of photographic plates at these magnitudes. Both APM and GSC2 magnitudes have a formal error of 0.3 mag, which may be even larger at 19.5. We have checked for our “bright” ( 18.5) reference stars the consistency between GSC2 and our CCD magnitudes, finding always agreement within the formal accuracy of the GSC2. Consistency between our magnitudes and those given in the on-line APM catalogue (http://www.ast.cam.ac.uk/apmcat/) was good (i.e. within the formal error) for stars brighter than 19, while strong differences were found for the fainter sources. We decided therefore to consider as real only a difference greater than 0.3 mag between our values and those derived from Londish et al. (2002).
Using the 2QZ photographic data, the variability of 121801 is confirmed and two more sources, 105501 (also with a NVSS radio detection) and 141002 (radio quiet), are found to be varied. The variability of 123401, 1400+00, 140201 and 142501 is also possible, while we cannot get any firm conclusion regarding 1106+00 because only a lower limit ( 20.9) can be derived from Londish et al. (2002).


2.2 Historical photographic data
For each object we retrieved all the scanned images available on-line coming from the POSS1 and POSS2 Surveys and the UK-Schmidt plates in the red (E or F emulsion) band. Differential aperture photometry of the 2BL objects was made with the DAOPHOT routine of the IRAF package, using the same reference stars selected for the CCD frames: the photometric radius was taken equal to the average FWHM of the bright reference stars. Conversion from photographic magnitudes to our CCD magnitude scale was made building a calibration curve for each image by means of the reference stars: the CCD magnitude of the 2BL object was determined by interpolation between the nearest experimental points of this curve and it had an uncertainty of about 0.2 magnitudes. Only in a few plates was the object found to be apparently lower than our faintest reference star: in this cases we extended our CCD sequence to encompass the apparent magnitude of the candidate BL Lac on the plate.
The historical (in our CCD- scale) magnitudes so derived are reported in Table 3 for each object and epoch: the first column gives the source name shortened to the most significant digits of RA and DEC (HHMMsDD); subsequent columns give our estimated magnitude for each year. For some fields we found more than one plate in a given year, and their magnitudes are reported in subsequent lines. When the source was too faint on the plate to be reliably measured we report a lower limit.
| name | 1952 | 1955 | 1956 | 1985 | 1986 | 1987 | 1988 | 1989 | 1991 | 1994 | 1995 | 1996 | 1997 | 1998 |
|---|---|---|---|---|---|---|---|---|---|---|---|---|---|---|
| 1002-00 | 19.0 | 19.0 | 18.9 | |||||||||||
| 1026-00 | 19.6 | 19.3 | 19.1 | |||||||||||
| 1036+01 | 19.9 | 18.7 | ||||||||||||
| 18.7 | ||||||||||||||
| 1045+00 | 18.2 | 18.6 | ||||||||||||
| 1053-00 | 19.0 | 19.4 | 19.0 | 19.8 | ||||||||||
| 1055-01 | 18.8 | 18.5 | 17.6 | |||||||||||
| 1106+00 | 20.0 | 20.1 | 20.5 | |||||||||||
| 1134+00 | 18.2 | 18.1 | 18.4 | |||||||||||
| 18.1 | ||||||||||||||
| 1139-02 | 19.1 | 19.2 | ||||||||||||
| 1140-00 | 19.8 | 19.8 | ||||||||||||
| 1141-00 | 19.5 | 18.7 | ||||||||||||
| 1145-02 | 18.5 | 18.5 | ||||||||||||
| 1145+00 | 19.1 | 19.2 | ||||||||||||
| 1159-02 | 19.0 | 18.8 | 18.8 | |||||||||||
| 18.8 | ||||||||||||||
| 1200+00 | 19.0 | 18.8 | 18.8 | |||||||||||
| 1205-00 | 18.5 | 18.5 | 18.5 | |||||||||||
| 1208-00 | 18.5 | 18.8 | 18.8 | |||||||||||
| 1218-01 | 17.6 | 18.6 | 18.5 | |||||||||||
| 18.1 | ||||||||||||||
| 1223-01 | 18.6 | 19.2 | 19.2 | |||||||||||
| 1234-01 | 18.5 | 18.6 | 18.9 | 18.6 | ||||||||||
| 19.1 | ||||||||||||||
| 1254-01 | 18.9 | 18.9 | 19.0 | |||||||||||
| 19.0 | ||||||||||||||
| 1300-02 | 19.2 | 18.8 | 18.9 | |||||||||||
| 1316-00 | 19.8 | 19.9 | 20.1 | |||||||||||
| 1328+00 | 19.5 | 19.6 | 19.5 | |||||||||||
| 1400+00 | 19.9 | 19.5 | 19.5 | |||||||||||
| 1402-01 | 19.8 | 20.0 | 20.0 | |||||||||||
| 1409-00 | 18.7 | 18.6 | 18.5 | |||||||||||
| 1410-02 | 18.5 | 18.8 | 18.9 | 18.7 | ||||||||||
| 19.1 | 18.6 | |||||||||||||
| 19.0 | ||||||||||||||
| 1425-01 | 20.0 | 19.7 | 19.4 |
Given the low accuracy achievable for the magnitudes of our sources from the Survey photographic plates, we assume that variability is believable only if a variation of at least 0.6 mag is detected. Small amplitude variability of our objects is therefore not testable in this way. Only eight sources seem to be variable: 1036+01, 105300, 105501, 114100, 121801, 122301, 141002 and 142501. All the three radio loud sources are variable and two of them (105501 and 121801) varied most significantly, as expected for classical BL Lac objects.
2.3 SDSS and proper motion data
At the time of writing this paper (October 2004) all the objects in the equatorial strip of the 2BL sample (save the radio loud source 105501) have been observed photometrically (and several also spectroscopically) by the Sloan Digital Sky Survey (SDSS) and publicly available through the Data Release 2 (DR2). This release covers a larger sky area and supersedes the Early Data Release (EDR, Stoughton et al. (2002)) used by Londish (2003). The DR2 photometric observations include 5 bands () covering the optical spectral range from 3500 to 9100 Å, so that they allow us to check whether the spectral energy distribution is consistent with a black body (as expected for a DC white dwarf) or with a power law () which is typical of a BL Lac source. Typical values for range between 1 and 2 for LBL sources (e.g. Vagnetti et al. (2003)), but may be flatter for HBL objects.
We performed this test for our sources, applying a correction of 0.04 to the published magnitudes and +0.02 to the magnitudes, as indicated in the relevant SDSS web page. A correction for the galactic extinction was also made, following Schlegel et al. (1998), which anyway is always small ( 0.055), given the high galactic latitudes of the sources. To compute the of the fit we assumed an error of 0.03 mag for each photometric band, including any systematic effect. The results came out to be largely independent of the assumed reddening correction and of the systematic corrections stated above: in no case did a “good” black-body fit switch into a power-law one (or vice/versa) including/excluding any of the above corrections. There are anyway a few cases with no good fit with either spectral shape, which remained “bad” also tuning the above corrections. The values of spectral indices range between 0.0 and 1.4, which are reasonable for AGNs. Our fits of the spectral shapes with a black body distribution give temperature values in fair agreement with the previous results by Londish (2003), save 1106+00 which is very hot ( 130,000 K).
We report in Table 4 several quantities for each source: source shortened name (column 1), the SDSS magnitude (column 2), the SDSS spectral classification (Sp. Cl., column 3 : Unclass means that the spectrum is too poor according to the SDSS team for a classification, while n.a. indicates a not available spectrum). In column 4 and 5 we report our best fit respectively for the spectral shape given as a temperature (in K) in case of a black body (BB) or as a spectral index for a power law (PL). Column 6 gives the of the fit: there are 3 degrees of freedom in the fit, so values greater than 9 means that the fit is acceptable only at a confidence level less than 2.5%. Columns 7, 8, 9 give the source proper motion according, respectively, to the SDSS, the USNO-B1 (Monet et al. (2003)) catalogue and the SuperCOSMOS Science Archive (SSA, http://surveys.roe.ac.uk/ssa/): these motions are indicated in units of their rms deviation for the SDSS and SSA while for the USNO-B1 the proper motion probability is reported as given by the CDS, with 9 meaning more than 90%.
|
|||||||||||||||||||||||||||||||||||||||||||||||||||||||||||||||||||||||||||||||||||||||||||||||||||||||||||||||||||||||||||||||||||||||||||||||||||||||||||||||||||||||||||||||||||||||||||||||||||||||||||||||||||||||||||||||||||||||||||||||||||||||||||||||||||||||||||||||||||||||||
An approximate conversion of the SDSS magnitudes into our GSC2-based magnitudes may be made assuming 0.23 (see Fukugita et al. (1996)). Given that the zero points of our magnitude scale for our fields may have a systematic offset of about 0.2 mag, we considered as variable only those sources which have a magnitude difference, with respect to our Loiano values, 0.3 mag. Three objects appear to be variable from this comparison, 114100, 121801 and 142501, the last two being radio loud; all these 3 objects appear variable also in the historical survey plates.
| Source | Our monitoring | Londish | On line plates | SDSS | Radio data | Flag | |
|---|---|---|---|---|---|---|---|
| mJy | mJy | ||||||
| 100200 | no | no | no | no | X | ||
| 102600 | no | no | no | no | X | ||
| 103601 | no | no | yes | no | 0.1 | ||
| 104500 | no | no | no | no | X | ||
| 105300 | no | no | yes | no | 0.1 | ||
| 105501 | no | yes | yes | - | 11 | ||
| 110600 | possibly | ? | no | no | 0.1 | ||
| 113400 | no | no | no | no | |||
| 113902 | no | no | no | no | |||
| 114000 | no | no | no | no | X | ||
| 114100 | possibly | possibly | yes | yes | 3.6 | ||
| 114502 | no | no | no | no | X | ||
| 114500 | no | no | no | no | |||
| 115902 | no | no | no | no | 0.3 | ||
| 120000 | no | no | no | no | |||
| 120500 | no | no | no | no | X | ||
| 120800 | no | no | no | no | X | ||
| 121801 | yes | yes | yes | yes | 244 | ||
| 122301 | no | no | yes | no | X | ||
| 123401 | no | possibly | no | no | |||
| 125401 | no | no | no | no | |||
| 130002 | no | no | no | no | X | ||
| 131600 | no | no | no | no | X | ||
| 132800 | no | no | no | no | X | ||
| 140000 | no | no | possibly | no | 0.3 | X | |
| 140201 | possibly | possibly | no | no | 0.1 | ||
| 140900 | no | no | no | no | X | ||
| 141002 | no | yes | yes | no | |||
| 142501 | no | possibly | yes | yes | 10 | ||
1. Flux density from NVSS.
2. Flux density from Londish et al. (2002), Londish (2003)
3 Variability properties
Flux variability at optical frequencies is one of the characteristics of the BL Lac objects. The most monitored sources are generally LBL sources which show no definite time scale and a range of variability of a few magnitudes. HBL sources are generally considered to be less variable in the optical; however most of the well studied HBL’s like the so-called TeV blazars (e.g. Mkn 421, Mkn 501, 1ES 2344+514, 1ES 1959+650) are relatively nearby sources with a strong host galaxy, so that the apparent luminosity variation in the optical is reduced by the steady stellar component of the integrated flux. As told in the Introduction, however, our sources are not likely to be HBL, given the undetection of their X-ray flux.
We collect in Table 5 our evaluations of the variability of each source (column 1) in our data (column 2), with respect to the photographic 2QZ data (column 3), to the older historical data (column 4) and to the SDSS photometry (column 5). In columns 6, 7 we report the radio flux in mJy respectively at the frequencies of 1.4 and 8.4 GHz according to Londish et al. (2002) and Londish (2003). The flag X in the last column marks objects excluded from the 2BL sample by Londish (2003).
The results of our variability search may be summarized as follows:
i) only one source (121801, radio-loud) showed large variability in our CCD monitoring (we will discuss on it in more detail at the end of the section);
ii) three sources (two of them radio-loud) showed variability when the 2QZ photographic data are compared with our CCD data;
iii) eight sources (including all the 3 radio-loud) showed variability when the public digitized Sky Survey plates (spanning a 50 years interval) are measured using our reference CCD sequences.
iv) three sources showed variability comparing our CCD data with those of the SDSS, two of them being radio-loud (the third radio-loud source is still not observed by the SDSS).
This gives a total of eight variable sources out of the 29 observed, as indicated in Table 5. Notably, none of the 3 sources with a spectroscopically confirmed stellar spectrum showed variability in our study.
Of these 8 sources:
a) three are radio loud (105501, 121801, 142501); the first two were also detected in the J, H and K bands by the 2MASS survey, with magnitudes 16.7, 16.0, 15.3 (105501) and 15.2, 14.4, 13.5 (121801); the last two have also SDSS 5-band photometry which give unambiguous power law SEDs.
b) one is a radio-quiet QSO (1036+01) with a power law spectrum;
c) one has a power law spectrum (114100) and a faint radio detection, but strong proper motion in the SDSS/USNO-B1;
d) three have a possible hot black body spectrum (105300, 122301 and 141002) and also a possible proper motion detection: our power-law fit gives for all these sources values much worse then the black-body. 122301 was excluded from the sample by Londish (2003) due to its proper motion; 141002 has a strong proper motion in the SDSS/USNO-B1 catalogues.
From our combined variability and spectral shape study, therefore, it seems that all the 3 radio loud sources among the 2BL candidates in the equatorial strip have a variability behaviour similar to “classical” BL Lac objects. We remark that only 4 of the sources found to be variable are definitely of extragalactic nature.
What about the 21 non-variable sources (at least at our sensitivity level)? Twelve of them have already been excluded by the 2BL sample by Londish (2003); our reanalysis of the spectral energy distribution and proper motions confirm that they are most likely stellar sources (see Table 5). Of the remaining 9, one is a spectroscopically confirmed star (140201); 2 are QSOs (1134+00 and 1200+00); 2 have a black-body spectral shape and probable detected proper motion (1145+00 and 125401); only two have a power-law spectrum (113902 and 115902), the second one with a faint radio detection at 8.4 GHz (Londish (2003)). Finally, 123401 has an intervening absorber at z1.06, according to Londish (2003), and is therefore most likely an extragalactic source.
Only 5 of the non-variable sources are surely or probably extragalactic. Summed to the 4 variable ones, we get a total of 9 AGNs, some of them with unclear nature. We have checked that the equivalent width of the emission lines in the sources classified as QSO in the SDSS are much larger ( 40 Å) than the classical 5 Å limit by Stocke et al. (1991) or the extended limit of 30 Å by Marchã et al. (1996) and should not be considered therefore as BL Lac objects.
A remarkable case is that of 121801. It was identified by Condon et al. (1976) as the optical counterpart of the radio source PKS B1216-010 with a featureless spectrum (Wilkes et al. 1984). UBV photometry (Adam 1985) indicates that it was even brighter than in our observations, and considering the faint state reported by Londish et al. (2002) one can estimate a variation range of at least 3 magnitudes. A redshift is reported in the literature after Downes et al. (1985) who quote a private communication never confirmed by any subsequent published line identification. Radio images from VLBA calibrator survey show a compact bright core (Beasley et al. 2002). It is therefore a very typical bright BL Lac object included in the 2BL sample because of an occasional faint state.
4 Conclusion
The main problem we faced on in this work is how to identify and classify BL Lac objects. Of course, the mere observation of a featureless optical spectrum is not sufficient although very specific of this class of AGNs. Detection of a significant variability can be a further request, however it could be difficult to be noticed because of the possible occurrence of quiescent periods and of the randomness of observation sampling. Although the failure in detecting a variability does not necessarily imply that a source is not a BL Lac objects, the fact that we observed significant brightness changes mainly in radio loud sources indicates that the search for variations can be a useful strategy to confirm their nature.
It is an open problem if a population of “radio quiet”, i.e. with a radio-optical spectral index less than 0.2 (Giommi & Padovani 2004) BL Lac objects does really exist. At present, evidence for such a type of AGNs is elusive and the 2BL sample must be considered partially contaminated by other types of objects, mainly of stellar nature. We tried to establish what should be the SED of a source to be properly considered as a “radio quiet” BL Lac. It is known that the synchrotron emission in many LBL objects covers the frequency interval from radio to the optical-UV: the energy distribution is generally well represented by a log-parabola (Landau et al. (1986), Massaro et al. 2004a ), also combined with a power law on the low frequency side (Massaro et al. 2004b ):
| (1) |
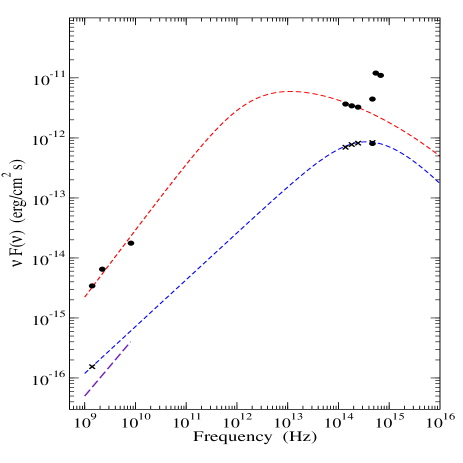
Fig. 7 shows two examples of SEDs of two radio loud BL Lac objects in the 2BL sample. The peak frequency of the brighter (121801) is around 1013 Hz while that of 105501 is in the optical at about 41014 Hz. Of course they are based on not simultaneous data and therefore must be considered only indicative of the actual distributions. Note that if the power-law branch of 105501 would be only moderately flatter than the one plotted in Fig. 7, its radio flux density would be lower than 5 mJy, making the source only marginally detectable in many radio surveys. According to this picture a characteristic of most 2BL sources is that their synchrotron peak must be at frequencies higher than 1014 Hz, which correspond to a flat optical spectrum. Indeed we see from Table 4 that all the sources with a PL spectrum, with the only exception of 113902, have a spectrum flatter than that of 121801 and of typical BL Lacs, with best fit spectral indices greater than 1.0. Consequently, the frequency of their synchrotron peak must be in the optical-UV range. We expect therefore that these sources, differently from 105501 and 121801, would not be very bright in the near IR: in particular, colour indices could be smaller than typical BL Lac values (i.e. between 3 and 4, e.g. Nesci et al. (2003)), making them too faint to be detectable in the 2MASS survey, which has a K-band limit of 14.5 mag (Skrutskie et al. (1995)). In any case, near IR follow-up of these sources would be very helpful to clarify their nature.
The detection of sources with featureless optical spectrum, without a radio and X-ray counterpart, can be a tool to select candidate BL Lacs, however its efficiency cannot be high because of contamination from other galactic and extragalactic objects. A population of “optically” selected BL Lac objects, with characteristic similar to the 2BL sample, should have peculiar spectral properties implying different emission, geometrical and physical conditions with respect to normal BL Lacs. A small number of sources could actually show these characteristics, and further multiwavelenght follow-up of this sample is required to unambiguously pick up them. Our variability search, in fact, indicated that a fraction of 2BL sources are not genuine AGNs. We expect that, in addition to variability studies like that presented in this paper, polarimetric measurements can be another useful selection tool as already successfully applied to radio sources by Impey & Tapia (1988), who discovered new optical faint blazars at high redshift.
Acknowledgements.
We thank Silvano Desidera and Hripsime Navasaradyan for the service-mode observations at the Asiago Observatory. We are also indebted with Corinne Rossi for performing the observations in the February 2004 Asiago run. We grateful to Paolo Giommi and Dario Trevese for useful discussions. This paper makes use of the Sloan Digital Sky Survey Data. Part of this work was supported by the italian MIUR under grant Cofin 2001/028773 and 2003/027534.References
- Adam (1985) Adam G., 1985, A&A 61, 225
- Appenzeller et al. (1998) Appenzeller I., Thiering I., Zickgraf F.J., et al., 1998, ApJS 117, 319
- Beasley et al. (2002) Beasley A.J., Gordon D., Peck A.B., et al. 2002, ApJS 141, 13
- Beckmann et al. (2003) Beckmann V., Engels D., Bade N., et al., 2003, A&A 401, 927
- Condon et al. (1976) Condon J.J., Balonek T.J., Jauncey D.L. 1976, AJ, 81, 913
- Condon et al. (1998) Condon J.J., Cotton W.D., Greisen E.W., et al., 1998, AJ, 115, 1693
- Croom et al. (2001) Croom S.M., Smith R.J., Boyle B.J., et al., 2001, MNRAS 322, L29
- Downes et al. (1985) Downes A., Peacock J. et al. 1985, MNRAS 218, 31
- Fukugita et al. (1996) Fukugita M., Ichikawa T., Gunn J.E., et al., 1996, AJ 111, 1748
- Giommi & Padovani (1994) Giommi P. & Padovani P., 1994, MNRAS 268, L51
- Giommi et al. (1999) Giommi P., Menna M.T., Padovani P., 1999, MNRAS 310, 465
- Heidt & Wagner (1996) Heidt J. & Wagner S.J., 1996, A&A 305, 42
- Impey & Tapia (1988) Impey S.D. & Tapia S., 1988, ApJ 333, 666
- Kurtanidze & Nikolashvili (2002) Kurtanidze O. M., Nikolashvili M. G, 2002, in ”Blazar Astrophysics with BeppoSAX and Other Observatories”, ESA-ESRIN, Frascati, Italy. Edited by P. Giommi, E. Massaro, G.C.C. Palumbo. ESA-ESRIN, p. 189.
- Landau et al. (1986) Landau R., Golisch B., Jones T.J., et al., 1986, ApJ 308, L78
- Landt et al. (2001) Landt H., Padovani P., Perlman E.S., et al., 2001, MNRAS 323, 757
- Landt et al. (2004) Landt H., Padovani P., Perlman E.S., et al., 2004, MNRAS 351, L83
- Laurent-Muehleisen et al. (1999) Laurent-Muehleisen S.A., Kollgaard R.I., Feigelson E.D., et al., 1999, ApJ 525, 127
- Londish et al. (2002) Londish D., Croom S.M., Boyle B.J., et al., 2002 MNRAS 334, 941
- Londish (2003) Londish D., 2003, PhD Thesis, University of Sydney, http://www.physics.usyd.edu.au/dlondish/
- Londish et al. (2004) Londish D., Heidt J., Boyle B.J., et al., 2004, MNRAS 352, 903
- Marchã et al. (1996) Marchã M.J.M., Browne I.W.A., Impey C.D., et al., 1996, MNRAS 281, 425
- Marchili et al. (2004) Marchili N., Tosti G., Fiorucci M., et al. 2004, A&A, submitted
- (24) Massaro E., Perri M., Giommi P., et al., 2004, A&A 413, 489
- (25) Massaro E., Mantovani F., Fanti R., et al, 2004, A&A 423, 935
- Massaro & Mantovani (2004) Massaro E. & Mantovani F., 2004, Proc. 7th EVN Symp., Toledo, October 2004, Edited by R. Bachiller, F. Colomer, J.F. Desmurs, P. de Vicente, Observatorio Astrónomico Nacional, p. 39
- Monet et al. (2003) Monet D.G., Levine S.E., Canzian B., et al., 2003, AJ. 125, 984
- Morris et al. (1991) Morris S.L., Stocke J.T., Gioia I.M., et al., 1991, ApJ 380, 49
- Nesci et al. (2003) Nesci R., Sclavi S., Maesano M., et al., 2003, Mem. SAIt 74, 169
- Perri et al. (2003) Perri M., Massaro E., Giommi P. et al., 2003, A&A 407, 453
- Schlegel et al. (1998) Schlegel D.J., Finkbeiner D.P., Davis M., 1998, ApJ 500, 525
- Schmitt (1968) Schmitt J.L., 1968, Nature 218, 663
- Stickel et al. (1991) Stickel M., Fried J.W., Kuehr H., et al., 1991, ApJ 374, 431
- Stocke et al. (1991) Stocke J.T., Morris S.L., Gioia I., et al., 1991, ApJ 374, 431
- Stoughton et al. (2002) Stoughton C., Lupton R. H., Bernardi M. et al., 2002, AJ 123, 485
- Strittmatter et al. (1972) Strittmatter P.A., Serkowski K., Carswell R., et al., 1972, ApJ 175, L7
- Skrutskie et al. (1995) Skrutskie M.F., Beichman C., Capps, R., et al., 1995, BAAS 27, 1392
- Vagnetti et al. (2003) Vagnetti F., Trevese D., Nesci R., 2003, ApJ 123, 590
- Voges et al. (1999) Voges W., Aschenbach B., Boller T., et al., 1999, A&A 349, 389
- Voges et al. (2000) Voges W., Aschenbach B., Boller T., et al., 2000, IAU Circ. 7432
- Wilkes et al. (1983) Wilkes B.J., Wright A.E., Jauncey D.L. et al., 1983, PASA 5, 2
- Wolter et al. (1994) Wolter A., Caccianiga A., Della Ceca R., et al., 1994, ApJ 433, 29
APPENDIX A
In this Table we give, for each monitored source, the adopted R magnitude of the reference star, used to bring onto a common scale the instrumental magnitudes obtained in the different runs from the Asiago and Loiano telescopes.
Column 1 is the shortened source name, column 2 the star identification in the GSC2 catalogue, column 3 the Right Ascension, column 4 the Declination and column 5 the adopted magnitude as reported in the GSC2.
|