V838 Mon: light echo evolution and distance estimate
Abstract
Following its 2002 February eruption, V838 Mon developed a light echo that continues to expand and evolve as light from the outburst scatters off progressively more distant circumstellar and/or interstellar material. Multi-filter images of the light echo, obtained with the South African Astronomical Observatory (SAAO) 1.0-m telescope between 2002 May and 2004 December, are analysed and made available electronically. The expansion of the light echo is measured from the images and the data compared with models for scattering by a thin sheet and a thin shell of dust. From these model results we infer that the dust is likely in the form of a thin sheet distant from the star, suggesting that the material is of interstellar origin, rather than being from earlier stages in the star’s evolution. Although the fit is uncertain, we derive a stellar distance of kpc and a star-dust distance of pc, in good agreement with recent results reported from other methods. We also present JHKL and Cousins UBVRI photometry obtained at the SAAO during the star’s second, third and fourth observing seasons post-outburst. These data show complex infrared colour behaviour while V838 Mon is slowly brightening in the optical.
keywords:
stars: individual: V838 Mon — stars: photometry — stars: circumstellar matter — stars: interstellar matter — stars: distances — stars: imaging1 Introduction
V838 Mon appeared on the scene with a nova-like outburst of amplitude magnitudes in 2002 January (Brown 2002) and its extraordinary subsequent evolution indicates that this object represents an entirely new type of variable (Munari et al. 2002, Evans et al. 2003). Besides its unique light curve, V838 Mon also underwent dramatic spectral evolution as the star rapidly expanded and cooled, transforming itself from an object vaguely resembling a mid-K giant into what Evans et al. (2003) propose to be the first known L supergiant. The emergence of a blue continuum in spectra obtained in 2002 October (Desidera & Munari 2002, Wagner & Starrfield 2002) suggests that V838 Mon may be a binary, although this early-type star could possibly be a line-of-sight companion. Various unconventional models, including merging main sequence stars (Soker & Tylenda 2004) and an expanding red giant engulfing planets (Retter & Marom 2003), have been proposed to explain the star’s behaviour. More recently, van Loon et al. (2004) argued that V838 Mon may be a single, low-mass AGB star experiencing thermal pulses while Munari et al. (private communication) and Tylenda, Soker & Szczerba (2004) both favour a young binary system with a massive progenitor for the outbursting component. These diverse interpretations of the 2002 phenomena indicate the depth of the mystery surrounding this unusual variable.
Optical imaging 2 weeks after V838 Mon’s 2002 February eruption revealed the development of a light echo (Henden, Munari & Schwartz 2002); the result of light from the outburst being scattered into our line of sight by previously unseen circumstellar and/or interstellar material. We see the echo expanding as the light reaches progressively more distant dust. The only other known Galactic light echo was associated with Nova Persei in 1901 (Couderc 1939) and hence the V838 Mon echo has received widespread attention, particularly following the release of spectacular Hubble Space Telescope (HST) images111See http://hubblesite.org/newscenter/newsdesk/archive/ releases/2004/10/image/.
Aesthetics aside, the light echo also provides important information about this enigmatic star. The observed expansion rate of the echo will eventually yield the nature of the scattering material, as well as the distance to the star and the distance between the star and the dust. Knowledge of V838 Mon’s luminosity will allow stricter evaluation of the various models that attempt to account for the star’s 2002 eruptions. Furthermore, since the light echo illuminates progressively more distant material, each image provides a once-off map of the dust distribution on a given light echo paraboloid. Assembling these maps, taking into account the transformations required to correct for projection effects, would ultimately provide a 3-dimensional reconstruction of the scattering dust.
2 Observations
V838 Mon was included in the SAAO Infrared Service Programme following the initial outburst in 2002 January. Data from the first observing season were presented by Munari et al. (2002) and Crause et al. (2003). Subsequent JHKL measurements, also made with the IRP Mark II photometer on the 0.75-m telescope, are listed in Table 1. As for the first season data, a 36 arcsec aperture was used. Target observations were interspersed with Carter infrared standards (Carter 1995) situated at similar airmasses and the data reduced with SAAO software that interpolates between standard stars to calibrate the sky-subtracted measurements. Given the infrared brightness of V838 Mon, contributions from faint field stars within the aperture are negligible. The typical uncertainty in the corrected magnitudes is 0.03 mag for the JHK data and 0.05 mag for the band observations.
All of the optical images and photometry presented here were obtained with the SAAO 1.0-m telescope and 1k 1k STE4 CCD camera. The CCD was used without prebinning, resulting in a plate scale of 0.31 arcsec pixel-1. During 12 observing runs between 2002 May and 2004 December, imaging was limited to moonless conditions with seeing typically better than 2 arcsec. The CCD frames were bias-subtracted, flat-fielded and trimmed using the ccdproc package within IRAF.
Whenever possible, V838 Mon observations were bracketed with red [ ] Landolt standard stars, but the extreme post-maximum colours [() and () ] required large extrapolations for the standard transformations. PSF-modeling was performed with SAAO software and the resulting Cousins UBVRI photometry is listed in Table 2. The faintness of the star and the low sensitivity of the CCD in the band made it impractical to obtain high signal-to-noise data and so magnitudes are only quoted to one decimal place. Having obtained calibrated photometry at least once during most runs, it was possible to differentially correct additional observations made under non-photometric conditions using field stars located near V838 Mon. These differential measurements are marked with stars in Table 2. Due to V838 Mon’s extreme redness, the short exposures required to prevent saturation limited the accuracy of the band photometry as all comparison stars were severely underexposed.
Throughout this paper we use Julian Dates in abbreviated form, JD–2452000 (AJD). In Section 6 we introduce day numbers that indicate the interval between the 2002 February 5 (AJD 311) outburst peak and the observation in question.
3 Photometry
| AJD | ||||
|---|---|---|---|---|
| 525.663 | 6.72 | 5.35 | 4.32 | 3.05 |
| 529.666 | 6.75 | 5.35 | 4.32 | 3.08 |
| 534.646 | 6.72 | 5.39 | 4.34 | 3.03 |
| 555.555 | 6.64 | 5.32 | 4.30 | 2.96 |
| 563.636 | 6.56 | 5.29 | 4.30 | 2.93 |
| 567.631 | 6.56 | 5.30 | 4.30 | 2.93 |
| 568.619 | 6.54 | 5.31 | 4.30 | 2.94 |
| 572.627 | 6.54 | 5.30 | 4.30 | 2.93 |
| 574.632 | 6.54 | 5.30 | 4.31 | 2.93 |
| 593.555 | 6.51 | 5.31 | 4.32 | 2.93 |
| 603.597 | 6.52 | 5.32 | 4.34 | 2.92 |
| 661.413 | 6.73 | 5.53 | 4.59 | 3.08 |
| 667.421 | 6.71 | 5.54 | 4.62 | 3.11 |
| 688.377 | 6.80 | 5.65 | 4.78 | 3.26 |
| 696.403 | 6.76 | 5.65 | 4.79 | 3.26 |
| 702.371 | 6.82 | 5.70 | 4.86 | 3.35 |
| 753.208 | 6.84 | 5.70 | 4.92 | 3.50 |
| 761.227 | 6.84 | 5.71 | 4.96 | 3.51 |
| 775.201 | 6.86 | 5.72 | 4.99 | 3.55 |
| 894.672 | 6.95 | 5.78 | 5.09 | 3.62 |
| 933.627 | 7.00 | 5.82 | 5.13 | 3.68 |
| 955.596 | 7.03 | 5.86 | 5.16 | 3.68 |
| 969.598 | 7.05 | 5.86 | 5.17 | 3.73 |
| 974.588 | 7.08 | 5.87 | 5.17 | 3.73 |
| 1031.443 | 7.10 | 5.88 | 5.22 | 3.80 |
| 1063.323 | 7.08 | 5.89 | 5.25 | 3.83 |
| 1070.316 | 7.13 | 5.89 | 5.24 | 3.80 |
| 1139.207 | 7.20 | 5.92 | 5.27 | 3.89 |
| 1142.198 | 7.20 | 5.93 | 5.27 | 3.86 |
| 1277.641 | 7.47 | 6.15 | 5.45 | 4.13 |
| 1290.635 | 7.43 | 6.12 | 5.43 | 4.10 |
| 1327.591 | 7.41 | 6.12 | 5.44 | 4.10 |
| 1350.534 | 7.49 | 6.18 | 5.47 | 4.03 |
| AJD | () | () | () | () | |
|---|---|---|---|---|---|
| 529.63 | 16.28 | 0.4 | – | 2.00 | 5.71 |
| 16.30 | 0.4 | – | 2.02 | – | |
| 16.29 | 0.4 | – | 2.03 | 5.72 | |
| 16.28 | – | – | 2.02 | 5.71 | |
| 16.27 | – | – | 2.00 | 5.70 | |
| 16.24 | 0.6 | – | 2.76 | 6.43 | |
| 578.51 | 16.25 | 0.6 | –0.1 | 2.74 | 6.44 |
| 16.26 | 0.5 | – | 2.74 | 6.40 | |
| 16.25 | 0.5 | – | 2.72 | – | |
| 581.54 | 16.27 | 0.5 | – | 2.80 | 6.47 |
| 661.38 | 16.27 | 0.49 | 2.85 | 6.42 | |
| 662.31 | 16.24 | 0.51 | 2.86 | 6.47 | |
| 663.33 | 16.25 | 0.50 | 2.86 | 6.46 | |
| 664.34 | 16.25 | 0.51 | 2.86 | 6.44 | |
| 667.32 | 16.25 | 0.53 | 2.87 | 6.41 | |
| 745.27 | 16.15 | 0.57 | 0.0 | 3.03 | 6.41 |
| 16.12 | 0.56 | – | – | 6.31 | |
| 16.14 | 0.54 | – | 3.06 | 6.36 | |
| 16.13 | 0.63 | – | 3.17 | – | |
| 781.22 | 16.13 | 0.63 | – | 3.03 | 6.33 |
| 16.13 | 0.62 | – | – | – | |
| 16.13 | 0.62 | 0.0 | 3.06 | 6.35 | |
| 15.65 | – | – | 3.08 | 6.08 | |
| 894.64 | 15.65 | – | – | 3.07 | 6.12 |
| 15.65 | 0.88 | – | 3.08 | 6.05 | |
| 15.64 | – | – | 2.94 | – | |
| 15.47 | – | – | 2.67 | 5.85 | |
| 1134.23 | 15.47 | – | – | 2.65 | 5.86 |
| 15.42 | 1.12 | – | 2.62 | 5.81 | |
| 15.18 | – | – | – | – | |
| 15.18 | 0.73 | – | 2.28 | 4.71 | |
| 15.18 | – | – | – | 4.71 | |
| 1350.44 | 15.18 | 0.74 | 0.7 | 2.29 | 4.71 |
| 15.19 | – | – | – | – | |
| 15.19 | 0.73 | – | – | 4.72 |
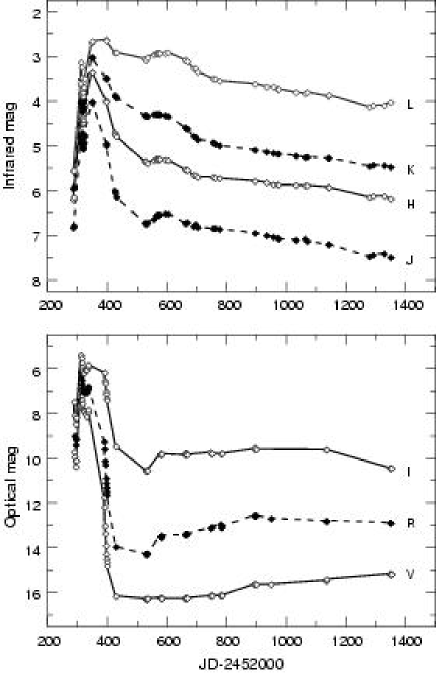
V838 Mon’s complete and light curves are shown in Fig. 1. The and data are relatively sparse and hence were not included in this figure. Note that, to preserve detail in the curves, the vertical scale of the infrared (top) panel is twice that of the optical (bottom) panel. Arbitrary alternating symbols were used to help distinguish the various bands.
During the 4 month interval between the peak of the 2002 outbursts and the star entering conjunction, V838 Mon faded by 9, 8 and 4 magnitudes in , and respectively. The infrared brightness peaked days after the optical maximum and the trend of the fade amplitude decreasing with wavelength continued through the bands. Crause et al. (2003) interpreted this first season photometric behaviour as being indicative of a brief dust formation episode following the third optical outburst, however, this has not been confirmed spectroscopically.
Although the star’s brightness was decreasing in all bands in 2002 June (AJD ), V838 Mon reappeared in 2002 September (AJD ) with all but the band showing a renewed increase. The and bands both brightened by magnitudes before approximately levelling off at 13.5 and 9.8 respectively while the light curves developed a distinct broad peak roughly centred on AJD 600. The onset of this peak corresponds to the time when Evans et al. (2003) classified V838 Mon’s spectrum as that of an L supergiant and the variation in the shape of this bump across the 4 infrared bands, becomming broader and less peaked from through , reflects the dominance of the cool component.
Since the star remained near its minimum optical brightness throughout the second season, the constant photometric contribution from the blue companion can be seen in the () column of Table 2. The steady brightening in the band during the third season is a continuation of the behaviour reported by Crause (2003) when the star emerged from conjunction in 2003 September. A consequence of this brightening is that the () and () colours became bluer while the () colour continued to redden.
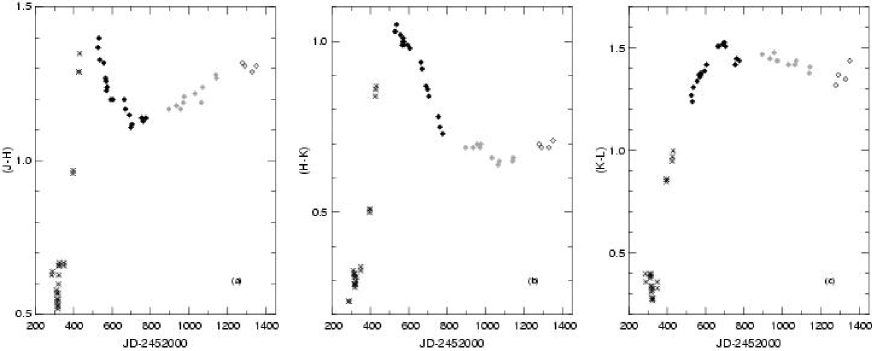
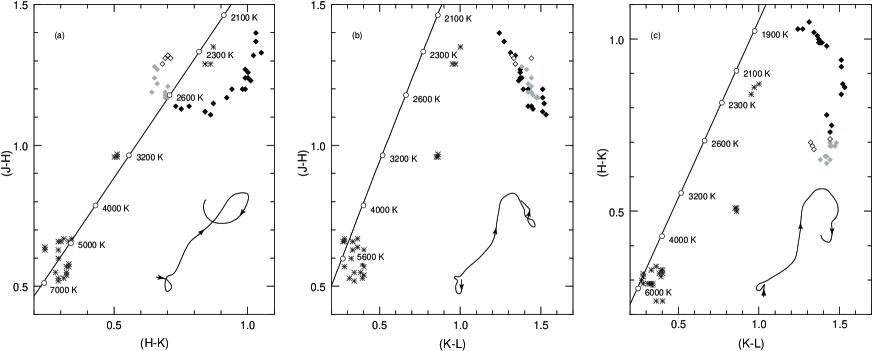
The infrared (), () and () colour curves for V838 Mon are shown in Fig. 2 and the various infrared colour-colour diagrams in Fig. 3. Asterisks mark data from the first season (reported by Munari et al. 2002 and Crause et al. 2003) while diamond symbols indicate those presented in this paper. Data from the second, third and early-fourth seasons are shown as black, grey and open symbols respectively. The gaps roughly centred on AJD 460, 830 and 1200 (2002, 2003 and 2004 July) are due to the star being in conjunction with the Sun.
Figs 2a and 2b show the star recovering from its reddest () and () colours during the second season (2002 September to 2003 May; AJD ) while Fig. 2c reveals that the () colour only reached its reddest value about 170 d after the () and () colours did. Since the third season (2003 September; AJD 895), the () curve showed a redward trend while the () colour became slightly bluer.
V838 Mon’s complex colour behaviour is further illustrated in Fig. 3. Schematic curves in the lower-right corners of the 3 panels indicate the temporal evolution of the colours in each plane. The first and early-second season photometry shows trends in all three colour-colour planes that are generally consistent with the star’s post-outburst evolution towards later spectral types and therefore lower temperatures. The decrease in temperature is illustrated here by comparison with the locus of blackbody colours, after adjustment for reddening at the level of magnitudes found to be appropriate for V838 Mon by Munari, Desidera & Henden (2002). Although blackbody colours are only approximate to the colours of stellar atmospheres, the early evolution of V838 Mon is seen to run roughly parallel to the blackbody lines. The comparison further highlights the shift towards higher () colours in the middle first season data noted by Crause et al. (2003), and interpreted by them as evidence for a short-lived dust formation event. Thereafter, throughout the remainder of the second and third seasons, and now with the availability of early-fourth season photometry, we see the star following complex paths and possibly the development of loops in the colour-colour diagrams. We would hope to elucidate these variations once late-event spectroscopy of the object becomes more readily available in the literature, e.g. the spectrum obtained by Evans et al. (2003), announcing the star as an L-type supergiant, was obtained early in the second season of observations (2002 October 29; AJD 577). Our nearest photometric observation (at AJD 574.6; see Table 1) records the colours of the star to be , and . In Figure 3, this places the star beyond the position of reddest () colour which likely occurred when V838 was in conjunction with the Sun in mid-2002, and during a time of decreasing () and () colour.
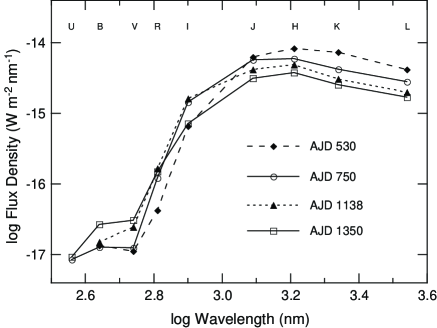
The brightening seen in the band during the third and fourth seasons is in contrast to the near infrared magnitudes that were fading during the same time period; see Figure 1. The spectral energy distribution of the star was calculated at various epochs, corresponding to 2002 September 12 (AJD 530), 2003 April 20 (AJD 750), 2004 May 12 (AJD 1138) and 2004 December 10 (AJD 1350). These curves are shown in Fig. 4 and illustrate changes in the flux distribution between the time of the faintest -band measurement (AJD 530) and our most-recent observations centred at AJD 1350. In particular note the dex (factor of 2.5 in flux, or approximately 1 magnitude) decrease in flux across the near infrared bands, and the nearly similar increase in flux seen in the and bands.
4 Light Echo Images
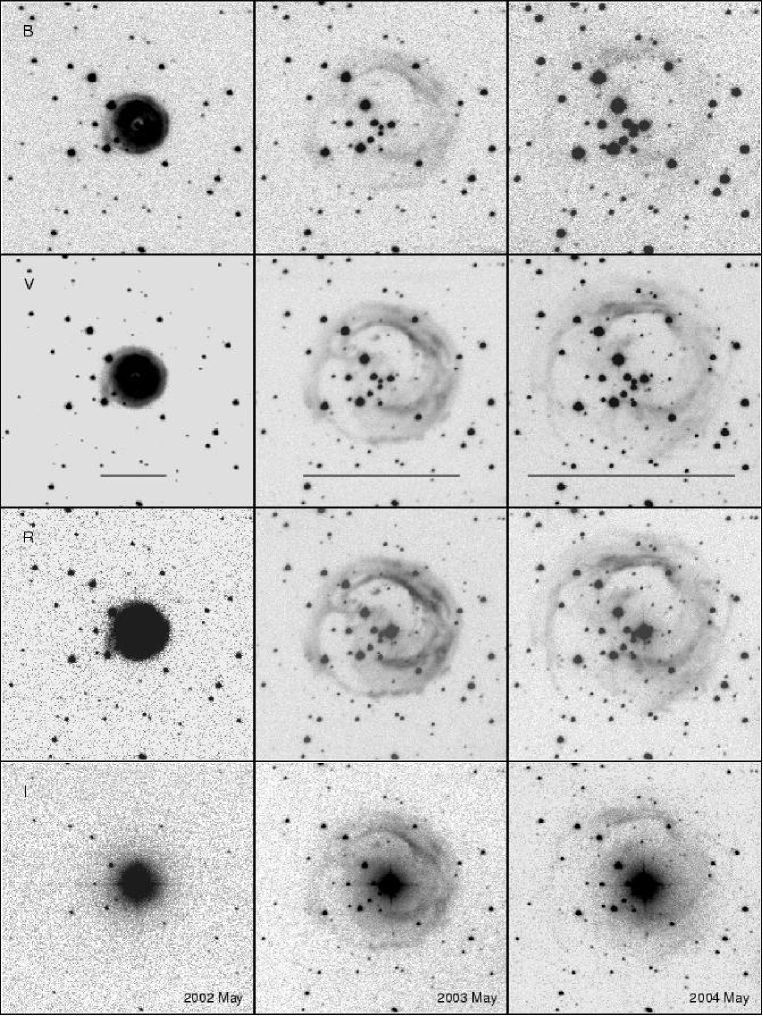
The SAAO 1.0-m telescope was used to collect BVRI images of the light echo between 2002 May and 2004 December. Median averages of 3 or more frames were produced whenever possible to eliminate cosmic ray strikes and to increase the signal-to-noise ratio. When only 1 image was available, the IRAF task imedit was used to manually remove cosmic rays and, when necessary, images were adjusted with rotate to compensate for any differences in the camera orientation from run to run. Individual images were finally cropped from 5.3 5.3 arcmin to 2.5 2.5 arcmin. Fig. 5 shows representative BVRI images chosen to illustrate the yearly expansion of the light echo. The 2002–2004 sequences for each filter were scaled for exposure times and then displayed on the same intensity scale to facilitate direct comparison. The BVRI frames obtained under the best seeing and transparency conditions for each epoch are available in FITS format and may be downloaded from ftp://ftp.saao.ac.za/pub/lisa/V838images/. Dates, exposure times and seeing details are given in Table 3 and in a ‘readme’ file on the ftp site.
The standard model for the light echo phenomenon involves a short duration light pulse that propagates outwards and scatters off surrounding dust. In the case of V838 Mon however, the star experienced an optical maximum that lasted about 70 d (see Fig. 1) and during this time the light source also changed significantly as the star rapidly expanded and cooled. Since V838 Mon was at its hottest during the 2002 February outburst, the light echo was brightest in the and bands when it was discovered (Henden et al. 2002). The brightness of the echo decreases due to geometric dilution and the colour evolution follows that of the star, while also being influenced by the scattering process that is dependent on the dust properties.
Fig. 5 shows that the echo faded more rapidly at shorter wavelengths than in the and bands and so the dominant factor in the echo colour evolution appears to be the behaviour of the light source. For particles much smaller than the wavelength of light (the Rayleigh regime), the scattering efficiency is highly wavelength dependent – proportional to . If this were the case, we might expect the light echo to have been much fainter and to have faded faster in the red. This argument suggests that the dust particles producing the echo are within the Mie scattering regime (i.e. the particle sizes are comparable to the wavelength of light), which is consistent with the properties of interstellar dust grains (Glass 1999).
| UT Date | AJD | band | band | band | band | band | band | band | band |
|---|---|---|---|---|---|---|---|---|---|
| exposure | seeing | exposure | seeing | exposure | seeing | exposure | seeing | ||
| 2002 May 01 | 396 | 1.4 | 1.2 | 1.3 | 0.8 | ||||
| 2002 Jun 02 | 428 | – | – | 2.1 | 2.2 | 2.0 | |||
| 2002 Sep 16 | 534 | 2.3 | 2.0 | 1.8 | 1.7 | ||||
| 2002 Oct 31 | 579 | 2.3 | 1.9 | 1.8 | 1.4 | ||||
| 2003 Jan 26 | 666 | 1.5 | 1.0 | 1.5 | 1.1 | ||||
| 2003 Apr 19 | 749 | 1.9 | 1.8 | 1.4 | 1.5 | ||||
| 2003 May 21 | 781 | 1.5 | 1.3 | 1.1 | 0.9 | ||||
| 2003 Sep 12 | 895 | 2.3 | 1.6 | 1.4 | 1.0 | ||||
| 2003 Nov 03 | 947 | – | – | 1.5 | 1.4 | 1.2 | |||
| 2004 Mar 24 | 1089 | 1.7 | 1.5 | 1.4 | 1.3 | ||||
| 2004 May 07 | 1133 | 2.0 | 1.4 | 1.3 | 0.9 | ||||
| 2004 Dec 11 | 1351 | 2.0 | 1.3 | 1.6 | 1.6 |
5 Estimating the distance from the light echo
The geometry of a light echo dictates that, provided material remains present to scatter the light, the echo will appear circular regardless of the physical distribution of the scattering material; see Tylenda (2004) for further discussion. Thus to measure the size of the light echo we fitted a circle to the outermost edge of the reflection nebula at each epoch and used the radius as a measure of the echo’s angular size. We measured our band images as they usually had the highest signal-to-noise ratio in the nebula. The data presented in Table 3 show that the band images had a mean seeing of arcsec, with a maximum difference of arcsec across the various epochs. These variations in seeing contribute to the overall uncertainty of the circular fit, which is dominated by the inherent difficulty in establishing the ‘edge’ of the light echo. While the nebula is sharply defined in the early images, it becomes more diffuse at later epochs and hence more difficult to measure. Accordingly, we estimate the uncertainty in the measured radii to be percent, which gives an absolute error in the radii that scales proportionally to the light echo radius as it expands with time; see the error bars in Fig. 6. Table 4 gives the measured light echo radius at each epoch, along with the day numbers that denote the interval between each observation and the time of the star’s maximum brightness (2002 February 5; AJD 311), when the light echo is believed to have been triggered.
In measuring the radii, we found that the centre of the light echo systematically shifted away from V838 Mon, towards the NE (in the upper-left direction in Fig. 5). This shift tends to make the echo seem asymmetric, but merely off-setting the circle being fitted compensates for this effect. Such a shift suggests that the scattering dust is in the form of a sheet that is inclined relative to the line-of-sight; the measured Right Ascension and Declination offsets in units of arcsec are listed in Table 4. These offset values have uncertainties of a few arcsec, but clearly follow a linear trend that allows us to derive the inclination angle of the implied sheet once an estimate of the distance to the star has been obtained (for details see Tylenda 2004).
Tylenda (2004) modeled the light echo evolution for dust distributed in thin interstellar sheets and in thin circumstellar shells. Both cases initially produce an expanding echo that cannot be distinguished by model fits to the observations. However, the models predict a divergence with time – shells of circumstellar dust will eventually result in the light echo contracting and disappearing, while expansion due to interstellar dust will decelerate but still continue as the echo gradually fades. Resolving the nature of the scattering material justifies the continued interest in imaging of the nebula. For both the dust distribution models considered here, the angular expansion of the light echo can, in principle, be used to determine the stellar distance and the distance of the scattering material from the star.
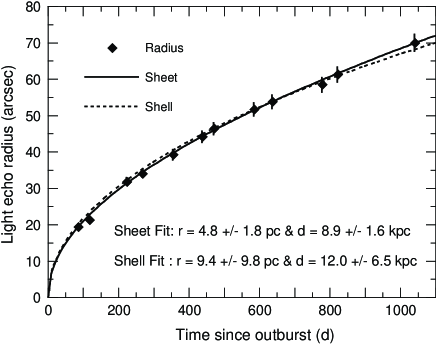
Fig. 6 shows our measured radii versus the time since the peak of the 2002 February outburst (AJD–311). To these data we fitted models for scattering by a single thin sheet ( sign) and a single thin shell ( sign) of material, making use of the equation , where is the angular radius of the echo, is the distance to the star, is the distance between the star and the dust, is the speed of light and is the time since the peak of the outburst. This form is equivalent to that given by van Loon et al. (2004), other than invoking the small angle approximation as the angles involved will always be sufficiently small that tan .
minimisation yielded and values of pc and kpc for the sheet model and pc and kpc for the shell model, respectively. The model-derived results are sensitive to uncertainties, or errors, in the measured radii222van Loon et al. (2004) measured the diameter of the light echo in images obtained with various telescopes, including the HST and the SAAO 1.0-m, and attempted to fit thin sheet and thin shell models to these data. As they were unable to find solutions for either model that fitted both the early and later epochs, they relaxed the assumption of a thin scattering medium and derived a lower limit of kpc for the distance to V838 Mon. However, comparison between the diameters given by van Loon et al. (see their table 1) and the radii listed by Tylenda (2004; see table 1 and 2) and in Table 4 of this paper reveals that the van Loon et al. diameters are in error, underestimating the actual echo diameters by a factor of . We also note that the UT dates estimated for their third and sixth epochs (SAAO images) are in error by 16 and 1 d respectively., with the shell case being additionally complicated by the need to provide a reasonable initial value for the radius so as to avoid obtaining a negative term within the square root term of the expansion equation.
Tylenda (2004) discusses the intrinsic uncertainty of the fits due to the shallow, extended nature of the minimum, but it is encouraging to note that both models produced values for the distance to V838 Mon that are consistent with lower limits proposed by various authors (e.g. Kipper et al. 2004, Wisnewski et al. 2003, Bond et al. 2003) and in agreement with values for the distance of 9.2 kpc and kpc derived recently by Lynch et al. (2004) and Tylenda (2004), respectively. Fig. 6 suggests that the expansion of the echo may be entering a regime where it has become possible to distinguish between the two dust distribution models owing to the significant divergence in the model-predicted light echo radii.
Having obtained a distance kpc from the sheet model, we estimated the inclination angle () of the dust sheet’s normal to the line-of-sight. Following Tylenda (2004), we applied a linear fit to the measured RA-offset of the echo-centre versus time (since outburst) and derived a slope of arcsec day-1. Since tan , appropriate unit conversions (arcsec day-1 into radians day-1 and then radians into degrees) yielded .
| UT Date | AJD | Time | Radius | -offset | -offset |
|---|---|---|---|---|---|
| (d) | (arcsec) | (arcsec) | (arcsec) | ||
| 2002 May 01 | 396 | 85 | 19.5 | 1 | |
| 2002 Jun 02 | 428 | 117 | 21.4 | 0 | |
| 2002 Sep 16 | 534 | 223 | 31.9 | 0 | |
| 2002 Oct 31 | 579 | 268 | 34.1 | 2 | |
| 2003 Jan 26 | 666 | 355 | 39.4 | 2 | |
| 2003 Apr 19 | 749 | 438 | 44.3 | 3 | |
| 2003 May 21 | 781 | 470 | 46.5 | 3 | |
| 2003 Sep 12 | 895 | 584 | 51.8 | 3 | |
| 2003 Nov 03 | 947 | 636 | 53.9 | 3 | |
| 2004 Mar 24 | 1089 | 778 | 58.6 | 5 | |
| 2004 May 07 | 1133 | 822 | 61.4 | 7 | |
| 2004 Dec 11 | 1351 | 1040 | 70.1 | 9 |
6 Discussion
Lynch et al. (2004) model , and m infrared spectra with a central star and a 2-component expanding circumstellar shell. They treat H2O as the dominant molecular absorber and emitter in the envelope which attenuates stellar emission in the near infrared and emits thermally in the infrared. H2O and CO transmission through the shell dominates in the m region and the photosphere makes a minimal contribution beyond m.
Their model does not include silicate dust and they point out that the 2002 February/March extinction can be explained with a combination of molecular Rayleigh scattering and molecule formation. However, as early as 2002 January, their spectra showed a slightly elevated m region and by 2003 January they report that the m flux had increased 10 times more than that in the near infrared. While the development of this infrared excess could be due to gas-phase molecules in the circumstellar envelope, a large amount of dust-precursor material was present in the form of molecular SiO and in 2003 February a fairly strong feature near m was tentatively identified as silicate emission with a central absorption feature (Sitko et al. 2003). The timing of this observation roughly coincides with the end of the broad peak noted in the infrared light curves (Fig. 1) and the time of the maximum () colour of V838 Mon (Fig. 2c). This confirms that at least some of the infrared photometric activity was caused by the production of dust, although the extent to which dust formation occurred throughout the outburst remains in question.
Light echoes have been detected in several extra-galactic supernovae (Chevalier 1986), the best studied being that of SN 1987A (Xu, Crotts & Kunkel 1995). However, prior to V838 Mon, Nova Persei 1901 (Couderc 1939) was the only Galactic variable known to have developed a light echo.
While most observed light echoes have been due to interstellar dust, it is conceivable that the scattering could take place within a circumstellar envelope. The evolutionary status of V838 Mon remains uncertain, but circumstellar dust would be expected if the star has undergone multiple outbursts in the past. The discovery of extended cool shells surrounding V838 Mon reported by van Loon et al. (2004) and detections by both 2MASS and IRAS (Kato 2002) may imply that the progenitor was an evolved object.
However, if V838 Mon is indeed kinematically associated with a B3V companion (Desidera & Munari 2002, Wagner & Starrfield 2002), the system has to be young, indicating a massive progenitor for the outbursting component. This outcome is consistent with Tylenda et al. (2004) who claim the progenitor was most likely a M⊙ dwarf, and who also reject the link between V838 Mon and the extended cool emission found by van Loon et al. (2004). Reddening of the B3V star indicates that the system is kpc distant (Munari et al. 2002) and although the star is situated towards the Galactic anti-centre, its Galactic latitude of places it within 200 pc of the plane, consistent with the observed extinction being due to interstellar material.
Also, Wisnewski et al. (2003) and Desidera et al. (2004) conclude that the polarization observed in V838 Mon is mostly of interstellar origin. A small intrinsic component was present during the 2002 February maximum, but decreased rapidly after that. Furthermore, deep polarimetric imaging of the light echo (Desidera et al. 2004) shows a dipole structure that would not be consistent with scattering from a homogeneous circumstellar medium.
While the real dust distribution that results in the light echo is likely to be complex, Fig. 6 shows that the observed light echo expansion can be reproduced by simple models that assume a thin sheet or a thin shell of scattering material. Tylenda (2004) analysed the HST images of the light echo and found that a sheet of material matched the measured radii better than a shell model could. Only a shell of implausibly large radius, hence approximating a flat sheet of material, could be made to fit the data. Our larger fit-errors for the shell (105 and 54 percent for and respectively, compared to 37 and 18 percent for the sheet) also indicate that the sheet model more successfully represents the data.
We expect the nature of the scattering material will be established by the end of the fourth observing season as the sheet and shell models will have separated significantly by that time and hence allow discrimination between the 2 possibilities. With the echo fading due to geometric dilution, high signal-to-noise images will be required to avoid under-estimating the radius as that would bias fits towards the shell model.
Future measurements of the radius will also help to refine the distance as later points will improve the model fit and hence provide better estimates of and . At a much later stage, the observed shift between the echo centre and the star could be used, in conjunction with the radius measurements, as an alternative method to determine the star’s distance (Tylenda 2004).
7 Summary
V838 Mon seemed to have settled down after the dramatic 2002 events, but the photometry presented in Tables 1 and 2 indicate that the properties of the object continued to evolve (see Fig. 1). During the second season, the star remained faint in the band but brightened by mag in and and developed a broad, flat bump in the bands that peaked around AJD 600. The infrared magnitudes then faded slowly during the third season while the and bands remained fairly constant and the band began brightening. The complex infrared evolution shown in Figs 2 and 3 and changes in the overall flux distribution shown in Fig. 4 appear consistent with a dust dispersal scenario.
Fig. 5 consists of sample BVRI light echo images spanning a 2 year interval; see Table 3 for all image details. Our current set of images may be downloaded from the SAAO ftp site; see Section 4 for details.
We measured the radius of the expanding light echo in our band images and fitted models for a thin sheet and a thin shell of scattering material. While the thin sheet model gave a somewhat better fit to the light echo radii, both models yield distances ( kpc and kpc for the sheet and shell respectively) that are consistent with estimates from other methods – see Fig. 6 and Table 4. However, the colour evolution of the light echo, the higher quality of the model fit for a sheet of dust, the observed shift in the echo centre relative to the star, results from polarimetric studies and the position of the variable only slightly above the Galactic plane all suggest that the dust illuminated by the outburst of V838 Mon is more likely to be of interstellar origin.
Establishing the nature of the dust may provide evolutionary information while the distance is essential for accurately determining the absolute luminosity of this mysterious variable. Continued imaging thus remains a priority; with time the dust distribution will be revealed and the better constrained fit will improve the distance estimate.
Acknowledgments
Our thanks to the SAAO Time Allocation Committee for generous 1.0-m time allocations, to Romuald Tylenda for helpful discussions about the light echo and to Jacco van Loon for his constructive referee’s report that resulted in significant revision and improvement of this paper. WAL acknowledges research support from UNSW@ADFA Faculty Research Grants and Special Research Grants.
References
- [] Bond H. E., Henden A., Levay Z. G., Panagia N., Sparks W. B., Starrfield S., Wagner R. M., Corradi R. L., Munari U., 2003, Nature, 422, 405
- [] Brown N. J., 2002, IAU Circ 7785, 1
- [] Carter B. S., 1995, Ap&SS, 230, 163
- [] Chevalier R. A., 1986, ApJ, 308, 225 J., Pollaco D. L., Furlan E., 1999, ApJ, 517, 143
- [] Couderc P., 1939, Ann. d’Astrophys. 2, 271
- [] Crause L. A., 2003, IAU Circ 8210
- [] Crause L. A., Lawson W. A., Kilkenny D., van Wyk F., Marang F., Jones A., 2003, MNRAS, 341, 785
- [] Desidera S., Giro E., Munari U., Efimov Y. S., Henden A., Benetti S., Tomov T., Bianchini A., Pernechele C., 2004, A&A, 414, 591
- [] Desidera S., Munari U., 2002, IAU Circ 7982
- [] Evans A., Geballe T. R., Rushton M. T., Smalley B., van Loon J. Th., Eyres S. P. S., Tyne V. H., 2003, MNRAS, 343, 1054
- [] Glass I., 1999, Handbook of Infrared Astronomy. Cambridge University Press, Cambridge, p. 108
- [] Henden A., Munari U., Schwartz M., 2002, IAU Circ 7859
- [] Kato T., 2002, IAU Circ 7786
- [] Kipper T., Klochkova V. G., Annuk K., Hirv A., Kolka I., Leedjarv L., Puss A., Skoda P., Slechta M., 2004, A&A, 416, 1107
- [] Lynch D. K. et al., 2004, ApJ, 607, 460
- [] Munari U. et al., 2002, A&A, 389, L51
- [] Munari U., Desidera S., Henden A., 2002, IAU Circ 8005
- [] Retter A., Marom A., 2003, MNRAS, 345, L25
- [] Sitko M. L., Lynch D. K., Russell R. W., Kim D., Perry R. B., 2003, IAU Circ 8078
- [] Soker N., Tylenda R., 2003, ApJ, 582, L105
- [] Tylenda R., 2004, A&A, 414, 223
- [] Tylenda R., Soker N., Szczerba R., 2004, astro-ph/0412183
- [] van Loon J. Th., Evans A., Rushton M. T., Smalley B., 2004, A&A, 427, 193
- [] Wagner R. M., Starrfield S. G., 2002, IAU Circ 7992
- [] Wisnewski J. P., Morrison N. D., Bjorkman K. S., Miroshnichenko A. S., Gault A. C., Hoffman J. L., Meade M. R., Nett J. M., 2003, ApJ, 588, 486
- [] Xu J., Crotts A. P. S., Kunkel W. E., 1995, ApJ, 451, 806