An Overdensity of Lyman- Emitters at Redshift z 5.7 near the Hubble Ultra Deep Field
Abstract
We have identified an obvious and strong large scale structure at redshift in a wide (3133) field, narrowband survey of the Chandra Deep Field South region. This structure is traced by 17 candidate Ly emitters, among which 12 are found in an 823nm filter (corresponding to Ly at ) and 5 in an 815nm image (). The Ly emitters in both redshift bins are concentrated in one quadrant of the field. The Hubble Ultra Deep Field, Chandra Deep Field South, and GOODS-South fields all lie near the edge of this overdensity region. Our results are consistent with reports of an overdensity in the UDF region at . This structure is the highest redshift overdensity found so far.
1 Introduction
The study of the large-scale clustering of high redshift galaxies is essential to understand the formation and evolution of galaxies. To date, many possible detection of large-scale clustering of high redshift galaxies have been reported (e.g., Steidel et al. 1998, 2000; Venemans et al. 2002, 2004; Miley et al. 2004; Palunas et al. 2004; Ouchi et al. 2001, 2003, 2004; Foucaud et al. 2003; and references therein).
The Ly emission line searches have been very effective at finding high redshift galaxies, especially at where most of the spectroscopically confirmed galaxies show Ly emission. These include our Large Area Lyman Alpha (LALA) survey (e.g., Rhoads et al. 2000) and other recent searches (Cowie & Hu 1998; Hu et al 1998, 2002, 2004; Kudritzki et al 2000; Fynbo, Moller, & Thomsen 2001; Pentericci et al. 2000; Stiavelli et al. 2001; Ouchi et al. 2003; Fujita et al. 2003; Shimasaku et al. 2003; Kodaira et al. 2003, Ajiki et al. 2004; Kurk et al. 2004; Tran et al. 2004, and references therein). Large-scale clustering of high redshift Ly emitters has also been reported in some of these surveys (Venemans et al. 2002, 2004; Ouchi et al. 2001, 2003, 2004).
In this letter we report the detection of a large-scale structure of Ly emitters at 5.7 in Deep Field South (CDF-S). The candidate Ly emitters at 5.7 were selected using deep narrowband images, following the selection criteria developed in the Large Area Lyman Alpha survey (Rhoads et al. 2000, 2001, 2003, 2004). Throughout this paper, we assume a cosmology with = 71 km s-1 Mpc-1, = 0.27 and = 0.73 (cf. Spergel et al. 2003).
2 Deep Narrow Band Imaging
We imaged the area around Chandra Deep Field South using two narrowband filters with central wavelength of 815 and 823 nm. The full width at half maximum (FWHM) transmissions of the two filters is 7.5 nm, with peak throughputs of . These were new filters of high quality. In particular, their throughput does not vary substantially across the field of view (unlike the similar but older filters used by Rhoads & Malhotra 2001). The deep narrowband images were obtained using the Mosaic II CCD imager at the CTIO 4m V. M. Blanco telescope, on 2003 Dec. 22–30 (UT). Chip 3 of the 8 SITe 2Kx4K CCDs was turned off during the observations due to high amplifier noise. Imaging data reduction followed the methods described in Rhoads et al. (2000, 2004). To summarize, in addition to the standard CCD data reduction steps (overscan subtraction, bias frame subtraction, and flat-fielding), we also removed electronic crosstalk between Mosaic chip pairs sharing readout electronics, and the residual, large-scale imperfections in the sky flatness using a smoothed supersky flat derived from the science data. Cosmic rays were rejected in each exposure using the algorithm of Rhoads (2000). Astrometry of USNO-A2 catalog stars was used to adjust the world coordinate systems of individual frames. Satellite trails were flagged manually for exclusion from the final stacks. Weights for image stacking were determined using the “ATTWEIGHT” algorithm (Fischer & Kochanski 1994), and the task “mscstack” in the MSCRED package (Valdes 1998) was used to stack the individual exposures.
The total integrated exposure time of the final stacked images are 34.7 ks for the 815 nm filter and 36.0 ks for the 823 nm filter. The final stacked images have seeing of 0.9″, while the seeing of 823 nm band image is slightly better (0.02″) than that of 815 nm band image. We also used deep broad band images of ESO Imaging Survey (EIS) in the CDF-S, obtained using the Wide Field Imager (WFI) of the ESO-MPG 2.2 meter telescope at La Silla. The data were download from ESO archive, and registered to the narrow band images for candidate selection. The overlap between the narrowband stacks and the EIS images was arcminutes in size with a gap of arcminutes due to the missing chip. The total solid angle searched for Ly galaxies was thus 887 square arcminutes. The corresponding volume over the full redshift range, , is . A summary of the images is given in Table 1.
3 Candidate z= 5.7 Ly Emitters
Source detections were performed using SExtractor version 2.2.2 (Bertin & Arnouts 1996) on the narrowband images, and measured their colors using SExtractor’s two-image mode to measure the EIS band photometry for the narrowband detected sources. All fluxes are measured in 2.43″ (9 pixel) diameter aperture.
Candidate Ly emitters were selected following the same criteria that have proven highly successful in the LALA fields (Rhoads & Malhotra 2001; Rhoads et al. 2003, 2004). These are: 1) Narrowband detection 5; 2) A narrowband excess of 0.75 magnitude, so that 50% of the narrowband flux comes from an emission line; 3) Significance of the narrowband excess 4; and 4) 2 detection in filters blueward of the expected Lyman break location ( band in this letter). The success rate of the criteria has been spectroscopically confirmed to be 70% (Rhoads et al. 2003, Dawson et al. 2004, Dawson et al. 2005 in prep).
In order to make full use of our narrow band images, which are deeper than the band image, we ran our selection using the weighted mean flux from and 815 nm band as the underlying continuum for 823 nm selection, and the weighted mean flux from and 823 nm band as the continuum for 815 nm selection. A total of 17 candidates are selected, 5 in the 815 nm band, and 12 in the 823 nm band. In Fig. 1 we plot the underlying continuum and narrow band fluxes for all detected sources and candidate Ly emitters selected. Our selection criteria are also plotted in the figure: the vertical line stands for 5 detection in narrow band; the solid inclined line represents a narrow excess of 0.75 magnitude and the dashed line corresponds to the requirement of 4 significance of the narrowband excess.
4 Large scale structure
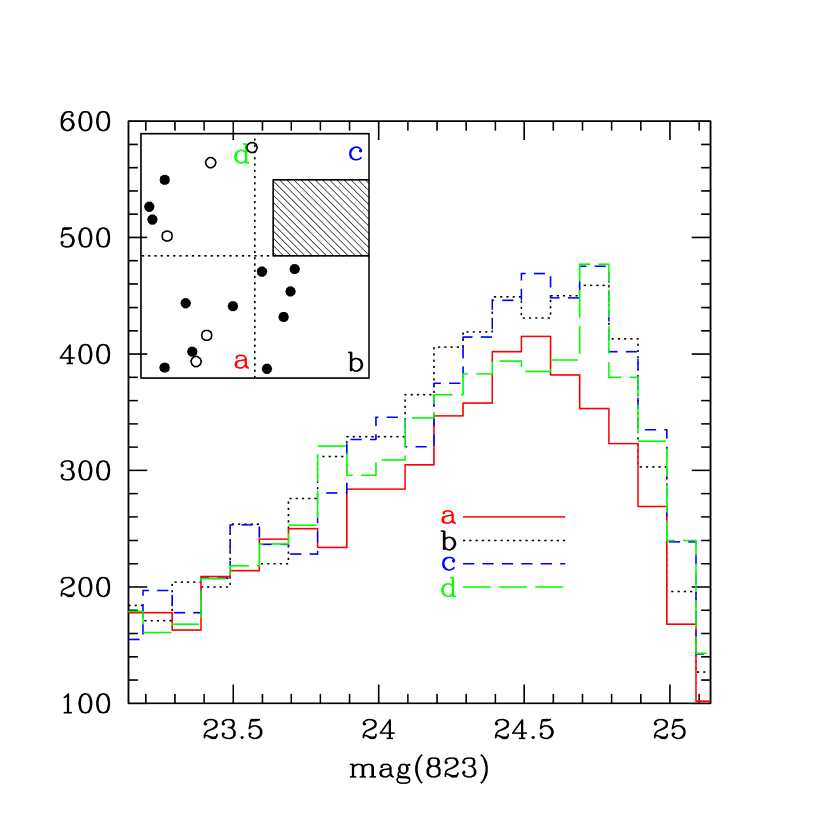
Among the 17 candidate Ly emitters we detected in CDF-S, 12 of them are selected in the 823 nm band image, 5 of them in the 815 nm band image. In Fig. 2 we plot the sky distribution of the 17 candidate Ly emitters in CDF-S. An obvious structure of the distribution can be seen in the figure: almost all the 17 sources are located in the lower left half of the field.
Before studying the clustering properties of the 17 Ly emitters, we consider whether the structure could be an observational artifact. Such a spurious “structure” in the sky distribution of the selected Ly emitters could be due to two reasons: It might be due to a difference in narrow-band sensitivity across the field. It might also due to the sky distribution of very bright sources in the field, which could affect our source detection and candidate selection.
To check these possibilities, we first divide the 823 nm band image into four quarters and plot the source counts for the four parts in Fig. 3. We can see that the source counts in four regions are consistent within the Poisson counting uncertainties. In region a where we identified the most Ly candidates, the overall source density is among the lowest. This indicates that the detection efficiency in region a is not higher than in other 3 regions. We found a similar result in the 815 nm band image.
Second, we added artificial point sources with narrowband magnitude of 24.3 (the mean value of the 12 Ly emitters in the 823 nm band image) at random locations in the narrowband image. We ran exactly the same procedures of source detection and candidate selection on the derived narrowband images. The recovered artificial sources passing our criteria show no evidence of strong clustering. Inserting artificial sources with different magnitudes (the highest and the lowest magnitudes of the 12 sources) yields the same results. Likewise, no sign of clustering is found among artificial sources inserted and recovered from the 815 nm band image. A two-dimensional Kolmogorov-Smirnoff test shows that the sky distribution of the 12 Ly emitters at 823 nm is different from the corresponding simulation at the 99.4% confidence level. Including the 5 Ly emitters from the 815 nm band would slightly increase the significance to 99.6%. The sky distribution of the 5 Ly emitters in 815 nm band alone is different from the simulated sources at the level of 98%. We checked the limiting magnitudes of the 823 nm, , and band images over the whole field, and found no inhomogeneity. The photometric zero points of the narrow and broad band images are also found to be accurate within 0.1 mag over the whole field. We point out that there is no evidence of significant spatial variations in bandpass of the narrow band filters either. All the above checks indicate the clustering of the Ly candidates is not artificial.
We see clear evidence of large scale clustering of the 12 Ly emitters in the 823 nm band. The same trend is also seen in the 815 nm band, but with lower confidence level because the number of Ly emitters in 815 nm band is only one third of that in 823 nm band. In Fig. 4 we compare the source counts from the 815 nm and 823 nm band images. We can see that the detection efficiencies are consistent with each other above the 5 detection limit, which is 24.45 mag for the 815 nm band image, and mag deeper for the 823 nm band. Note there are 2 Ly emitters in 823 nm band with narrow band magnitudes fainter than 24.45. Removing the 2 sources, the space density of Ly emitters in 823 nm band is still twice of that in 815 nm band. The corresponding limiting Ly fluxes are 2.00 & 1.66 10 for 815 nm and 823 nm bands respectively. Based the luminosity function of Ly emitters given by Malhotra & Rhoads (2004), we predict the numbers of Ly emitters in the two narrow band images to be 4.5 & 7.5. This corresponds to an overdensity factor of 1.6 for 823 nm band candidates. In the densest quadrant of the survey, the overdensity factor reaches 3-4.
5 Conclusions
The structure we have found in the Ly galaxy distribution at is the most distant large scale feature yet reported in the spatial distribution of galaxies. The space density of these galaxies varies by a factor of two between our two narrowband filters, and the projected surface densities span a substantially larger range (up to the expected mean).
The Hubble Ultra-Deep Field (HUDF; Beckwith et al 2005 in prep) lies near the edge of this large scale galaxy sheet, and the effects of this overdensity are also apparent there. An overdensity at near the HUDF was first suggested by Stanway et al (2004) on the basis of 3 redshifts in that region. This has now been confirmed in the redshift distribution of 23 -dropout Lyman break galaxies in this field (Malhotra et al 2005), as measured using slitless spectroscopy from the GRAPES project (Pirzkal et al 2004). The redshift extent of the feature within the UDF is larger than the coverage of our narrowband filters, suggesting that the structure is more complex than a single sheet.
References
- (1) Ajiki, M. et al. 2004, PASJ, 56, 597
- (2) Bertin, E., Arnouts, S. 1996, A&AS, 117, 393
- (3) Cowie, L. L., & Hu, E. M. 1998, AJ, 115, 1319
- (4) Dawson, S. et al. 2004, ApJ, 617, 707
- (5) Foucaud, S. et al. 2003, A&A, 409, 835
- (6) Fynbo, J. U., Moller, P., & Thomsen, B. 2001, A&A, 374, 443
- (7) Hu, E. M., Cowie, Lennox L., & McMahon, Richard G. 1998, ApJ, 502, L99
- (8) Hu, E. M., et al. 2002, ApJ, 568, L75
- (9) Hu, E. M., Cowie, L. L., Capak, P., McMahon, R. G., Hayashino, T., Komiyama, Y. 2004, AJ, 127, 563
- (10) Kodaira, K. et al. 2003, PASJ, 55, L17
- (11) Kudritzki, R.-P. et al. 2000, ApJ, 536, 19
- (12) Kurk, J. D., Cimatti, A., di Serego Alighieri, S., Vernet, J., Daddi, E., Ferrara, A., Ciardi, B. 2004, A&A, 422, L13
- (13) Malhotra, S. & Rhoads, J. E. 2004, ApJL, 617, 5
- (14) Malhotra, S., Rhoads, J. E., Pirzkal, N., Haiman, Z., Xu, C. et al. 2005, ApJ submitted
- (15) Miley, G. K. et al. 2004, , 427, 47
- (16) Ouchi, M. et al. 2001, ApJ, 558, 83
- (17) Ouchi, M. et al. 2003, ApJ, 582, 60
- (18) Ouchi, M. et al. 2004, ApJ, 611, 685
- (19) Palunas, P., Teplitz, H. I., Francis, P. J., Williger, G. M., Woodgate, B. E. 2004, ApJ, 602, 545
- (20) Pentericci, L. et al. 2000, A&A, 361, 25
- (21) Pirzkal, N., et al 2004, ApJS, 154, 501
- (22) Rhoads, J. E. 2000, PASP, 112, 703
- (23) Rhoads, J. E., Malhotra, S., Dey, A., Stern, D., Spinrad, H., & Jannuzi, B. T. 2000, ApJ, 545, L85
- (24) Rhoads, J. E. & Malhotra, S. 2001, ApJ, 563, L5
- (25) Rhoads, J. E. et al. 2003, AJ, 125, 1006
- (26) Rhoads, J. E. et al. 2004, ApJ, 611, 59
- (27) Shimasaku, K. et al. 2003, ApJ, 586, L111
- (28) Spergel, D. N. et al. 2003, ApJS, 148, 175
- (29) Stanway, E., et al 2004, ApJ, 604, L13
- (30) Steidel, C. C., Adelberger, K. L., Dickinson, M., Giavalisco, M., Pettini, M., Kellogg, M. 1998, ApJ, 492, 428
- (31) Steidel, C. C., Adelberger, K. L., Shapley, A. E., Pettini, M., Dickinson, M., Giavalisco, M. 2000, ApJ, 532, 170
- (32) Tran, K. H., Lilly, S. J., Crampton, D., Brodwin, M. 2004, ApJ, 612, L89
- (33) Valdes, F. 1998, ADASS VII, ASP Conf. Series 145, ed. R. Albrect
- (34) Venemans, B. P. et al. 2002, ApJ, 569, L11
- (35) Venemans, B. P. et al. 2004, A&A, 424, L17
- (36)
| Band | Telescope | Exposure Time (ks) | mAB(lim)a |
|---|---|---|---|
| ESO 2.2m | 24.5 | 27.13 | |
| ESO 2.2m | 9.2 | 25.97 | |
| ESO 2.2m | 26.9 | 24.62 | |
| 815nm | CTIO 4m | 34.7 | 25.03 |
| 823nm | CTIO 4m | 36.0 | 25.14 |