The HST view of LINERs nuclei: evidence for a dual population?††thanks: Based on observations obtained at the Space Telescope Science Institute, which is operated by the Association of Universities for Research in Astronomy, Incorporated, under NASA contract NAS 5-26555.
Abstract
We study a complete and distance-limited sample of 25 LINERs, 21 of which have been imaged with the Hubble Space Telescope. In nine objects we detect an unresolved nucleus. In order to study their physical properties, we compare the radio and optical properties of the nuclei of LINERs with those of other samples of local AGNs, namely Seyfert galaxies and low-luminosity radio galaxies (LLRG). Our results show that the LINERs population is not homogeneous, as there are two subclasses: i) the first class is similar to LLRG, as it extends the population of radio-loud nuclei to lower luminosities; ii) the second is similar to Seyferts, and extends the properties of radio-quiet nuclei towards the lowest luminosities. The objects are optimally discriminated in the plane formed by the black hole mass vs. nuclear radio-loudness: all radio-loud LINERs have , while Seyferts and radio-quiet LINERs have . The different nature of the various classes of local AGN are best understood when the fraction of the Eddington luminosity they irradiate is plotted against the nuclear radio-loudness parameter: Seyferts are associated with relatively high radiative efficiencies (and high accretion rates onto low mass black holes); LLRG are associated with low radiative efficiencies (and low accretion rates onto high black hole masses); all LINERs have low radiative efficiency (and accretion rates), and can be radio-loud or radio quiet depending on their black hole mass.
1 Introduction
LINERs are particularly important as they are the most common manifestation of nuclear activity in nearby galaxies, and they may represent the ”missing link” between AGN and ”normal” galaxies. Originally defined as a class by Heckman (1980), these galaxies have optical spectra dominated by emission lines of moderate intensities and arising from gas in lower ionization states than in classical AGN. Unambiguous LINERs have [NII]6583/H and [OIII]5007/H (unlike HII regions) or, equivalently, [OIII]/[OII] (unlike Seyferts). LINERs are detected in about 30% of statistically complete samples of nearby objects (Heckman 1980, Ho et al. 1997), but despite two decades of studies the origin of this activity is still unclear and there is no general consensus on the physical processes at work in these galaxies (see e.g. Filippenko 2003, and references therein). In particular, the physics of the central engine in these sources is still unknown, as our understanding of LINERs is significantly hampered by the general lack of detection of any nuclear continuum emission in key spectral regions such as the optical.
Recent results have revealed that the majority of LINERs (as well as Seyferts) host a compact radio core with a flat (, is defined as ) radio spectrum of high brightness temperatures, the characteristic signature for the existence of an AGN (Falcke et al., 2000; Nagar et al., 2000, 2001, 2002). If LINERs are powered by an active nucleus, the accretion process in these objects is likely to take place at an extremely low level of activity. Thus, since supermassive black holes in galaxies seem to be ubiquitous, LINERs constitute a perfect laboratory for studying accretion at its lowest rates and to investigate the connection between galaxies in which the central black hole is “active” and those in which it is “quiescent”.
The presence of non-thermal radio cores strengthens the link between LINERs and low-luminosity radio galaxies (LLRG), which also have similar optical spectra, and opens the possibility of investigating the nature of the former class following a new approach, building on the results we obtained for LLRG. In Chiaberge et al. (1999) and Capetti et al. (2002) we have studied HST images of LLRG, which show the ubiquitous presence of unresolved optical nuclei in these sources. The most striking result of this study is that the optical and radio flux, as well as the luminosity, correlate linearly over four orders of magnitude and with a very small scatter. This led us to the interpretation that the optical emission is non-thermal synchrotron radiation, in analogy with the origin of the radio core. In this scenario, the optical nuclear luminosity represents a firm upper limit to any thermal emission from an accretion disk. Adopting a typical black hole mass of (e.g. Macchetto 1999 and ref. therein) this translates in a fraction of the Eddington luminosity. The picture which emerges is that accretion in LLRG occurs at a very low accretion rate and/or with low radiative efficiency, as e.g. in the form of advection dominated accretion flows or similar scenarios (ADAF, ADIOS, CDAF; e.g. Rees et al. 1982, Narayan & Yi 1995, Narayan et al. 2000). Thus, LLRG appear as a substantially different manifestation of the accretion process onto a supermassive black hole than classical AGNs.
Some of the key observational questions that will help to constrain the physical framework for LINERs are the radio-optical properties and the determination of the radiative efficiency of the accretion process and/or the accretion rate around the central black hole. We use archival HST observations to address these issues, by comparing their properties with those of the other local unobscured AGN, i.e. Type 1 Seyferts and low luminosity radio galaxies.
In Section 2 we describe the samples of local AGNs and their black hole mass estimates; in section 3 we describe the HST images of LINERs, and we discuss our method for the photometry of the nuclei; in Section 4 we discuss our results and in Section 5 we draw conclusions.
Throughout this paper we adopt a Hubble constant of Km s-1 Mpc-1 and .
2 LINERs in the framework of the local AGN population
In order to investigate the nature of LINERs we compare their properties with those of other samples of nearby AGN, namely Seyferts and low luminosity radio galaxies, that, when added to LINERs, encompass all different manifestations of nuclear activity in the local universe. In the following sections we describe the selected samples and we also gather from the literature radio and optical nuclear fluxes as well as black hole mass estimates, which are discussed in more detail below.
| Name | Hubble Type | D | Gal. | BH mass | Ref. | ||
|---|---|---|---|---|---|---|---|
| mJy | Mpc | Km s-1 | mag | M/M⊙ | |||
| NGC 404 | -3 | 1.3 | 2.4 | 55 | 0.194 | 0 | |
| NGC 1052 | -5 | 735∗ | 17.8 | 215 | 0.088 | 0 | |
| NGC 2681 | 0 | 1.4 | 13.3 | 108 | 0.075 | 0 | |
| NGC 2787 | -1 | 11.4 | 13.0 | 206 | 0.434 | 1 | |
| NGC 2841 | 3 | 2.1 | 12.0 | 220 | 0.052 | 0 | |
| NGC 3368 | 2 | 1.0 | 8.1 | 115 | 0.083 | 0 | |
| NGC 3718 | 1 | 10.8 | 17.0 | 178 | 0.047 | 0 | |
| NGC 4143 | -2 | 10.0 | 17.0 | 243 | 0.042 | 2 | |
| NGC 4111 | -1 | 1.1 | 17.0 | 157 | 0.048 | 0 | |
| NGC 4203 | -3 | 9.0 | 9.7 | 152 | 0.040 | 2 | |
| NGC 4278 | -5 | 87.7 | 9.7 | 251 | 0.095 | 0 | |
| NGC 4293 | 0 | 1.4 | 17.0 | 163 | 0.130 | 0 | |
| NGC 4314 | 1 | 1.0 | 9.7 | 119 | 0.083 | 0 | |
| NGC 4394 | 3 | 0.9 | 16.8 | 138 | 0.100 | 0 | |
| NGC 4438 | 0 | 0.9 | 16.8 | – | 0.092 | – | – |
| NGC 4450 | 2 | 2.7 | 16.8 | 127 | 0.092 | 0 | |
| NGC 4457 | 0 | 1.0 | 17.4 | 99 | 0.072 | 0 | |
| NGC 4548 | 3 | 1.6 | 16.8 | 135 | 0.126 | 2 | |
| NGC 4550 | -1.5 | 0.7 | 16.8 | 91 | 0.129 | 0 | |
| NGC 4636 | -5 | 1.8 | 17.0 | 209 | 0.092 | 0 | |
| NGC 4651 | 5 | 1.1 | 16.8 | – | 0.089 | – | – |
| NGC 4736 | 2 | 1.7 | 4.3 | 126 | 0.059 | 0 | |
| NGC 4772 | 1 | 3.4 | 16.3 | – | 0.090 | – | – |
| NGC 4866 | -1 | 1.1 | 16.0 | 210 | 0.091 | 0 | |
| NGC 7217 | 2 | 0.6 | 16.0 | 127 | 0.292 | 0 |
Radio fluxes are from Nagar et al. (2002) except for NGC 1052 (Wrobel, 1984) (∗ VLA observations at 1.4 GHz), NGC 404, NGC 4111 NGC 4651, NGC 4866 NGC 7217 (Nagar et al., 2000); central velocity dispersions are from the LEDA database; Galactic is from NED. References for BH masses (column 8): 0 = estimated through the correlation of Tremaine et al. (2002); 1 = Ho (2002) 2 = Sarzi et al. (2002).
| Source Name | Instrument/Filter | Texp | Program ID | ||||
|---|---|---|---|---|---|---|---|
| s | erg cm-2 s-1 Å-1 | erg s-1 Hz-1 | |||||
| NGC 404 | WFPC2/F814W | 320 | 5999 | 24.96 | 0.033 | -4.398 | |
| NGC 1052 | ACS/HRC/F330W | 300 | 9454 | 25.25 | 4.152 | -6.482 | |
| NGC 2681 | WFPC2/F300W | 1000 | 8632 | 25.60 | 0.884 | -4.931 | |
| NGC 2787 | WFPC2/F814W | 730 | 6633 | 25.39 | 1.938 | -6.349 | |
| NGC 2841 | – | – | – | – | – | – | – |
| NGC 3368 | ACS/HRC/F330W | 300 | 9454 | 24.50 | 1.356 | -6.144 | |
| NGC 3718 | NICMOS/F160W | 704 | 7330 | 26.11 | 1.419 | -5.292 | |
| NGC 4111 | WFPC2/F547M | 300 | 5419 | complex morphology | – | – | – |
| NGC 4143 | WFPC2/F606W | 400 | 8597 | 25.84 | 1.672 | -5.783 | |
| NGC 4203 | WFPC2/F814W | 320 | 5999 | 25.66 | 1.313 | -5.178 | |
| NGC 4278 | WFPC2/F814W | 460 | 5454 | 24.75 | 3.232 | -7.261 | |
| NGC 4293 | WFPC2/F606W | 160 | 5446 | complex morphology | – | – | – |
| NGC 4314 | WFPC2/F814W | 600 | 6265 | 24.46 | 1.574 | -6.245 | |
| NGC 4394 | WFPC2/F814W | 320 | 9042 | 25.65 | 0.816 | -5.312 | |
| NGC 4438 | WFPC2/F675W | 1450 | 6791 | complex morphology | – | – | – |
| NGC 4450 | WFPC2/F814W | 460 | 5375 | 25.83 | 1.11 | -4.985 | |
| NGC 4457 | – | – | – | – | – | – | – |
| NGC 4548 | – | – | – | – | – | – | – |
| NGC 4550 | WFPC2/F814W | 1200 | 5375 | 25.25 | 1.118 | -4.988 | |
| NGC 4636 | WFPC2/F814W | 200 | 8686 | 23.84 | 2.934 | -7.844 | |
| NGC 4651 | WFPC2/F814W | 600 | 5375 | 25.30 | 1.256 | – | |
| NGC 4736 | ACS/HRC/F330W | 300 | 9454 | 24.58 | 1.000 | -6.228 | |
| NGC 4772 | WFPC2/F606W | 160 | 5446 | 25.35 | 1.965 | – | |
| NGC 4866 | – | – | – | – | – | – | – |
| NGC 7217 | ACS/WFC/F814W | 120 | 9788 | 24.91 | 1.384 | -5.909 |
Fluxes have been corrected for extinction using Galactic listed in Table 1. Objects that are plotted as double upper limits in the figures are marked with the symbol .
2.1 The selected samples of local AGN
2.1.1 LINERs
Our LINERs sample contains 25 objects drawn from the Palomar survey of nearby galaxies (Table1). Their catalog contains 486 bright () galaxies in the northern sky. Here we consider a complete, distance limited ( Mpc) subsample of 25 LINERs. Transition sources and galaxies with uncertain classification are excluded from our sample. Radio core data are taken from VLA observations at 2cm (Nagar et al., 2000, 2002). For the prototypical LINER NGC 1052 we have used observations at 1.4 GHz from Wrobel (1984). We have assumed to convert the flux of NGC 1052 to 2cm, in agreement with the typical spectral index of compact radio cores observed by Nagar et al. (2001). is also assumed in the following sections to convert the fluxes to 5GHz in order to derive the nuclear radio loudness parameter: a change in the spectral index of would imply a flux change of less than a factor 2, leaving our results unaffected. We have excluded from our list two objects that are part of the Palomar catalog, namely M 87 and M 84. Although these galaxies are classified as LINERs by Ho et al. (1997a), they are well known radio galaxies with extended radio jets, and thus they are included in our LLRG sample. Optical observations of the central regions of 21/25 galaxies have been carried out with HST and the data are available in the public archive. Nuclear HST photometry is described in the next Section.
2.1.2 Seyferts
Following Ho & Peng (2001), we consider a sample of Seyfert 1 which includes objects from the Palomar survey (Ho et al., 1997a), that are faint and nearby (), together with relatively brighter (and slightly more distant) objects from the CfA survey Huchra et al. (1983); Osterbrock & Martel (1993). As noted by Ho & Peng (2001), the combined sample itself cannot be considered as complete, but it provides a broader range of nuclear luminosities, thus suitable to represent the Seyfert phenomenon as a whole. We have excluded from the Ho & Peng (2001) sample those classified as Seyfert 1.8 and 1.9, since the estimate of the nuclear flux in these objects may be affected by significant extinction at optical wavelengths. Clearly, for the same reason we do not consider Type 2 Seyferts111We have also removed NGC 1275 from the original list, although this object is often referred to as a Seyfert, since it is a well known radio galaxy (3C 84, Perseus A) with a peculiar emission line spectrum. However, this object is part of our LLRG sample..
HST/WFPC2 observations are available for the majority (25/32) of the objects. The data analysis and nuclear photometry has been performed by Ho & Peng (2001) by modeling the galaxy brightness profile with multiple components using GALFIT. The radio data are also taken from the list in Ho & Peng (2001).
| Name | BH mass | Ref. | ||||
|---|---|---|---|---|---|---|
| erg s-1 Hz-1 | erg s-1 Hz-1 | M/M⊙ | ||||
| IZw 1 | 29.28 | 29.36 | – | – | 0.028 | – |
| MRK 205 | 29.12 | 29.23 | – | – | -0.070 | – |
| MRK 231 | 30.94 | 29.61 | – | – | 1.338 | – |
| MRK 279 | 29.02 | – | 1 | – | – | |
| MRK 334 | 28.92 | – | – | – | – | – |
| MRK 335 | 28.54 | 28.67 | 1 | -0.090 | -1.613 | |
| MRK 471 | 28.31 | 27.58 | – | – | 0.751 | – |
| MRK 530 | 29.21 | 27.9 | 0 | 1.359 | -3.659 | |
| MRK 590 | 28.84 | 27.98 | 1 | 0.903 | -2.751 | |
| MRK 744 | 27.9 | – | 0 | – | – | |
| MRK 766 | 28.6 | 28.03 | – | – | 0.581 | – |
| MRK 817 | 28.98 | 28.54 | – | – | 0.447 | – |
| MRK 841 | 28.29 | 28.61 | – | – | -0.296 | – |
| MRK 993 | 27.91 | 26.38 | – | – | 1.634 | – |
| MRK 1243 | 27.93 | – | – | – | – | – |
| NGC 3031 | 27.12 | 25.55 | 1 | 1.714 | -5.732 | |
| NGC 3227 | 28.17 | 27.26 | 1 | 0.948 | -3.812 | |
| NGC 3516 | 28.31 | 27.74 | 1 | 0.642 | -3.103 | |
| NGC 4051 | 27.5 | 26.84 | 1 | 0.684 | -2.754 | |
| NGC 4151 | 28.79 | 28.53 | 1 | 0.316 | -2.139 | |
| NGC 4235 | 27.89 | 26.81 | – | – | 1.112 | – |
| NGC 4395 | 24.97 | 24.33 | – | – | 0.677 | – |
| NGC 4639 | 26.26 | 25.25 | 0 | 1.062 | -4.829 | |
| NGC 5033 | 27.96 | 26.67 | 0 | 1.316 | -4.257 | |
| NGC 5273 | 26.95 | 26.26 | 0 | 0.702 | -3.415 | |
| NGC 5548 | 28.8 | 28.32 | 1 | 0.501 | -3.248 | |
| NGC 5940 | 28.17 | 28.11 | 0 | 0.138 | -3.102 | |
| NGC 6104 | 27.68 | 27.32 | 0 | 0.383 | -3.759 | |
| NGC 7469 | 29.39 | 28.49 | 1 | 0.976 | -1.804 | |
| UGC 524 | 28.51 | – | – | – | – | – |
| UGC 8621 | 27.75 | – | – | – | – | – |
| UGC 12138 | 28.57 | – | – | – | – | – |
2.1.3 Low Luminosity radio galaxies
To represent radio loud local AGN, we consider the complete sample of 33 radio galaxies with Fanaroff-Riley I morphology (FR I, Fanaroff & Riley 1974), which is characteristic of the large majority of low luminosity radio galaxies (LLRG), taken from the 3CR catalog (Spinrad et al., 1985). The sample is the same as in Chiaberge et al. (1999). The data we use in the following are summarized in Table 4. The objects span a range of redshift , with a median value of which, for the cosmological parameters we are using, corresponds to 120 Mpc. From the point of view of their optical spectral properties, FR I have low intensity emission lines and most of them have LINER-like spectra. Another two samples of LLRG (drawn from the B2 and UGC catalogs) with slightly lower average redshift have been studied with the HST (Capetti et al., 2002; Verdoes Kleijn et al., 2002). However, the 3C sample best describes the properties of the class of radio galaxies because it covers a larger range in radio luminosity and it has the highest detection rate of optical nuclei, an essential ingredient for our analysis. Furthermore, the radio-optical properties of the B2 and UGC sample are in complete agreement with those derived for the 3C.
The histograms of Fig. 1 show the distances to the objects belonging to the three selected samples. Note that the three samples have been selected on the basis of different properties, i.e. radio emission for the FR I, optical magnitude of the host and relative intensity of the emission lines for both the LINERs and Seyferts 1. Therefore, the resulting sample cannot be considered as complete. However, the sources we consider are representative of the properties of AGN in the local universe.
| Name | redshift | BH mass | Ref. | ||
|---|---|---|---|---|---|
| 3C 28 | 0.19520 | – | - | 2.583 | – |
| 3C 29 | 0.04479 | 8.121 | 0 | 3.992 | -5.071 |
| 3C 31 | 0.01690 | 8.581 | 0 | 3.575 | -5.948 |
| 3C 66B | 0.02150 | – | - | 3.355 | – |
| 3C 75 | 0.02315 | 8.809 | 0 | – | – |
| 3C 76.1 | 0.03240 | – | - | – | – |
| 3C 78 | 0.02900 | 8.660 | 0 | 3.395 | -4.365 |
| 3C 83.1 | 0.02510 | – | - | 3.963 | – |
| 3C 84 | 0.01700 | 8.134 | 0 | 4.238 | -3.495 |
| 3C 89 | 0.13860 | 8.785 | 0 | 5.176 | -6.272 |
| 3C 264 | 0.02060 | 8.568 | 0 | 2.980 | -4.832 |
| 3C 270 | 0.00737 | 8.716 | 1 | 4.516 | -7.214 |
| 3C 272.1 | 0.00370 | 9.079 | 1 | 3.207 | -7.097 |
| 3C 274 | 0.00370 | 9.531 | 1 | 3.734 | -6.729 |
| 3C 277.3 | 0.08570 | – | - | 3.698 | – |
| 3C 288 | 0.24600 | – | - | 4.419 | – |
| 3C 293 | 0.04520 | 7.994 | 0 | – | – |
| 3C 296 | 0.02370 | 8.742 | 0 | 4.142 | -6.464 |
| 3C 305 | 0.04100 | 7.927 | 0 | – | – |
| 3C 310 | 0.05400 | 8.041 | 0 | 4.146 | -5.053 |
| 3C 314.1 | 0.11970 | – | - | 2.810 | – |
| 3C 315 | 0.10830 | – | - | – | – |
| 3C 317 | 0.03424 | 8.498 | 0 | 4.333 | -5.392 |
| 3C 338 | 0.03030 | 8.849 | 0 | 3.809 | -5.893 |
| 3C 346 | 0.16200 | – | - | 3.768 | – |
| 3C 348 | 0.15400 | – | - | 3.884 | – |
| 3C 386∗ | 0.0170 | – | - | – | – |
| 3C 424 | 0.12700 | – | - | 3.867 | – |
| 3C 433 | 0.10200 | – | - | – | – |
| 3C 438 | 0.29000 | – | - | 4.416 | – |
| 3C 442 | 0.02620 | – | - | 3.129 | – |
| 3C 449 | 0.01810 | 8.547 | 0 | 3.100 | -5.776 |
| 3C 465 | 0.03010 | 9.082 | 0 | 3.940 | -5.853 |
Redshifts (column 2) are from NED. Reference for black hole masses (column 3): 1=from Ho (2002), 0 = estimated through the correlation of Tremaine et al. (2002). 3C 28 has upper limits for both the optical and the radio core, thus we have marked it with the symbol . See Chiaberge et al. (1999) for radio cores and optical luminosities from HST images. ∗In 3C 386 a star is superimposed to the nucleus, thus no optical core flux can be measured (Chiaberge, et al., 2002a).
2.2 Black hole mass estimates
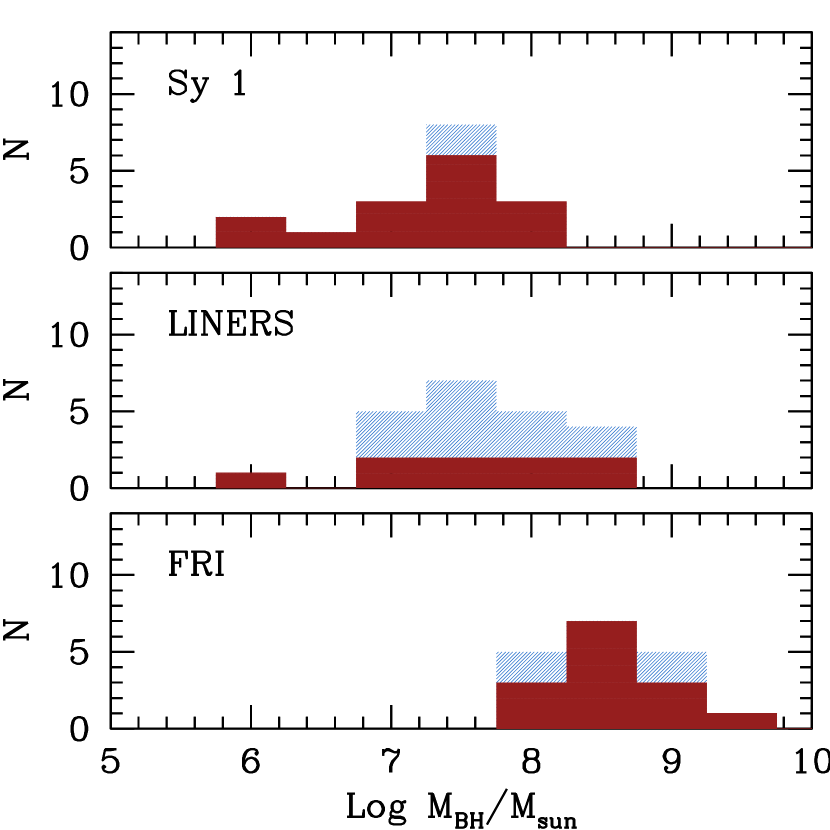
In Fig. 2 we show the distribution of black hole masses for the three samples. When more direct measurements are not available, the black hole masses are estimated through the correlation with the central velocity dispersion determined by Tremaine et al. (2002). The velocity dispersions have been obtained from the HyperLEDA database222e.g. http://leda.univ-lyon1.fr/. Of our samples of local AGN, twentytwo LINERs, seventeen Seyferts 1 and eighteen FR I have black hole mass estimates (see Tables 1 and 3).
LINERs appear to lie at intermediate values, between Seyferts (low black hole mass, M M☉) and radio galaxies (high black hole mass, M M☉) and all populations show a substantial overlap.
In the histograms of Fig.2 we have plotted as filled areas the sources for which the optical core is detected, to show that the presence of an optical nuclear component is not related to the black hole mass.
3 HST observations and LINERs nuclear fluxes
In this Section we derive measurements of the optical nuclear flux for our sample of LINERs. Twenty one out of twenty five of the selected LINERs galaxies have been imaged with the HST as part of several different programs and therefore they have been observed with different instruments, filters and exposure times. The summary of the observations for LINERs is in Table2, while we refer to the original papers for Seyferts and radio galaxies.
We perform optical photometry of LINERs nuclei using the same method as for the FR I sample, based on the analysis of the radial brightness profile and described in detail in Chiaberge et al. (1999) (hereafter CCC99). We also checked for consistency against the results obtained using GALFIT (Peng et al., 2002). The fluxes derived with the two methods are consistent to within 1 and 2 .
Of the 21 LINERs imaged with the HST, we detect the nucleus in 9 objects, namely NGC 404, NGC 1052, NGC 2681, NGC 3368, NGC 3718, NGC 4143, NGC 4203, NGC 4378 and NGC 4736. For NGC 4111, NGC 4293, and NGC 4438 the estimate of the nuclear optical emission is hampered by the presence of lasrge scale dusty structures along the line of sight to the nucleus.
A few details on the nuclear measurements are worth mentioning. For NGC 3368 the nucleus is not detected in the V band, but it is clearly seen in the UV. We argue that this is due to the higher contrast between the nucleus and the host galaxy stellar emission at UV wavelengths compared with the V band. The upper limit in the optical band ( erg s-1 cm-2 Å-1) is however in substantial agreement with the observed UV nuclear flux (within less than 1). Conversely, NGC 3718 has no detected nucleus in the optical, while this is seen in the IR 1.6 m NICMOS image. Here the absence of the optical nucleus is most likely due to the presence of an extended nuclear dust lane, clearly seen in the optical images.
Since the majority of the objects have been observed with the F702W filter, we have converted the measured flux densities to 7000Å, assuming an optical spectral index (). Note that if we leave the spectral index free to vary in the range this translates into a typical uncertainty on the 7000Å flux of . Only for the worst cases of NGC 1052 and NGC 4736, which have been observed with the F330W filter, the uncertainty would be still less than a factor of 2. Thus, this does not produce any significant effect in our analysis.
4 The radio–optical properties of LINERs
As demonstrated by our analysis of radio galaxies samples, the comparison between radio and optical properties of AGNs represents a powerful tool to explore the nature of their nuclei. Here we follow the same approach to investigate the properties of LINERs nuclei, setting a comparison with the other classes of local AGN.
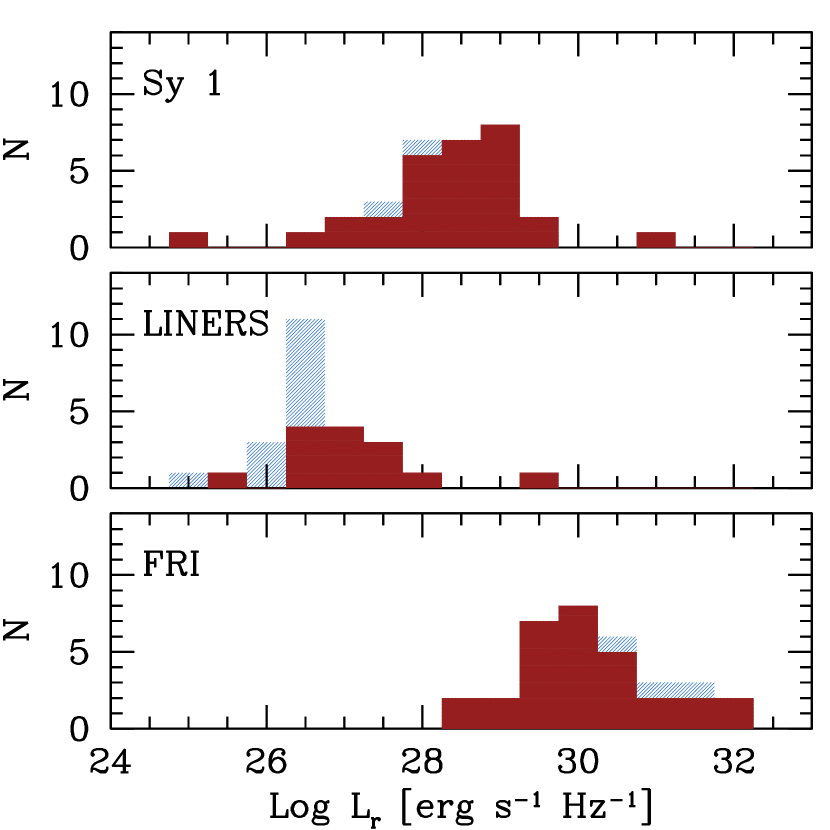
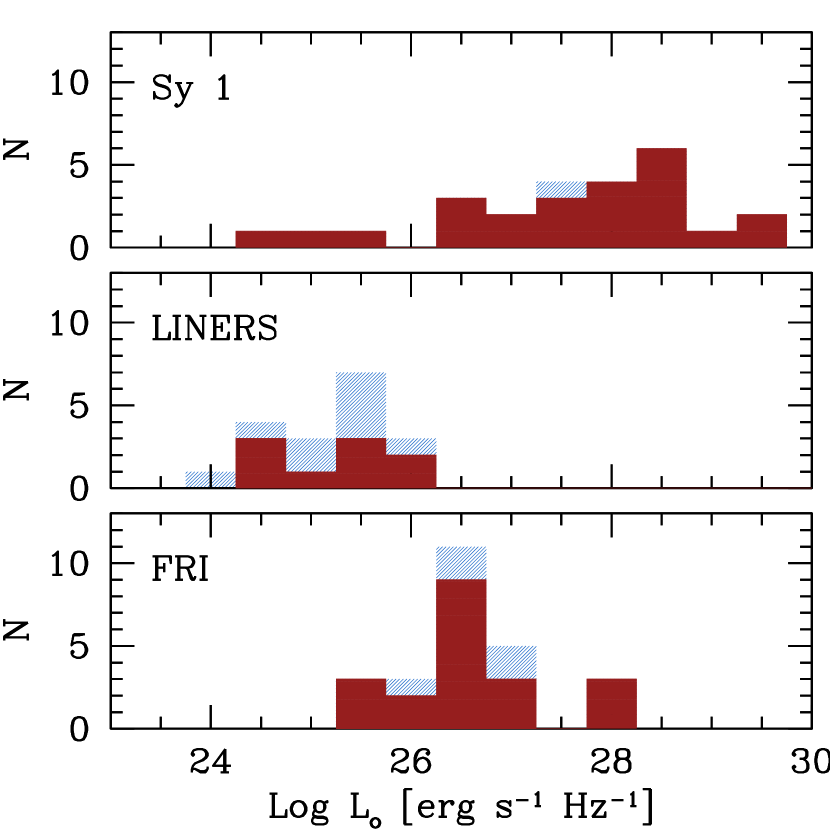
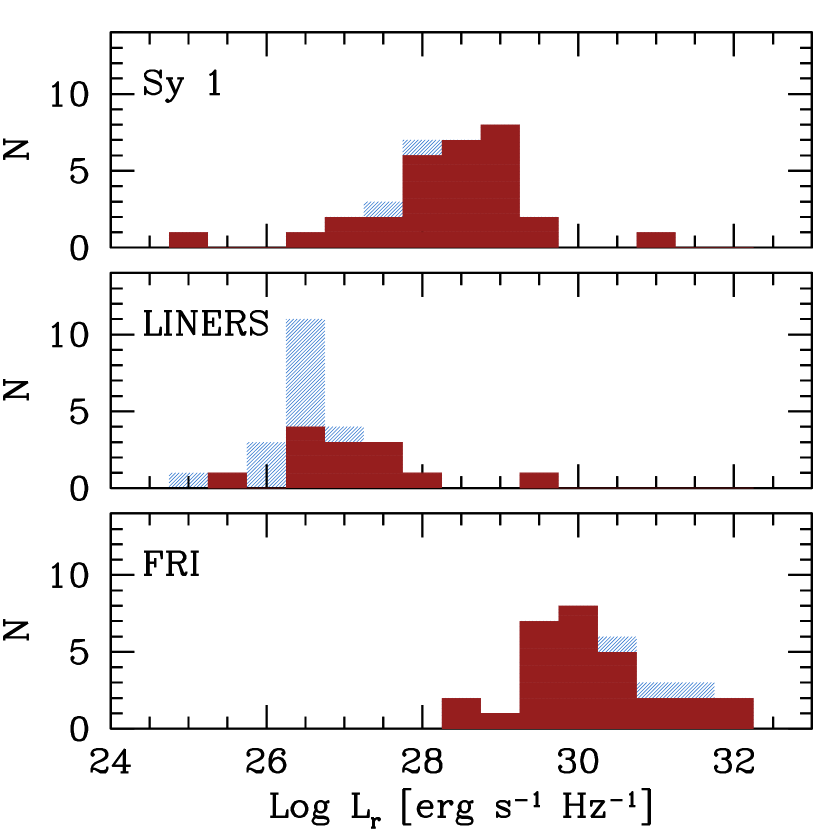
In Fig. 3 we show the histograms of the radio and optical core luminosity (left and right panel, respectively) for the LINER, Seyfert and FR I samples. LINERs’ nuclei are substantially fainter than Seyferts and FR Is, both in optical and radio luminosity. More specifically, the median value of the luminosity distribution for LINERs’ radio cores is a factor of and fainter than Seyferts and FR I, respectively. In the optical, these differences are slightly smaller and there is more overlap between the different classes: LINERs are on average a factor of fainter than Seyferts, and only a factor fainter than FR I.
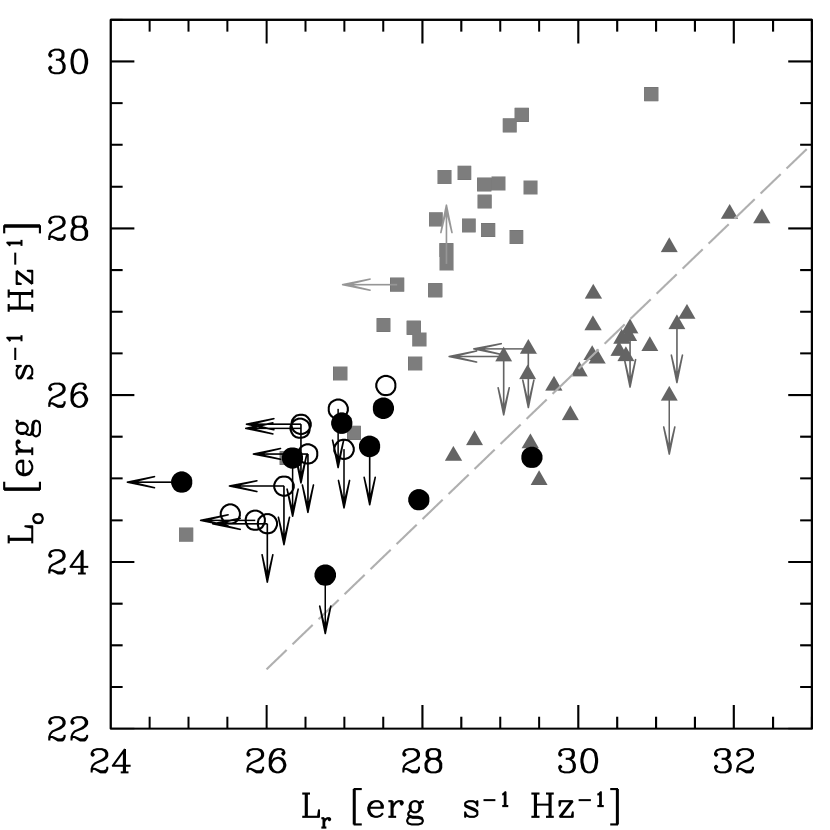
In Fig. 4 we plot the optical nuclear luminosity against the radio core luminosity for the three samples. As shown in CCC99, the nature of optical and radio cores of FR I nuclei is explained in terms of synchrotron emission from the base of the relativistic jet, and this results in a tight linear correlation between these two quantities. The Seyfert 1 nuclei lie in a different region of the plane: for a similar radio luminosity, they show a significant optical excess ( dex). While a non-thermal synchrotron origin for compact radio emission in Seyferts has been clearly established (Ulvestad et al., 1987; Mundell et al., 2000; Nagar et al., 2000), the optical excess is most likely thermal. In fact, this behavior is qualitatively similar to that observed in broad line radio galaxies, in which the optical excess is interpreted as a result of thermal emission from a radiatively efficient accretion disk (Chiaberge, et al., 2002a; Chiaberge et al., 2002b).
The nature of the LINERs’ radio cores is considerably more uncertain, compared with e.g. those of radio-galaxies. However, several authors (Falcke et al., 2000; Nagar et al., 2000, 2001) have recently shown that, similarly to Seyferts, most of the LINERs’ radio emission is in the form of a compact, flat spectrum radio core, the characteristic signature of an AGN. As pointed out in Sect. 3 nine galaxies in our sample also show a central optical component. The location of these objects in the radio-optical plane is less homogeneous than both LLRG and Seyferts. While two of them (NGC 1052 and NGC 4278) lie on the correlation of FR I galaxies, the remaining seven objects with detected optical cores show significant optical excess, similar to Seyferts. Those objects for which only upper limits are available are located along a general extension of the Seyfert locus towards lower luminosities, except for NGC 4636 which lies a factor of 3 above the correlation, at its very low end and for which a strong optical excess can be excluded. In Fig. 4 we have also marked LINERs with different host galaxy type with different symbols. Filled circles are representative of ellipticals, while empty circles represent late type galaxies (Hubble type or , respectively). Among the detected nuclei, it appears that the two objects that lie on the FR I correlation have elliptical hosts, while either host galaxy type are present in objects with optical excess.
The location of LINERs nuclei in the radio-optical plane might be affected by obscuration in the optical band. This is particularly worrisome for the objects that lie on the FR I correlation, since they might move towards the Seyfert’s locus. However, of those three LINERs nuclei, NGC 4636 is undetected in the X-rays (Jones et al., 2002) as it is in the optical, NGC 4278 has cm-2 (Terashima & Wilson, 2003), while only NGC 1052 shows significant absorption ( cm-2, partial covering model, Terashima et al. 2002). However, its nucleus is clearly detected at 3300Å. We have also checked that there is no strong infrared excess in the HST/NICMOS image at , implying that extiction does not play a significant role in the IR-to-optical band. The resulting spectral index is , in agreement with the typical values of FR I radio galaxies (Chiaberge et al., 2002b). As for the FR I and other classes of X-ray obscured AGN, a low optical extinction coupled with a relatively high X-ray column density might be explained by e.g. unusual dust/gas ratios (Granato et al., 1997) or by the properties of the dust grains (Maiolino et al., 2001).
4.1 The nuclear radio-loudness parameter
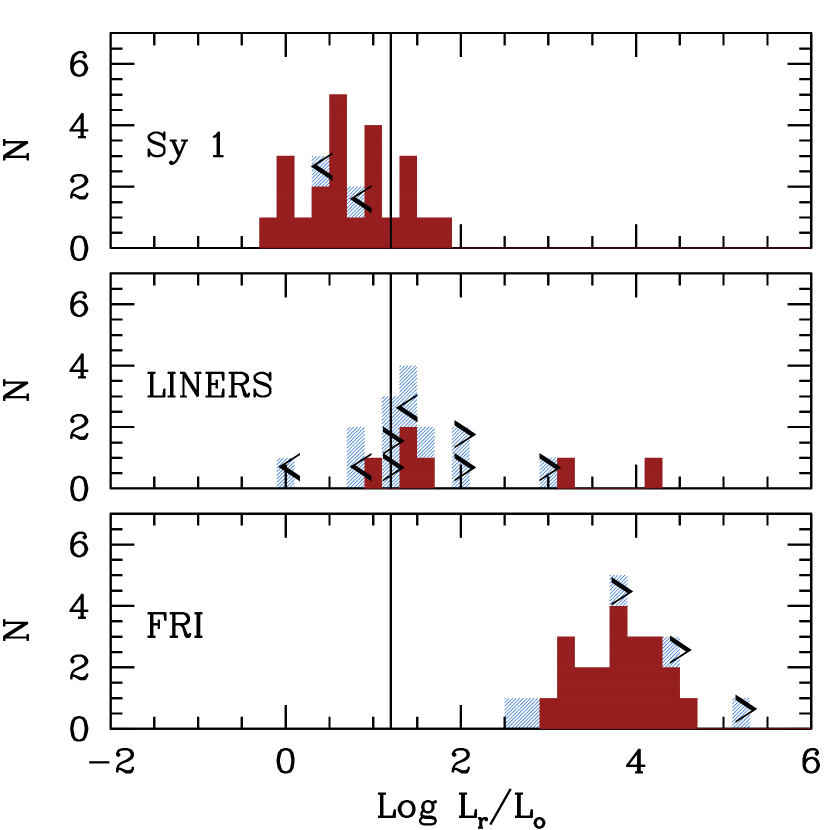
A slightly different path can be followed by studying the connection between radio and optical properties considering a nuclear “radio-loudness” parameter, defined as , i.e. the ratio between radio and optical nuclear fluxes. Although the presence of a clear dichotomy in the radio-loudness distribution of powerful AGN is still a matter of debate (e.g. White et al. 2000, Cirasuolo et al. 2003), Seyfert 1 and LINERs are historically considered as radio-quiet with respect to their global properties. Intriguingly, Ho & Peng (2001) have shown that when the nuclear emission of Seyfert (type 1 through 1.9) is disentangled from the host galaxy stellar component, the majority of their nuclei have , i.e. they fall into the standard definition of radio-loud objects (Kellermann et al., 1989). But how does this compare with the nuclei of standard radio-loud objects? In Fig. 5 we show the histograms of the radio-loudness parameter for Seyferts, LINERs and FR I 333Note that with our definition of as , our results are slightly different from those obtained by Ho & Peng (2001). However, since most of the observations have been performed with optical R-band filers (mainly F702W), we prefer to use a reference wavelength as close as possible to the original observation, because of the uncertainty on the spectral indices of the nuclei. Therefore, for the sake of coherence, in our case the usual definition of radio-loud object would translate into (assuming an optical spectral index ). None of our conclusions are affected by this choice of a slightly different spectral band.. The radio-optical correlation found for FR I is linear and it translates into a “radio-loudness” distribution clustered around . The usual value of adopted in the literature as the separation between radio-quiet and radio-loud object does not correspond to any significant distiction between Seyferts and radio galaxies nuclei. Although some Seyfert 1s are indeed above this threshold the median value for Seyferts is more than a factor of lower than that measured in FR I, and thus they appear to be fundamentally different from LLRG.
The LINERs span a large range in . Some of them are similar to Seyferts, while at least three of the objects of the sample have in the region spanned by bona fide radio loud objects. Thus, when the radio–loudness parameter is considered, LINERs nuclei appear to link the other two populations of local AGN.
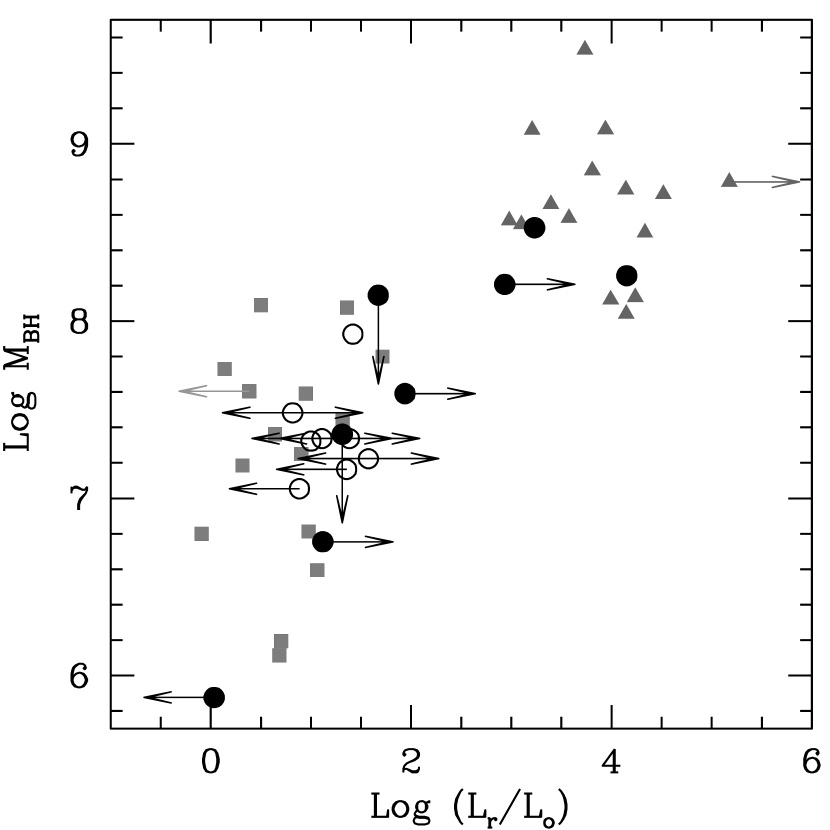
The analysis of the different behavior of radio-loudness benefits from considering also the black hole mass. In Fig.6 we plot the black hole mass versus the nuclear radio loudness. We stress that, since the three samples have been selected according to completely different criteria and observational properties, it is dangerous to carry out any statistical test on the total sample of local AGN. Thus, no correlation can be derived between these two quantities. Nonetheless, “radio-loud” nuclei appear in galaxies with more massive black holes and separate themselves from the radio-quiet, low black hole mass objects. Taken at face value, from this plot it appears that the nuclei of local AGN are “radio-loud” only if the mass of the black hole is . This is similar to the results obtained by Dunlop et al. (2003) on the distribution of black hole masses in QSO. Their analysis, which is based on the QSO host galaxy luminosity, shows that radio-loud objects are confined to the higher end of the black hole mass distribution for their sample. On the other hand, Woo & Urry (2002) have recently found that the black hole mass does not drive the radio-loudness of powerful high-redshift quasars: in their large sample radio quiet quasars with high black hole masses do exist. However, the picture may change substantially in the nearby universe, as shown by our results.
The separation among LINERs with detected optical nuclei based on “radio-loudness” parameter alone is confirmed and strengthened by our analysis: the three LINERs with large value of are also associated to the largest black holes. Note however that the position of several LINER’s nuclei is partially undetermined in this plane, since eight of them are not detected either in the radio or in the optical, and for three of them neither the optical nor the radio core is detected. However, at least ten LINERs are well constrained in this plane, and for all of these sources, their “radio-loudness” is clearly related to their black hole mass.
This analysis suggests that there may be two distinct populations of LINERs. A first group (namely NGC 1052, NGC 4278 and NGC 4636) extends the behavior of FR I radiogalaxies to even lower powers. Note that they all show extended radio emission: NGC 1052 is associated to a compact (2.8 kpc in size) double-lobed radio-source Wrobel (1984); NGC 4278 also shows extended radio emission Wrobel & Heeschen (1991), but on much smaller scales ( pc); NGC 4636 shows an extended ( 2kpc) jet-like structure (Stanger & Warwick, 1986). Their total radio luminosities at 1.4 GHz are in the range erg s-1. As a reference, the radio luminosity of LLRG from the 3C spans the range to erg s-1. In the following, we will refer to this sub-class of LINERs as to “radio-loud” LINERs.
The second group of LINERs (which possibly represents the majority of the objects of the complete sample) behave like Seyfert 1 at the lower end of their luminosity function. We will thus refer to them as to “radio-quiet” LINERs. However, the number statistics are not sufficient to test whether there is a continuous transition between the two subclasses, or the population is bi-modal.
Note that the radio-quiet LINERs are associated with a mixed population of host galaxy morphologies, while the three radio-loud LINERs are hosted by early type galaxies. Interestingly, this is also the case for LLRG, which are exclusively hosted by E or S0 galaxies.
The separation between the two classes of LINERs does not appear to be related to their optical spectral features, since faint, relatively broad (FWHM km s-1) emission lines (H) have been detected in the optical spectra of several objects belonging to either flavor of LINERS (Barth et al., 1999; Ho et al., 1997b).
4.2 On the properties of the accretion process
From the estimates of the central black hole masses, we can infer the fraction of the Eddington luminosity at which the nucleus is irradiating. This quantity can then be related to the properties of the accretion process in the different classes. This estimate is uncertain for two main reasons: i) when using the correlation with the central velocity dispersion, the black hole mass estimates are uncertain by a factor of ; ii) even more importantly, the optical luminosity represents only a fraction of the bolometric luminosity of the nucleus. The bolometric correction derived for quasars (Elvis et al., 1994) () is probably sufficiently accurate in the case of Seyfert galaxies, as they show a spectral energy distribution quite similar to those of their higher luminosity counterparts (Alonso-Herrero et al., 2003). Instead, as already pointed out above, the nuclear emission of FR I is best interpreted as non-thermal synchrotron radiation from the base of the jet (CCC99). Therefore, in that case, represents an upper limit to the radiation produced by the accretion process. For LINERs the picture is even more uncertain, since the nature of the spectral shape of the nuclear emission is poorly determined. Bearing in mind these considerations, we do not attempt to perform any bolometric correction to the data and we preferred to simply compare optical nuclear luminosities as fraction of the Eddington luminosity. Note that, as it will be clear in the following, our conclusions are not affected by an uncertainty dex on the bolometric correction.
In Fig.7 we plot against . Compared with the diagram of Fig. 4, the sources are more clearly separated, because of the different average black hole mass of different classes of objects. Seyfert nuclei irradiate at a larger fraction of with respect to both LINERs and FR I. For a standard bolometric correction factor of 15, the average value for Seyfert’s is in the range expected from a standard optically thick accretion disk. Only two of them, namely NGC 4639 and NGC 3031 (aka M 81), would have . Intriguingly, not only these two sources lie in the region of LINERs in the plane of Fig. 7, but they are also close to the separation between Seyferts and LINERs in the diagnostic line ratios diagrams (Ho et al., 1997a). NGC 3031 was indeed considered as a LINER in the original classification of Heckman (1980).
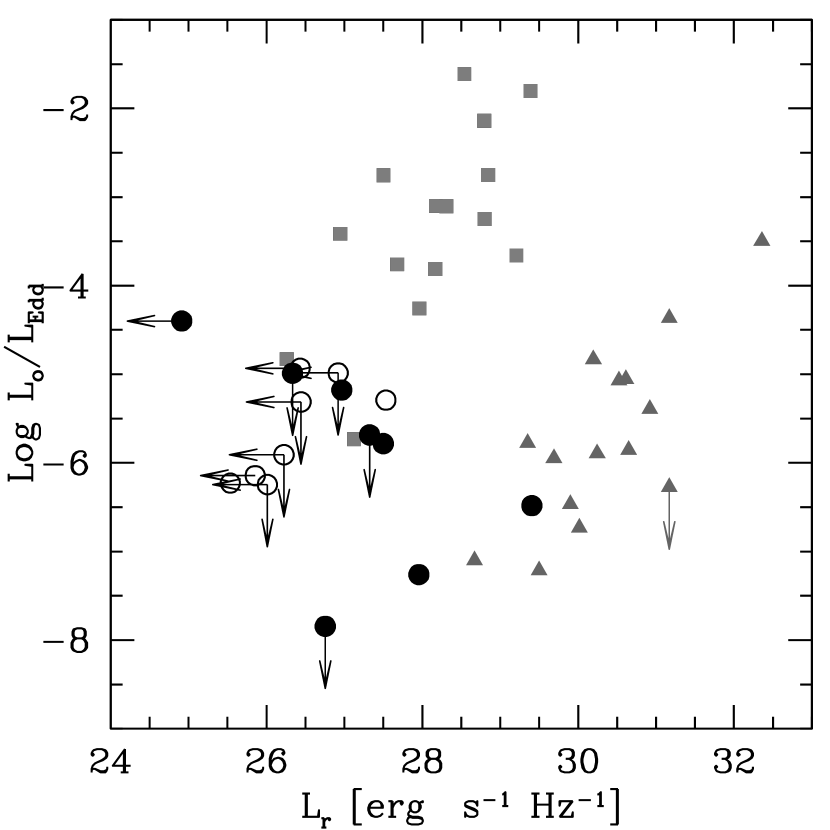
On the other hand, for both LINERs and FR I nuclei a standard accretion disk does not account for the low fraction of the Eddington luminosity observed in the optical. Thus, as already discussed for FR I in CCC99, our analysis of the optical nuclei shows that low radiative efficiency accretion processes are predominant around LINERs’ central black holes. This is also in agreement with other independent evidence, such as the low X-ray luminosity of their nuclei (e.g. Terashima et al. 2002).
More importantly, the correlation between the radio and optical core of FR I provides a minimum to the optical flux, represented by the optical counterpart of the non-thermal radio core. Therefore, it is tempting to interpret the “optical excess” observed in the “radio-quiet” subclass of LINERs as optical radiation from the accretion flow, in analogy with the optical excess shown by Seyferts. Thus, in these objects we are probably directly observing optical emission from a radiatively inefficient (ADAF-like) process.
4.3 Radio-loudness, black hole mass and properties of accretion
As discussed above, LINERs seem to appear in two flavors: “radio-quiet” and “radio-loud”. The two classes are similar to Seyferts and FR I radio galaxies, respectively, but scaled towards lower luminosities. For both classes of LINERs the accretion process is likely to be in the form of a low radiative efficient disk and/or with a low accretion rate. In this section we investigate how the properties of the accretion flow relate to the radio-loudness parameter, for the three samples of local AGN.
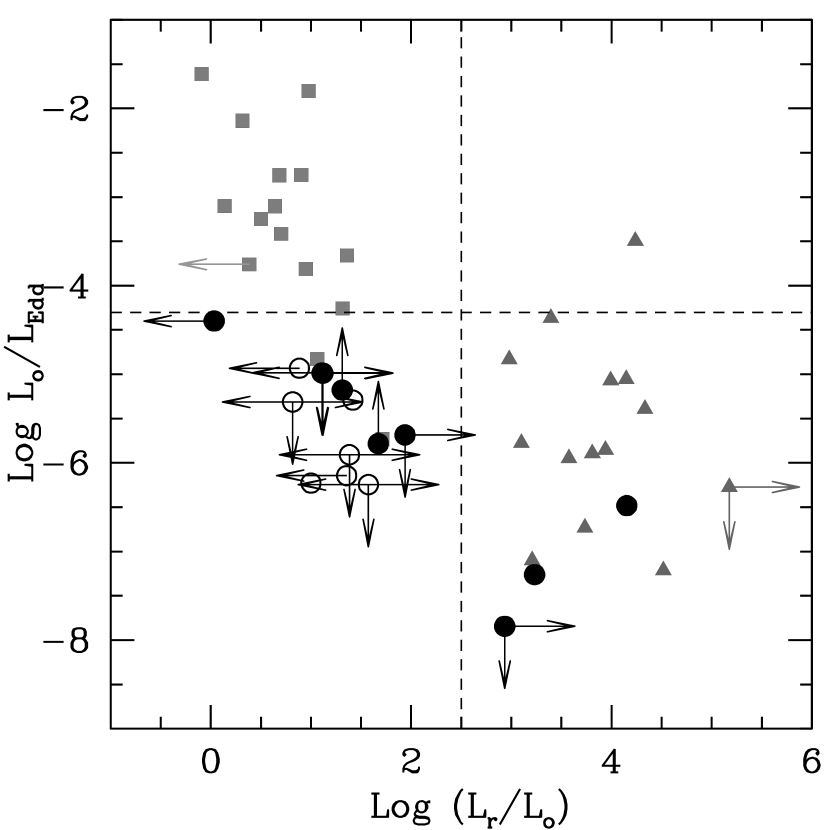
In Fig. 8 we plot vs. . The sources occupy different regions of the plane, according to their physical properties. We have divided the plane into four quadrants, which are not necessarily indicative of any physical state transition, but only guide the eye to identify the different classes. Nevertheless, the vertical line, corresponding to may be interpreted as our new definition for the “threshold” between radio-quiet and radio-loud nuclei. Seyferts are in the top–left part of the diagram, which means relatively high radiative efficiency of the accretion process (and/or high accretion rate), and a low value for the radio-loudness parameter.
At least seven LINERs (namely NGC 404, NGC 2681, NGC 3368, NGC 3718, NGC 4143 and NGC 4203, NGC 4736) lie on the radio-quiet side, and have a low (). The properties of these nuclei are independent of the host galaxy morphological type, since both ellipticals and spirals are present in this quadrant. However, we must point out that the majority of “radio-quiet” LINERs have late type hosts. Our result show that “radio-quiet” LINERs represent Seyferts’ low-efficiency counterparts. As shown in Fig.6, these two classes also share the same range of black hole masses. In the large majority of the models proposed to describe the accretion processes, a low radiative efficiency is associated with a low accretion rate onto the central black hole. Thus the most plausible scenario is that the difference between Seyferts and LINERs of the radio-quiet type resides in the accretion rate: for a given mass of the central black hole, a higher accretion rate generates a Seyfert nucleus, while for a low, highly sub-Eddington regime a LINER is observed. Furthermore it is tempting to speculate that the properties of the accretion regime may be reflected in the different ionization states observed in the two classes (low-ionization for LINERs and high ionization for Seyferts). It is worth noticing that a small subsample of LINERs might be powered by non-AGN processes such as nuclear star formation (e.g. Maoz et al. 1998). In particular, this might be the case for the nuclei that are not detected in the radio band and for which an optical core is seen (NGC 404 and NGC 3368). In these objects, the optical point should then be interpreted as an upper limit to the AGN luminosity (i.e. the luminosity of the accretion process). The location of their representative points would then be undetermined in the axis (they could be either radio-loud or radio-quiet) and their would be even lower. Therefore, the scenario is not affected by the presence of a few non-AGN LINERs.
The lower-right region of the plane is occupied by radio-loud nuclei, which are either LINERs or FR I radio galaxies. At least three of the LINERs lie in this quadrant: NGC 1052, NGC 4278 and NGC 4636 (which is constrained to this region by the non detection of its optical nucleus). By analogy with the FR I, we identify the optical emission of these nuclei as the optical counterparts of the radio cores which, as shown by various authors (Falcke et al., 2000; Nagar et al., 2001), are most plausibly produced by non-thermal synchrotron radiation. As for the FR I, the optical emission thus represents an upper limit to the disk component.
Note that although in Fig. 8 there are many upper or lower limits, almost all of them are in fact meaningful. Even for the three LINER nuclei that are not detected in either the radio and optical bands, which results in a triple-direction limit, this implies an upper limit for the radiative efficiency of the accretion process. Therefore, although we cannot establish their position on the radio-loudness axis, their location on the axis is constrained to be significantly lower than the Seyferts, as observed for all other LINERs of our sample.
5 Conclusions
We have explored the nature of LINERs analyzing archival HST observations and collecting radio data from the literature. Of the 25 LINERs of our distance limited sample, nine show an unresolved nucleus in the range of wavelengths covered by the HST observations. Four of them are detected in the optical, four in the near-UV and one is detected only in the near-IR. We have compared their radio-optical properties with those of the other unhidden AGN in the local universe, i.e. FR I radio galaxies and Seyferts 1.
The radio-optical correlation found for FR I, which is best explained as the result of a single emission process in the two bands (i.e. non-thermal synchrotron emission from the base of the relativistic jet), provides us with a powerful tool to investigate the origin of the nuclei.
We have shown that in the radio-optical plane of the nuclei there is a clear separation between Seyferts and radio galaxies. For similar radio core luminosity, Seyfert 1 are significantly brighter in the optical than FR I. Therefore, although most Seyferts have , radio-quiet and radio-loud AGN appear to be still well differentiated. This implies that the nuclear physical properties of the two classes are significantly different.
LINERs appear to be divided into two subclasses, a Seyfert-like (radio-quiet) group and a radio galaxy-like (radio-loud) group. Although the number statistics are not sufficient to establish whether there are two separate populations or there is a continuous transition between the two, radio-quiet and radio-loud LINERs appear to represent the extension of Seyfert and radio-galaxies towards lower luminosities, respectively. This is also mirrored by their host galaxy type. Note that, in this framework, the “radio-loudness” parameter acquires a physical meaning, and indicates what are the dominant radiation mechanisms in the two bands.
The black hole masses of LINERs span the range . Although we cannot derive any correlation with the radio-loudness of the nucleus, it is apparent that radio galaxies host the more massive black holes, while Seyferts’ black holes are significantly less massive. Intriguingly, this separation holds also between the two classes of LINERS: “radio-loud” LINERs have central black hole masses confined to , while those of “radio quiet” LINERs lie below such value.
We have derived the radiative efficiency of the accretion process around the central black holes in our samples of local AGN. All of them emit only a small fraction of the Eddington luminosity. Although the determination of the bolometric luminosity is uncertain because of the lack of detailed spectral information, the accretion process in LINERs appears to take place on a highly sub-Eddington regime (, and can be as low as ). Such low values are clearly not compatible with the expectations from a standard optically thick and geometrically thin (quasar-like) accretion disk. Thus, low accretion rates and/or low efficiency processes appears to be required in all LINERs. Our results are qualitatively in agreement with Ho (2004), who made use of the emission line as an indicator of the AGN power for a large sample of Seyferts and LINERs.
The different nature of the various classes of local AGN are best understood when the fraction of the Eddington luminosity they irradiate is plotted against the nuclear radio-loudness parameter. In this diagram, our objects populate three different quadrants, according to their physical properties. We identify Seyferts and radio-quiet LINERs as the high and low accretion rate counterparts, respectively. For low accretion regimes, the nuclei appears to be “radio-loud” only when a more massive black hole () is present. We speculate that the fourth quadrant, which appears to be “empty” in the local universe, would contain radio-loud nuclei with high , readily identified with radio loud quasars.
The scenario we propose needs further investigation, since optical detections of the nuclei are available for a minority of the LINER’s sample. Thus, deep imaging with high spatial resolution (achievable only with the Hubble Space Telescope) are crucial. In particular, when suitable observations of a large number of LINERs will be available, it will be possible to address whether the dichotomy persists or some of the low-black hole mass objects with optical upper limits mix with the population of “radio-loud” LINERs. Clearly this would falsify our scenario for the role of the black hole mass in determining the radio-loudness of the nuclei. Deep imaging of a larger complete sample would also address the issue of whether there is continuous transition between the two classes. This is indeed a subject of great interest in the study of high luminosity quasars and for a more complete understanding of the overall subject should be also extended to lower end of the AGN luminosity function.
References
- Alonso-Herrero et al. (2003) Alonso-Herrero, A., Quillen, A. C., Rieke, G. H., Ivanov, V. D., & Efstathiou, A. 2003, AJ, 126, 81
- Barth et al. (1999) Barth, A. J., Filippenko, A. V., & Moran, E. C. 1999, ApJ, 515, L61
- Capetti et al. (2002) Capetti, A., Celotti, A., Chiaberge, M., de Ruiter, H. R., Fanti, R., Morganti, R., & Parma, P. 2002, A&A, 383, 104
- Chiaberge, et al. (2002a) Chiaberge, M., Capetti, A., & Celotti, A. 2002, A&A, 394, 791
- Chiaberge et al. (2002b) Chiaberge, M., Macchetto, F. D., Sparks, W. B., Capetti, A., Allen, M. G., & Martel, A. R. 2002, ApJ, 571, 247
- Chiaberge et al. (1999) Chiaberge, M., Capetti, A., & Celotti, A. 1999, A&A, 349, 77
- Cirasuolo et al. (2003) Cirasuolo, M., Celotti, A., Magliocchetti, M., & Danese, L. 2003, MNRAS, 346, 447
- Dunlop et al. (2003) Dunlop, J. S., McLure, R. J., Kukula, M. J., Baum, S. A., O’Dea, C. P., & Hughes, D. H. 2003, MNRAS, 340, 1095
- Elvis et al. (1994) Elvis, M. et al. 1994, ApJS, 95, 1
- Fanaroff & Riley (1974) Fanaroff, B. L. & Riley, J. M. 1974, MNRAS, 167, 31P
- Falcke et al. (2000) Falcke, H., Nagar, N. M., Wilson, A. S., & Ulvestad, J. S. 2000, ApJ, 542, 197
- Filippenko (2003) Filippenko, A. V. 2003, ASP Conf. Ser. 290: Active Galactic Nuclei: From Central Engine to Host Galaxy, 369
- Granato et al. (1997) Granato, G. L., Danese, L., & Franceschini, A. 1997, ApJ, 486, 147
- Heckman (1980) Heckman, T. M. 1980, A&A, 87, 152
- Ho et al. (1997a) Ho, L. C., Filippenko, A. V., & Sargent, W. L. W. 1997a, ApJS, 112, 315
- Ho et al. (1997b) Ho, L. C., Filippenko, A. V., Sargent, W. L. W., & Peng, C. Y. 1997b, ApJS, 112, 391
- Ho & Peng (2001) Ho, L. C. & Peng, C. Y. 2001, ApJ, 555, 650
- Ho (2002) Ho, L. C. 2002, ApJ, 564, 120
- Ho (2004) Ho, L. C. 2004, Carnegie Observatories Astrophysics Series, Vol. 1: Coevolution of Black Holes and Galaxies, ed. L. C. Ho (Cambridge: Cambridge Univ. Press), 2004
- Huchra et al. (1983) Huchra, J., Davis, M., Latham, D., & Tonry, J. 1983, ApJS, 52, 89
- Jones et al. (2002) Jones, C., Forman, W., Vikhlinin, A., et al. 2002, ApJ, 567, L115
- Kellermann et al. (1989) Kellermann, K. I., Sramek, R., Schmidt, M., Shaffer, D. B., & Green, R. 1989, AJ, 98, 1195
- Macchetto (1999) Macchetto, F. D. 1999, Ap&SS, 269, 269
- Maiolino et al. (2001) Maiolino, R., Marconi, A., & Oliva, E. 2001, A&A, 365, 37
- Maoz et al. (1998) Maoz, D., Koratkar, A., Shields, J. C., Ho, L. C., Filippenko, A. V., & Sternberg, A. 1998, AJ, 116, 55
- Mundell et al. (2000) Mundell, C. G., Wilson, A. S., Ulvestad, J. S., & Roy, A. L. 2000, ApJ, 529, 816
- Nagar et al. (2002) Nagar, N. M., Falcke, H., Wilson, A. S., & Ulvestad, J. S. 2002, A&A, 392, 53
- Nagar et al. (2001) Nagar, N. M., Wilson, A. S., & Falcke, H. 2001, ApJ, 559, L87
- Nagar et al. (2000) Nagar, N. M., Falcke, H., Wilson, A. S., & Ho, L. C. 2000, ApJ, 542, 186
- Narayan & Yi (1995) Narayan, R. & Yi, I. 1995, ApJ, 444, 231
- Narayan et al. (2000) Narayan, R., Igumenshchev, I. V., & Abramowicz, M. A. 2000, ApJ, 539, 798
- Osterbrock & Martel (1993) Osterbrock, D. E. & Martel, A. 1993, ApJ, 414, 552
- Peng et al. (2002) Peng, C. Y., Ho, L. C., Impey, C. D., & Rix, H. 2002, AJ, 124, 266
- Rees et al. (1982) Rees, M. J., Phinney, E. S., Begelman, M. C., & Blandford, R. D. 1982, Nature, 295, 17
- Sarzi et al. (2002) Sarzi, M., et al. 2002, ApJ, 567, 237
- Stanger & Warwick (1986) Stanger, V. J. & Warwick, R. S. 1986, MNRAS, 220, 363
- Spinrad et al. (1985) Spinrad, H., Marr, J., Aguilar, L., & Djorgovski, S. 1985, PASP, 97, 932
- Terashima & Wilson (2003) Terashima, Y. & Wilson, A. S. 2003, ApJ, 583, 145
- Terashima et al. (2002) Terashima, Y., Iyomoto, N., Ho, L. C., & Ptak, A. F. 2002, ApJS, 139, 1
- Tremaine et al. (2002) Tremaine, S., et al. 2002, ApJ, 574, 740
- Ulvestad et al. (1987) Ulvestad, J. S., Neff, S. G., & Wilson, A. S. 1987, AJ, 93, 22
- Verdoes Kleijn et al. (2002) Verdoes Kleijn, G. A., Baum, S. A., de Zeeuw, P. T., & O’Dea, C. P. 2002, AJ, 123, 1334.
- White et al. (2000) White, R. L., et al. 2000, ApJS, 126, 133
- Woo & Urry (2002) Woo, J. & Urry, C. M. 2002, ApJ, 581, L5
- Wrobel & Heeschen (1991) Wrobel, J. M. & Heeschen, D. S. 1991, AJ, 101, 148
- Wrobel (1984) Wrobel, J. M. 1984, ApJ, 284, 531