Imprints of mass accretion on properties of galaxy clusters
Abstract
A large scale SPH+N-body simulation (GADGET) of the concordance CDM universe is used to investigate orientation and angular momentum of galaxy clusters at in connection with their recent accretion histories. The basic cluster sample comprises the 3000 most massive friends-of-friends halos found in the simulation box. Two disjoint sub-samples are constructed, using the mass ratio of the two most massive progenitors at (), namely a recent major merger sample and a steady accretion mode sample. The mass of clusters in the merger sample is on average larger than the mass of the two progenitors (), whereas in the steady accretion mode sample a smaller increase of is found. The separation vector connecting the two most massive progenitor halos at is strongly correlated with the orientation of the cluster at . The angular momentum of the clusters in the recent major merger sample tends to be parallel to orbital angular momentum of the two progenitors, whereas the angular momentum of the steady accretion mode sample is mainly determined by the angular momentum of the most massive progenitor. The long range correlations for the major and the minor principal axes of cluster pairs extend to distances of . Weak angular momentum correlations are found for distances . Within these ranges the major axes tend to be aligned with the connecting line of the cluster pairs whereas minor axes and angular momenta tend to be perpendicular to this line. A separate analysis of the two sub-samples reveals that the long range correlations are independent of the mass accretion mode. Thus orientation and angular momentum of galaxy clusters is mainly determined by the accretion along the filaments independently of the particular accretion mode.
keywords:
methods: numerical – methods: statistical – galaxies: clusters: general – large-scale structure of the Universe1 Introduction
Using a sample of 44 Abell clusters Binggeli (1982) showed that clusters of galaxies are highly eccentric. McMillan et al. (1989) measured the X-ray contours of 49 Abell clusters and found that most clusters are clearly flattened. By means of N-body simulations Warren et al. (1992) (see also Dubinski & Carlberg 1991; Cole & Lacey 1996) demonstrated that dark matter halos have triaxial shapes and tend to be prolate. Furthermore they showed that the prevailing shape is supported by the anisotropic velocity dispersion (see also Tormen (1997)). Thus the shape of the halo mirrors its dynamical state and is likely to be a long-term feature if no major disruptions take place. Subsequently the orientation of clusters will be identified with the major axis of its mass distribution.
The angular momentum of galaxy clusters is easily accessible in numerical simulations. The orientation of the angular momentum may record information about the mass accretion history and/or tidal interactions with the surrounding large scale structure. According to Doroshkevich (1973), Peebles (1980), and White (1984) the primary angular momentum of bound objects is due to tidal interaction between the elongated proto-structures after decoupling from cosmic expansion and before turn-around. More recent studies find that the angular momentum of dark matter halos is later modified by the merging history of their building blocks, see Vitvitska et al. (2002) and Porciani et al. (2002a, b).
The alignment of galaxy cluster orientations is controversial since Binggeli (1982) published his inaugural study. He reported that galaxy clusters are oriented relative to neighbours at least for separations smaller than . Moreover, he found anisotropies in the cluster distribution on scales up to . The first investigations, using X-ray contours, led to no (Ulmer et al., 1989) or only weak (Rhee & Latour, 1991) significance of alignment effects. However, Chambers et al. (2002) exploring X-ray position angles of 45 clusters found significant alignment of clusters’ orientations with the connecting line to the next neighbour for separations of . Analysing a large set of optical data of 637 Abell clusters Plionis (1994) found highly significant alignment effects on scales below that become weaker but extend up to .
In the literature two slightly different scenarios are proposed to explain the alignment of the orientation of clusters. Binney & Silk (1979) suggested that tidal interactions of evolving proto-cluster systems may lead to the growth of anisotropies of clusters and to relative orientation effects. However, West (1994) found that clusters grow by accretion and merging of surrounding matter that falls into the deep cluster potential wells along sheet-like and filamentary high density regions. Using numerical CDM simulations van Haarlem et al. (1997) demonstrate that clusters are elongated along the incoming direction of the last major merger. Further West & Blakeslee (2000) show that Virgo’s brightest elliptical galaxies have a remarkably collinear arrangement in three dimensions, which is aligned with the filamentary structure connecting Virgo and the rich cluster Abell 1367. In a statistical investigation of 303 Abell clusters Plionis et al. (2003) confirm the alignments of galaxy members with their parent cluster orientation as well as with the large-scale environment within which the clusters are embedded. Therefore, the cluster formation is tightly connected with the super-cluster network that characterises the large-scale matter distribution in the universe. High-resolution simulations showing this effect were described by the Virgo collaboration, Colberg et al. (2000). Onuora & Thomas (2000) found a significant alignment signal up to scales of for a CDM model. Faltenbacher et al. (2002) and Hopkins et al. (2005) using large scale dissipationless N-body simulations of the CDM universe report alignment of the orientations of galaxy clusters for separations . Improved statistics due to a much larger simulation volume enable Kasun & Evrard (2004) to find correlations ranging up to . Basilakos et al. (2005) using the same simulation than we do, but an eight times increased mass resolution, found alignment between cluster sized halos and their hosting super-clusters.
This work aims to link the vector quantities of galaxy clusters (orientation and angular momentum) with their recent mass accretion history. The basic cluster sample comprises the 3000 most massive CDM halos found by a friends-of-friends (FoF) approach. Further the basic sample is divided into two sub-samples, namely a recent major merger sample and a steady accretion mode sample. The subdivision criterion is based on the mass fraction of the two most massive progenitors at . The masses and positions of these progenitors hold information about the pattern of infall onto the cluster. We find a strong correlations between the infall pattern and the cluster vector quantities. Finally, since the infall happens along the large scale filaments we analyse long range correlations of these vector quantities between cluster pairs by means of mark correlation functions (see Faltenbacher et al. 2002; Kasun & Evrard 2004).
The paper is organised as follows. §2 describes the simulation and explains the construction of cluster sample and sub-samples. In §3 the impact of different mass accretion modes (merger/steady accretion) on shape and angular momentum of the clusters is investigated . In §4 the range of the alignment of the major, the minor, and the angular momentum axes of cluster pairs is measured. §5 summaries the results.
2 Simulation and cluster sample
In subsection §2.1 some information about the simulation is provided and §2.2 describes the construction of the basic cluster sample. In the last paragraph (§2.3) the subdivision of the basic cluster sample into a merger and a steady accretion mode sample is explained.
2.1 Simulation
The simulation is performed using the public available GADGET code (see Springel et al. 2001). According to the presently favoured cosmological model, we assume a flat universe with the parameters , and a Hubble constant of . The linear power spectrum of the density fluctuations has been normalised to . The simulation is realized within a cube of edge length. The cold dark matter and the gaseous component are represented by particles each. The mean baryonic mass fraction of the universe is assumed to be , consequently the mass of a single CDM particle is and the mass of a single gas particle is . The gas is simulated using smoothed particle hydrodynamics (SPH) with no baryonic cooling or heating processes taken into account.
2.2 Basic cluster sample
For the identification of cluster halos we apply a standard friends-of-friends (FoF) algorithm (e.g., Davis et al. 1985). The CDM and the gaseous particle distributions are treated separately. The basic cluster is based on the 3000 most massive CDM halos found with a linking length of , where is the mean particle distance (see e.g. Jenkins et al. 2001). The most massive cluster in the basic sample comprises 4201 particles which corresponds to a CDM mass of . The smallest object in the sample has a CDM mass of containing 209 particles. Subsequently the gaseous halos, identified by an analogous FoF approach () applied to the gas particle distribution, are associated with their CDM clusters. We apply a linking length of also for redshifts .
2.3 Mass accretion modes
Suwa et al. (2003) (see also Richstone et al. 1992) show that the formation rate of galaxy clusters in the CDM universe peaks at . In the following we want to subdivide the basic cluster sample according to the accretion history into a recent major merger sample and a steady accretion mode sample. Therefore we locate for every cluster the two most massive progenitors at , just a short time interval before the accretion rate is maximal. These two halos at are identified as being the most massive progenitors, which contain the highest numbers of particles also found in the current () cluster.
The basic cluster sample is subdivided based on the mass fraction of the two most massive CDM progenitors , where and denote the most and the second most massive progenitor, respectively. The 3000 clusters are separated into three disjoint sub-samples, each of them comprising 1000 clusters. The recent major merger sample contains the clusters with the highest values () for the progenitor mass fractions, meaning that the two progenitors have comparable masses. The steady accretion mode sample contains the 1000 clusters with the lowest values () for the progenitor mass fractions, meaning that the most massive progenitor is by far more massive than the second most massive progenitor. Consequently all additionally accreted mass must approach within even smaller lumps. The 1000 clusters with intermediate progenitor mass ratios are omitted from any further investigation, which focuses on the impact of the particular accretion mode.
The upper panel of Fig. (1) shows the distribution of mass fractions () versus with the steady accretion mode clusters appearing on the left and the recent major merger clusters appearing on the right. denotes the mass of the emerged cluster at . The intermediate accretion mode clusters, which are not investigated in the following, are located in the middle of this panel (grey area).
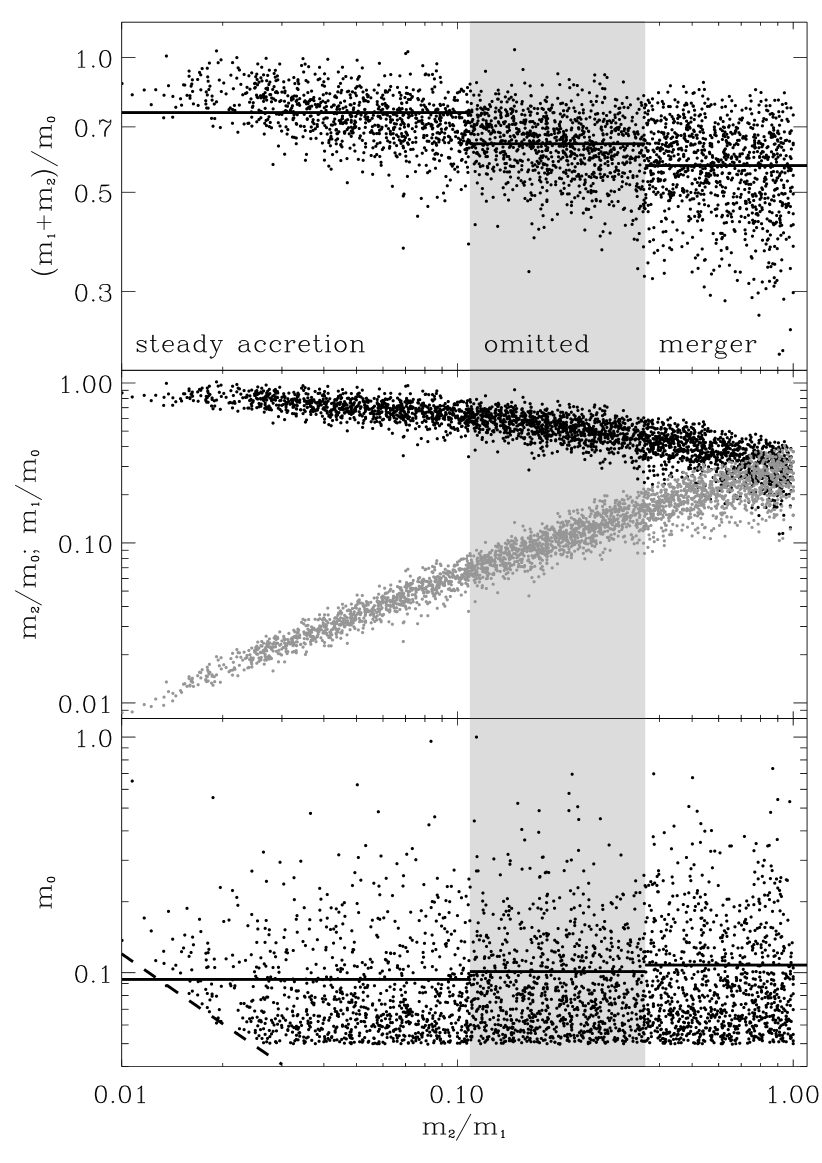
The mean values of the fractions indicated by the horizontal lines in the upper panel of Fig. 1 are lower in the merger sample compared to the steady accretion sample, whereas is higher in the merger sample compared to the steady accretion sample. The difference in the relative decrease of and the increase of indicates a sightly higher additional accretion activity in the merger sample. The increase of indicates that equal mass mergers tend to result in more massive halos. But they also show slightly enhanced accretion activity as indicated by the larger relative decrease of the mean values of compared to the relative increase of .
3 Impact of accretion modes on vector quantities of clusters
In this section we investigate the impact of the pattern of infall on the principal axes and the angular momentum of current clusters. We show the regularity of the infall of the two most massive progenitors in the merger sample and demonstrate that an approximate picture of the infall pattern can be derived from the information provided by the current cluster position and the two most massive progenitor positions (at ). Subsequently the correlation of these positions with the shape and the angular momentum of current clusters is examined.
3.1 Infall pattern
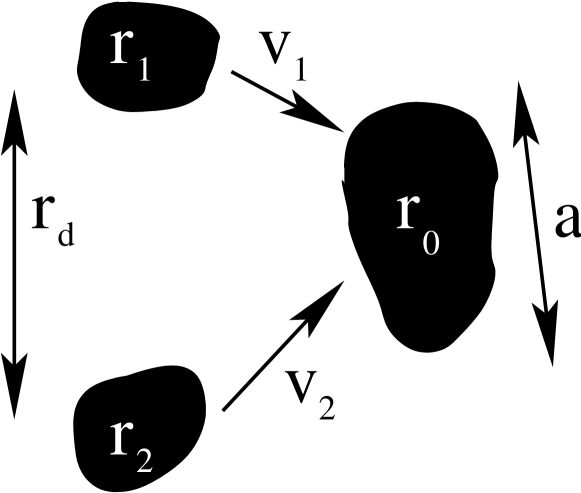
The following illustration of the infall pattern is based on the recent major merger sample (see § 2.3). The vectors, which will be later correlated with the shape and the angular momentum of the emerged cluster, are combinations of the position vectors of the two most massive progenitors and at and of the cluster’s position at . The 2000 progenitors span a mass range of which corresponds to a range in particle numbers of . Subsequently we focus on the difference vector and the cross product of the velocities as defined in the following equations.
| (1) |
| (2) |
where
is the difference vector of the locations of the two most massive progenitors. The directions of the mean velocities and are calculated by subtracting the position of the current cluster by the corresponding positions of the progenitors at . Thus is perpendicular to the orbital plane of the merging progenitors. In Fig. 2 and are sketched along with a schematized merging event.
We only examine the tracks within the recent major merger sample to justify the description of the infall pattern by and . Tracking the halos through 33 intermediate snapshots in the steady accretion mode is unfeasible due to the involvement of low mass (or sparse number of particle) halos. Fig. 3 aims to explain the projection and the adjustment procedures which need to be applied before all the tracks can be stacked up. Starting at we trace the 2000 most massive progenitors through 33 simulation outputs between and . By definition all of these tracks have to merge at some point with another track. The descendant of an actual halo in the subsequent snapshot is in the first instance associated with the halo that contains the most overlapping particles. At the same time we check whether the masses of the descendant and the actual halo are in agreement. For strong deviations (factor of ) we choose, if present, an alternate descendant showing slightly fewer overlapping particles but better mass agreement.
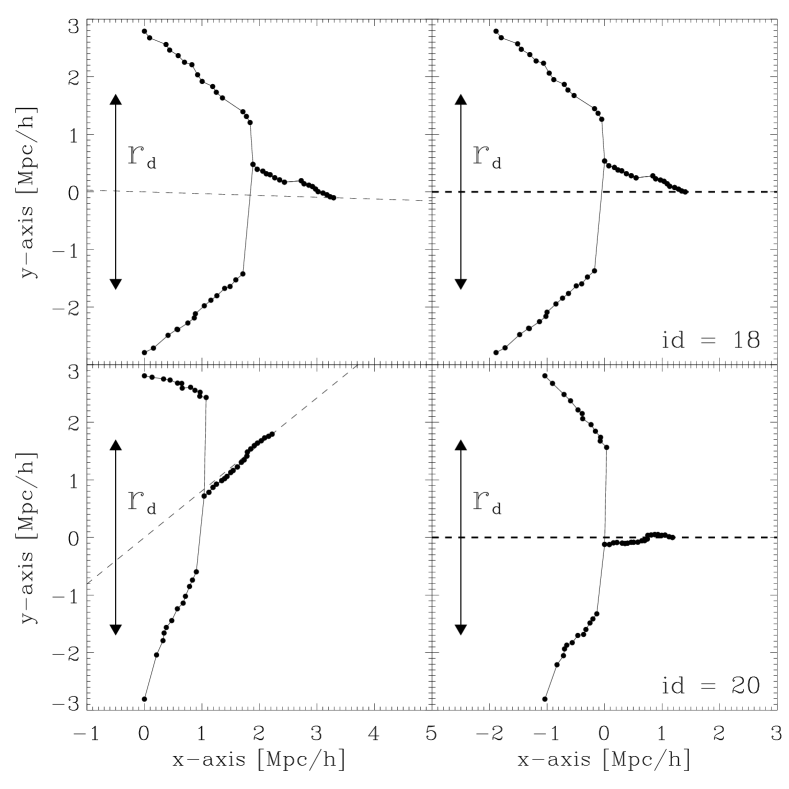
Fig. 3 shows the projection of two different merging events onto the merging plane perpendicular to (see Eq. 2). Here two different representations of the same merging event are depicted in a row. Each dot represents the location of the particular halo at a given snapshot. The coordinate systems in the right panels are rotated in such a way that the positions of the two progenitors are located on the y-axis () with equal separation from the origin. The y-coordinate of the most massive progenitor is displayed at positive y-values, consecutively the second massive progenitor has negative y-values. In the right panels of Fig. 3) the image is stretched in such a manner, that the initial coordinates of the progenitors remain unchanged but the final cluster position is projected to the x-axis (i.e. the dashed line in the left panels coincides with the x-axis in the right panels). Finally the merger point is shifted to the origin. This adjustments neither change the direction of nor the direction of . After applying these adjustments to all the members of the merging sample the resulting tracks are stacked up. Fig. 4 presents face and edge on sight of all the merging events.
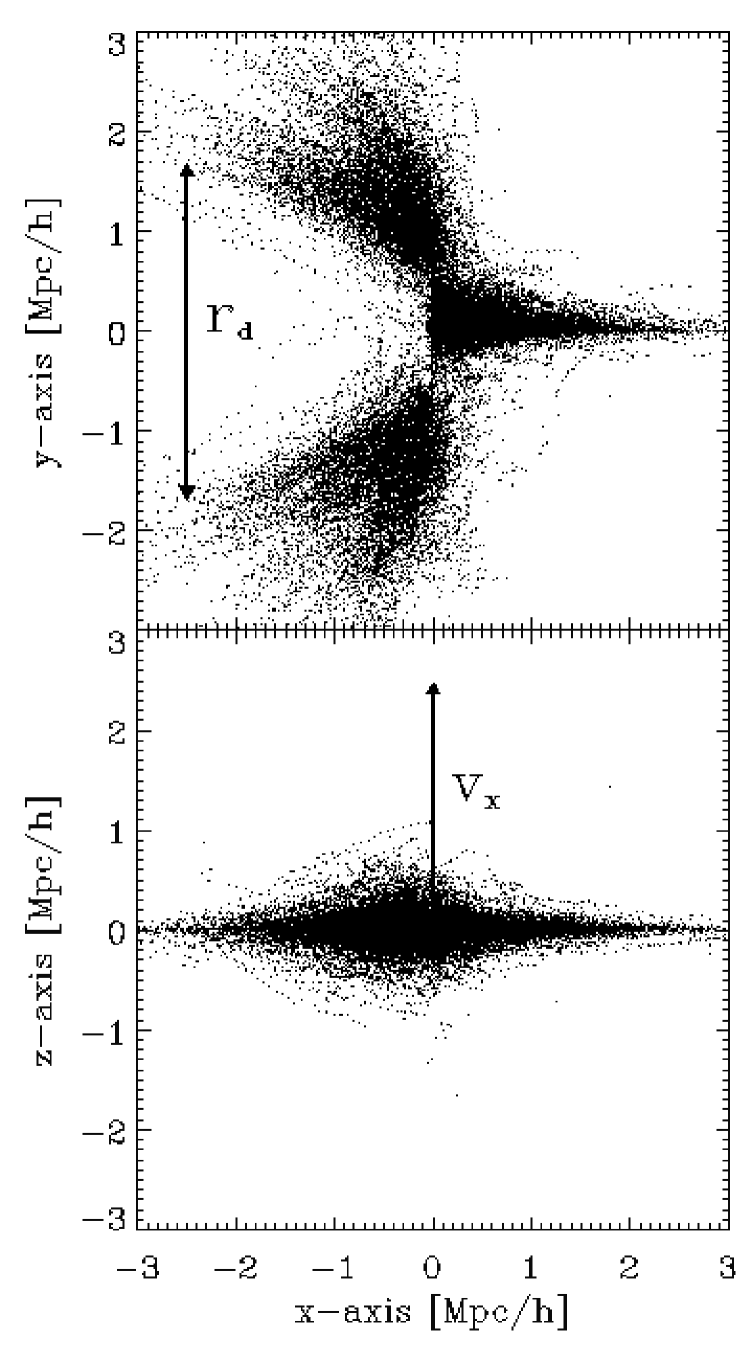
As the tracks of particular merging events (Fig. 3) show the two progenitors approach each other until they merge in a jump-like manner. This behaviour is due to the application of the FoF algorithm for the identification of the halos. The jumps of to the merger point reflect roughly the radii of the progenitor halos. The separation vector connecting the last distinguishable positions of the progenitors is in both cases (upper and lower panels) remarkable aligned with . This feature can also be seen in the stacked up plot (Fig. 4). The two branches depicting the incoming progenitor halos show enhanced densities slightly left of . The line joining this two areas is parallel to the y-axis. Thus the gives a good approximation of the main infall direction. As order of magnitude estimates show the mutual gravitational attraction of two clusters in the considered mass and distance range dominates over the impact of large scale gravitational field. Therefore, the two halos are expected to approach each other in a fairly radial way, along the line joining them.
The tendency of the encounters to be parabolic can be inferred from the average shape of the infall pattern. The flatness of the distribution of tracks in the edge on representation (lower panel of Fig. 4) indicates that describes the orbital plane in a rather satisfactory manner. These outcomes confirm that despite the apparent simplifications the vectors and are capable of determining the direction of infall and the orbital plane, respectively.
3.1.1 Impact of infall pattern on clusters’ shape
In this paragraph we investigate the correlations between vectors and and the shapes of the current clusters. The shape of a cluster is determined by the eigenvectors of the second moment of mass tensor as given by the following equation.
| (3) |
Here specifies the particle masses. The position vector of the CDM particles belonging to the halo is given in respect of the centre of mass and the components of the vector belonging to the th particle are denoted for . Here we show only the results based on the dark matter component, but the behaviour of the gaseous component is very similar. Subsequently the three eigenvectors of are denoted , and . The eigenvalues , and are ordered by magnitude (). Hence indicates the major, the intermediate and the minor axis. Since cluster halos show preferentially prolate shape (see e.g., Warren et al. 1992; Faltenbacher et al. 2002) is identified with the orientation of the cluster.
The distributions of the angles between the principal axes and are shown in Fig. 5. The diagonal represents the cumulative distribution of the cosine of the angles between two randomly orientated vectors. A curve lying below the diagonal indicates an correlation between vectors, i.e. the vectors have a tendency to be parallel more often than a random sample. A curve lying above the diagonal indicates a anti-correlation between the vectors, i.e. the vectors have a tendency to be more often perpendicular than in a random sample. The thick solid, dashed and dotted lines depict the cumulative distributions of the angles between and the principal axes , and as indicated. The left panel shows the results for the recent major merger sample and the right panel those for the steady accretion mode sample. The dashed lines that represent the angles between the major principal axis and deviate most significantly from a randomly generated distribution (diagonal). The major axis () tends to be parallel to . The result of a Kolmogorov-Smirnov (KS) test, comparing these distributions with the random distribution, is given in Tab. 1.

| merger | steady | |
|---|---|---|
The opposite is found for the distributions associated with the two smaller principal axes. They clearly show a trend to be perpendicular to . This behaviour is expected since the principal , and are perpendicular to each other. Therefore, if a vector distribution is strongly aligned with one of these axes it has to be perpendicular to the other two principal axes. The different deviations of and from random expresses a strong confinement of to the - plane (still the alignment with is by far the strongest). The KS probabilities that the actual distributions are accidental realizations of a random process fall below . The general trends match for the distributions related to the two different samples (merger/steady). The distributions of the merger sample show somewhat enhanced deviations from random. The shape of clusters which underwent a recent major merging event is obviously dominated by the orbital parameters of the two progenitors, expressed by the vector . However, since the results of the steady accretion mode sample show qualitatively equal behaviour, the orientation of clusters must be determined in a more general sense by the coherent mass accretion along the filaments of the cosmic network.
As discussed above, § 3.1, is perpendicular to the plane of infall and parallel to the orbital angular momentum of the two progenitors. In Fig. 6 the solid, dotted and dashed lines correspond to the distributions of the angles between and the minor, the intermediate and the major axis. Again the deviation from a randomly generated angle distribution (diagonal) is obvious. The most significant deviation from random is seen for , whereas are almost compatible to random orientations. The KS test results are displayed in Tab. 2. The shape of the distributions indicate, that the major axis is perpendicular to , whereas the minor axes tend to be in parallel with . As mentioned above the distributions related to the different principal axes are not independent. A vector distribution which is strongly aligned with one of these axes is expected to be perpendicular to the other two axes. This is apparently not the case for . This behaviour can be explained if one takes the uncertainty in the determination of the cluster axes into account, which accumulates in the distribution of . On the one hand, if the cluster is prolate (with eigenvalues ) then and are degenerate, on the other hand, if the cluster is oblate () then and are degenerate. In total both effects result in an almost random distribution for .

| merger | steady | |
|---|---|---|
The distributions associated with the merger events show a more prominent deviation from the random for and and a slightly more random like distribution for compared to the steady accretion mode sample. However (as seen before in the distributions) the similarity of the distributions indicates that the mass accretion along the filaments is the predominant factor in the determination of the orientation, no matter which accretion mode (merger/steady) is considered.
3.1.2 Impact of infall pattern on clusters’ angular momentum
The angular momentum is closely related to the dynamics of the halo. However, since the spin parameter of halos is roughly the ordered rotational support against gravity is only about 5% (Steinmetz & Bartelmann 1995; Cole & Lacey 1996). Thus the correlation analysis using the direction of the angular momentum is expected to be blurred by this effect. The angular momentum for a FoF cluster is computed in the following way.
| (4) |
The denotes the particle positions relative to centre of mass, is the particle mass and is the number of particles belonging to the halo. As discussed above the vector is perpendicularly orientated to the infall plane. If the angular momentum of the emerged cluster at is dominated by the orbital angular momentum of two most massive progenitors, then a correlation between and is expected. Therefore we analyse subsequently the distribution of the angles between and . Additionally we consider the angular momenta of the two progenitor halos and , where corresponds to the angular momentum of the most massive and to the second most massive progenitor. In Fig. 7 the various angle distributions connected to the different angular momenta are displayed. Since we have found a strong correlation between and (minor axis of the cluster) we also show using dashed-dotted lines. On the left hand side the results for the merger sample are depicted and the outcome for the steady accretion mode sample is displayed on the right panel. The according KS test results comparing these distributions with the random distributions (diagonals in Fig. 7) are presented in Tab. 3.

| merger | steady | |
|---|---|---|
The distributions between the angular momenta of the two progenitors agree with random orientations for both samples. also shows similar behaviour, indicating that tends to be parallel to . Here the KS probabilities are enhanced for the merger sample, but the qualitative trend is similar in the steady accretion mode sample. The most obvious differences between the two samples are seen in and . These distributions show opposite behaviour for the merger and the steady accretion mode sample. In the merger sample the KS probabilities for are very low, indicating that this distribution is obviously incompatible with a random distribution. Instead is almost in agreement with a random distribution. The opposite picture arises in the steady accretion mode sample. Here is clearly not in agreement with a random distribution, whereas can’t be differentiated from random.
We find the effect of steady accretion on the angular momentum is in line with previous work (i.e. Vitvitska et al. 2002). If there is no major merger, the angular momentum of the most massive progenitor will be aligned with the angular momentum of the descendant cluster. As seen in Fig. 1, the most massive progenitor in the steady accretion sample is orders of magnitude larger than all other infalling halos. This explains the result for . The small tendency of an alignment between and may have the same origin as the finding by Benson (2005), that merging dark matter satellites show a weak tendency to have velocities perpendicularly orientated to the angular momentum of the main halo.
In the merger sample the orbital angular momentum of the two most massive progenitors shows a strong impact on the angular momentum of the descendant. A decided difference between and a random distribution can be seen. The KS probability of strongly discounts any random process as being the origin of this distribution. The tendency for and to be parallel confirms the picture that a large fraction of the descendant’s angular momentum was gained from the orbital angular momentum of the two most massive progenitors. This result is in agreement with the detailed study of the angular momenta of dark matter halos by Vitvitska et al. (2002). Whereas the correlation of and is in agreement with random orientations as can be seen by the rather high value of the KS test.
4 Correlations in orientation and angular momentum
As shown above orientation and angular momentum of current clusters are tightly connected to the infall pattern. The dominant amount of mass is accreted along filaments. Therefore we employ the technique of mark correlation functions (see Stoyan & Stoyan (1994); Faltenbacher et al. (2002); Kasun & Evrard (2004)) to investigate the difference in the large scale correlations between the basic sample and the two accretion mode sub-samples (merger/steady). Faltenbacher et al. (2002) used the following equation to study filamentary alignment.
| (5) |
Here is a normalised vector quantity (), is the distance vector between a pair of clusters with absolute value . The normalised distance vector is denoted by and denotes the average over all pairs with separation . Due to the spatial symmetry the absolute values of these scalar products are used. quantifies the ilamentary alignment of the vectors and with the line connecting both clusters. is proportional to the mean value of the cosine of the angles between and the vector connecting the pairs. Random orientations imply . Since the distribution of angles is not of Gaussian shape around a given mean value, it would be wrong to apply Gaussian statistics to estimate the the errors. Thus, to investigate the 1 confidence intervals we perform a non-parametric Monte Carlo test (Besag & Diggle, 1977; Gottlöber et al., 2002; Kerscher et al., 2001; Kerscher, 1998). Here the null hypothesis is “no deviation from random angles”. We simulate this null hypotheses by keeping the positions of the halos fixed and randomly re-assigning the orientations to the halos. This procedure is repeated 99 times. The rms-deviation for these realisations gives a measure for the 1 confidence interval for the given data set. These intervals are indicated by the shaded areas around the expected values for random distributions in Fig. 8. Thus, if lies outside of this intrinsic scatter region around the deviation from random orientations is confirmed at a 1 confidence level. In addition to the alignment of the CDM component we present the alignment signals for the gaseous halos. Kazantzidis et al. (2004) (see also Dubinski 1994) pointed out that the elongation of halos is reduced due to radiative cooling and subsequent condensation of baryonic matter at the cluster centre. Since we use non radiative SPH simulations this effect is not represented. However according to Eq. 3 the second moment of mass tensor and thus the orientations of the principal axes are dominated by the mass distribution on the outskirts of the clusters. Moreover, we are mainly concerned with the orientation of the halo, not the actual axial ratios, and the orientation is not affected by dissipative effects.
4.1 Correlation of clusters’ orientations
We have shown in that the different accretion modes do not result in a qualitatively different impact on the shape of current cluster. However the correlation between shapes and infall pattern are reduced in the steady accretion mode sample. Here we separately investigate the filamentary correlation of the orientation of cluster for the different samples (basic, merger, steady) to see whether this quantitative differences influence the signal for large scale correlations. Replacing in Eq. 5 with the major (and subsequently the minor principal) axes results in
| (6) |
Here and denote the principal axes (major or minor) of a cluster pair at and the associated separation vector . The analysis is done for the whole cluster sample and for the two sub-samples (merger/steady) separately. The results for the alignment of the major and the minor axes are shown in upper and middle panel of Fig. 8.
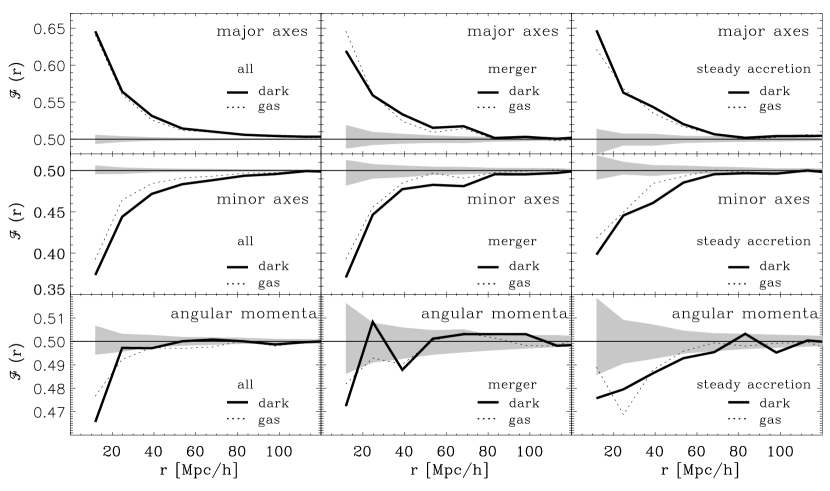
indicates that the axes tend to be aligned with the connecting line of the clusters. For the basic cluster sample, comprising the 3000 most massive clusters in the simulation volume, this signal for the major axes extends up to (left panel of Fig. 8, compare also to Fig. 3b in Faltenbacher et al. 2002). The signal for the merger and the steady accretion mode samples extends up to . There is no distinctive difference between the results for the two sub-samples. The somewhat shorter range seen in both sub-samples appears to be a result of the lower statistics (only 1000 members per sub-sample) rather than caused by the different accretion modes.
indicates that the axes tend to be perpendicular to the connecting line of the cluster pairs. In the basic cluster sample the signal for the minor axis extends up to (middle left panel of Fig. 8). This result is in good agreement with Bailin & Steinmetz (2005), where a strong tendency for the minor axes of halos to lie perpendicular to the large scale filaments is found. The CDM components of the recent major merger sample (middle panel of Fig. 8) and the steady accretion mode sample show a tendency to be perpendicular to the connecting line for separations up to . Here again the shorter correlation ranges for the sub-samples are likely be caused by the smaller sample size.
The comparison between the signals for the CDM component (thick solid line) to the gaseous component (thin dotted line) generally show good agreement. However, the small differences in the correlation range are likely to mirror the different physical properties of the two components. Using X-ray position angles Chambers et al. 2002 found that clusters with separations tend to point towards their neighbours. Their sample comprised 45 clusters thus the statistics are fairly low compared to our analysis.
Previously we have shown that the infall of halos is correlated with the orientation of the cluster and is independent of accretion mode. In this section we demonstrate that the orientations of clusters are correlated and independent of accretion mode. Since the steady accretion mode sample shows just as much correlation as the merger mode sample all progenitors must be infalling along the same relative direction. From this, we conclude that the alignment is strongly supported by infall along filamentary structure. The correlation length () for cluster alignment that we find in our simulation is in agreement with the findings of Hopkins et al. (2005).
4.2 Alignment of clusters’ angular momenta
In § 3.1.2 we have analysed the effects of different accretion modes on the angular momentum of current clusters. We find a different behaviour in the merger and the steady accretion mode samples. To see, whether these differences have impact on the large scale correlations, we investigate the correlation of the intrinsic angular momenta of cluster pairs in the whole sample, as well as in the two sub-samples. Therefore the angular momenta is used as vector mark in equation (5).
| (7) |
Here and denote the normalised angular momenta of a cluster pair separated by the spatial vector . The result of this study is displayed in the lower panels of Fig. 8. Similar to the result for the correlation of the minor axes (middle panels Fig. 8) the angular momenta of the CDM component show the trend to be perpendicular to the connecting lines. Thus they tend to be perpendicular to the filaments as well. The signal reaches only out to separations of for the complete sample. This result is in qualitative agreement with Fig. 7b in Faltenbacher et al. (2002).
The CDM signal in the recent major merger sample is hardly distinguishable from random fluctuations. Furthermore the deviation from random is far smaller than seen in the correlations of the principal axes. As mentioned in the beginning of §3.1.2, coherent rotation supports the halo against gravitational collapse only at a 5% level, thus a low deviation from random may be expected. However, notable is the long correlation range of the steady accretion mode sample () compared to the almost disappearing signal for the merger sample. According to the established picture of halos’ mass growth they go through a merger phase (rapid mass growth) prior to a steady accretion phase (see e.g. Wechsler et al. 2002). Therefore, on average the merger sample is younger than the steady accretion sample. The results from the above combined with those from the previous section lead to the conclusion that infall along the filaments tends to torque the halo’s angular momentum into a perpendicular orientation with respect to those filaments. Colberg et al. (2005) finds a trend that more massive clusters have more associated filaments. Fig. 1 indicates a relative increase of clusters’ masses in the major merger sample. Moreover, the mass accretion in addition the two most massive progenitors is maximal in the major merger sample. The rapid accretion in the merger sample takes place along various filaments which causes violent changes in the the angular momentum. In a later state, when the smaller filaments are exhausted, the infall direction is more uniform. According to this scenario it is expected that the merger sample will settle down in time and reflect the same sort of correlations as the current steady accretion sample. We plan on addressing this issue in a soon to be forthcoming paper Allgood et al. (2005).
The slightly different behaviour of the gaseous component indicated by the thin dotted lines in the lower panel of Fig. 8 is likely to be caused by differences in the underlying dynamics. The gaseous component mainly deviates for cluster pair separations from the dark matter distribution.
5 Summary
We use large scale SPH+N-body simulations within the concordance CDM model to measure the mass accretion histories and the correlation of orientation and angular momentum of galaxy clusters. The two most massive progenitors at are located for the 3000 most massive current clusters. Based on the mass fractions of these two progenitors () two sub-samples were constructed, a recent major merger sample containing the 1000 clusters with highest values and a steady accretion mode sample with the 1000 lowest values.
The mean values of , where denotes the current mass of the particular cluster, for the recent major merger sample and the steady accretion mode sample are and , respectively. The clusters which experienced recent major mergers tend to accrete even more matter in addition to than silently evolving clusters. Major mergers predominantly happen to clusters showing averagely enhanced mass accretion. Moreover these clusters tend to have higher masses than their non merging counterparts. This outcome can be related to the work by Colberg et al. (2005). They demonstrate that more massive clusters tend to have more filaments approaching them. Consequently their over-all accretion activity may be enhanced. Also Benson (2005) reports strongly enhanced merging activities for the largest members in his sample of N-body clusters.
The reconstruction of the halo tracks in the merger sample reveals that the infall pattern are not complex. The merging takes place along the vector joining the two most massive progenitor halos at . Despite the relatively high additional mass accretion the tracks of the two most massive progenitors are reasonably well confined within the plane defined by (Eq. 2). The tracks do not twine each other, instead the two most massive progenitors approach each other parallel to the line joining them . This behaviour is expected since the mutual gravitational attraction of two clusters in the considered mass and distance range dominates over the impact of large scale gravitational field.
We find that the orientation and the angular momentum of current clusters are tightly correlated with the vectors and . tends to be parallel to the major axis and perpendicular to the minor axis of the cluster. The opposite behaviour is found for . Both accretion mode sub-samples show similar correlations. This indicates that the current orientation is a result of mass flows along the filaments onto the cluster, independent of accretion mode. It is likely that the accretion flow determines the velocity structure of the cluster. If this is the case our results agree with alignment of position and velocity principal axes found by Tormen (1997) and Kasun & Evrard (2004). However, the angular momentum behaves differently in the two sub-samples. The angular momenta of the clusters in the merger sample show the tendency to be parallel to , whereas the orientation of the intrinsic angular momenta of the most massive progenitors at has a minor influence on the angular momentum at . The opposite picture arises in the steady accretion mode sample. Here and are correlated, whereas the angle distribution between and is in agreement with random orientations.
The major axes of cluster pairs in the basic sample tend to be parallel to their connecting line for distances up to . Correlations up to are found in the steady accretion and the merger sample. The reduced extension of the correlation is likely caused by the reduced statistic in the sub-samples. The minor axes of cluster pairs tend to be perpendicular to their connecting line. The extension of these correlations is similar to the findings for the major axes. The appearance of large scale correlations of cluster orientations has also been shown by Faltenbacher et al. (2002); Hopkins et al. (2005) and Kasun & Evrard (2004). The mass accretion along the filaments appears to be responsible for the signal, since the accretion mode shows no impact on the correlation signal.
Weak correlations are found for the angular momenta in the complete and the steady accretion mode sample. The angular momenta tend to be orthogonal to the connecting lines of cluster pairs up to for the complete and up to for the steady accretion mode sample. The orthogonality between angular momentum and filaments is a result of mass accretion along these filaments (see also Bailin & Steinmetz 2005). The signal is stronger for the steady accretion sample because the halos in this sample have already gained major parts of their angular momentum from infall along the filaments. The merger sample is still in a phase of accretion and it is expected that additional infall along the filaments will bring the merger sample into better agreement with the steady accretion sample. The correlations in the orientations and the angular momenta for the gas and the dark matter components show very similar behaviour, supporting the search for alignment effects in large X-ray samples of clusters of galaxies.
Acknowledgements
The authors would like to thank the anonymous referee for helpful and constructive comments. We would also like to thank William G. Mathews and Joel Primack for insightful advises. AF has been supported by NSF grant (AST 00-98351) and NASA grant (NAG5-13275). BA has been supported by NASA grant (NAG5-12326) and a NSF grant (AST-0205944). GY thanks M.E.C (Spain) for financial support under projects AYA-2003-07468 and BFM2003-01266. GY and SG thanks the Acciones Integradas Hispano-Alemanas for support. YH has been supported by the Israel Science Foundation grant 143/02. The simulations were performed at the John von Neumann Institute for Computing Jülich.
References
- Allgood et al. (2005) Allgood B., Flores F., Primack J. R., Kravtsov A., Wechsler R. H., Faltenbacher A., Bullock J. S., 2005, in prep
- Bailin & Steinmetz (2005) Bailin J., Steinmetz M., 2005, ApJ in press (astro-ph/0408163)
- Basilakos et al. (2005) Basilakos S., Plionis M., Yepes G., Gottlöber S., Turchanino V., 2005, MNRAS submitted (astro-ph/0505620)
- Benson (2005) Benson A. J., 2005, MNRAS, 358, 551
- Besag & Diggle (1977) Besag J., Diggle P. J., 1977, Appl. Statist., 26, 327
- Binggeli (1982) Binggeli B., 1982, A&A, 107, 338
- Binney & Silk (1979) Binney J., Silk J., 1979, MNRAS, 188, 273
- Chambers et al. (2002) Chambers S. W., Melott A. L., Miller C. J., 2002, ApJ, 565, 849
- Colberg et al. (2005) Colberg J. M., Krughoff K. S., Connolly A. J., 2005, MNRAS, 359, 272
- Colberg et al. (2000) Colberg J. M., White S. D. M., Yoshida N., MacFarland T. J., Jenkins A., Frenk C. S., Pearce F. R., Evrard A. E., Couchman H. M. P., Efstathiou G., Peacock J. A., Thomas P. A., The Virgo Consortium 2000, MNRAS, 319, 209
- Cole & Lacey (1996) Cole S., Lacey C., 1996, MNRAS, 281, 716
- Davis et al. (1985) Davis M., Efstathiou G., Frenk C. S., White S. D. M., 1985, ApJ, 292, 371
- Doroshkevich (1973) Doroshkevich A. G., 1973, ApL, 14, 11
- Dubinski (1994) Dubinski J., 1994, ApJ, 431, 617
- Dubinski & Carlberg (1991) Dubinski J., Carlberg R. G., 1991, ApJ, 378, 496
- Faltenbacher et al. (2002) Faltenbacher A., Gottlöber S., Kerscher M., Müller V., 2002, A&A, 395, 1
- Gottlöber et al. (2002) Gottlöber S., Kerscher M., Kravtsov A. V., Faltenbacher A., Klypin A., Müller V., 2002, A&A, 387, 778
- Hopkins et al. (2005) Hopkins P. F., Bahcall N. A., Bode P., 2005, ApJ, 618, 1
- Jenkins et al. (2001) Jenkins A., Frenk C. S., White S. D. M., Colberg J. M., Cole S., Evrard A. E., Couchman H. M. P., Yoshida N., 2001, MNRAS, 321, 372
- Kasun & Evrard (2004) Kasun S., Evrard A., 2004, ApJ submitted (astro-ph/0408056)
- Kazantzidis et al. (2004) Kazantzidis S., Kravtsov A. V., Zentner A. R., Allgood B., Nagai D., Moore B., 2004, ApJ, 611, L73
- Kerscher (1998) Kerscher M., 1998, A&A, 336, 29
- Kerscher et al. (2001) Kerscher M., Mecke K., Schuecker P., Böhringer H., Guzzo L., Collins C. A., Schindler S., De Grandi S., Cruddace R., 2001, A&A, 377, 1
- McMillan et al. (1989) McMillan S. L. W., Kowalski M. P., Ulmer M. P., 1989, ApJS, 70, 723
- Onuora & Thomas (2000) Onuora L. I., Thomas P. A., 2000, MNRAS, 319, 614
- Peebles (1980) Peebles P. J. E., 1980, The Large Scale Structure of the Universe. Princeton: Princeton University Press
- Plionis (1994) Plionis M., 1994, ApJS, 95, 401
- Plionis et al. (2003) Plionis M., Benoist C., Maurogordato S., Ferrari C., Basilakos S., 2003, ApJ, 594, 144
- Porciani et al. (2002a) Porciani C., Dekel A., Hoffman Y., 2002a, MNRAS, 332, 325
- Porciani et al. (2002b) Porciani C., Dekel A., Hoffman Y., 2002b, MNRAS, 332, 339
- Rhee & Latour (1991) Rhee G. F. R. N., Latour H. J., 1991, A&A, 243, 38
- Richstone et al. (1992) Richstone D., Loeb A., Turner E. L., 1992, ApJ, 393, 477
- Springel et al. (2001) Springel V., Yoshida N., White S. D. M., 2001, New Astronomy, 6, 79
- Steinmetz & Bartelmann (1995) Steinmetz M., Bartelmann M., 1995, MNRAS, 272, 570
- Stoyan & Stoyan (1994) Stoyan D., Stoyan H., 1994, Fractals, Random Shapes and Point Fields. John Wiley & Sons, Chichester
- Suwa et al. (2003) Suwa T., Habe A., Yoshikawa K., Okamoto T., 2003, ApJ, 588, 7
- Tormen (1997) Tormen G., 1997, MNRAS, 290, 411
- Ulmer et al. (1989) Ulmer M. P., McMillan S. L. W., Kowalski M. P., 1989, ApJ, 338, 711
- van Haarlem et al. (1997) van Haarlem M. P., Frenk C. S., White S. D. M., 1997, MNRAS, 287, 817
- Vitvitska et al. (2002) Vitvitska M., Klypin A. A., Kravtsov A. V., Wechsler R. H., Primack J. R., Bullock J. S., 2002, ApJ, 581, 799
- Warren et al. (1992) Warren M. S., Quinn P. J., Salmon J. K., Zurek W. H., 1992, ApJ, 399, 405
- Wechsler et al. (2002) Wechsler R. H., Bullock J. S., Primack J. R., Kravtsov A. V., Dekel A., 2002, ApJ, 568, 52
- West (1994) West M. J., 1994, MNRAS, 268, 79
- West & Blakeslee (2000) West M. J., Blakeslee J. P., 2000, ApJ, 543, L27
- White (1984) White S. D. M., 1984, ApJ, 286, 38