11institutetext: Dipartimento di Astronomia e Scienza dello Spazio, Largo
E. Fermi 2, I-50125 Firenze, Italy,
22institutetext: Osservatorio Astrofisico di Arcetri Largo E. Fermi 5, I-50125 Firenze, Italy
33institutetext: Max-Planck-Institut für extraterrestrische Physik, Giessenbachstraße, D-85748 Garching, Germany
44institutetext: Istituto di Radioastronomia, Sezione di Firenze - CNR Largo E.Fermi 5, I-50125 Firenze Italy
55institutetext: SISSA/International School for Advanced Studies Via Beirut, 4
34014 Trieste, Italy
Constraining the thermal history of the Warm–Hot
Intergalactic Medium
L. Zappacosta
11 R. Maiolino
22
A. Finoguenov
33 F. Mannucci
44
R. Gilli
22 A. Ferrara
55
zappacos@nabhas.ps.uci.edu
(Received ; accepted )
We have identified a large-scale structure traced by galaxies at z=0.8,
within the Lockman Hole, by means of multi-object spectroscopic observations. By
using deep XMM images we have investigated the soft X-ray emission from
the Warm-Hot Intergalactic Medium (WHIM) expected to be associated with
this large-scale structure and we set a tight upper limit to its flux in the
very soft
0.2–0.4 keV band. The non-detection requires the WHIM at these redshifts
to be cooler than 0.1 keV. Combined with the WHIM emission detections at
lower redshift, our result indicates that the
WHIM temperature is rapidly decreasing with redshift, as expected in
popular cosmological models.
Key Words.:
Large-scale structure of Universe - X-rays: diffuse background
††offprints: L. Zappacosta,
1 Introduction
Both observations and cosmological models suggest that most of the baryonic
matter is located in the intergalactic medium (IGM). Cosmological models
have also shown that the evolution of the baryonic matter is driven by
progressive gravitational heating in the potential field of dark matter
filaments (Cen & Ostriker 1999; Davé et al. 2001). In particular, at high redshifts (2–3) the
baryonic gas is relatively cold ( K), and is identified with
Ly absorbers along the line of sight of quasars, while at lower
redshifts (1) the shocks due to the infall of the gas on the dark
matter filaments (traced by the regions of high galaxy number densities)
gradually heat the gas to temperatures in the range
T K.
The identification of such Warm-Hot Intergalactic Medium (WHIM) in the local
universe has received growing interest in the last few years. The detection of
absorption lines from highly ionized species (,
, ), both in the
UV and in the soft X-rays, has allowed to unambiguosly identify WHIM along
the line of sight of a few bright quasars (Nicastro et al. 2002; Mathur et al. 2003). The
detection of emission due to WHIM is quite challenging. Indeed, the WHIM is
expected to emit weak and diffuse radiation mostly in the softest X-ray
bands (), where both the Galactic absorption and the foreground
emission from the Local Hot Bubble (LHB) and Milky Way Halo are
strong. Nevertheless, several
independent detections of WHIM emission were obtained by detailed analysis
of soft X-ray maps (ROSAT and XMM) in regions characterized by galaxy
overdensities and by the spectral analysis of clusters of galaxies and of
their surroundings (Wang et al. 1997; Sołtan et al. 2002; Zappacosta et al. 2002, 2004; Kaastra et al. 2003; Finoguenov et al. 2003).
All WHIM detections discussed above have been obtained for gas in the local
universe or at low redshift. The most distant WHIM emission detected so far
was obtained at z0.45 by Zappacosta et al. (2002). At higher redshift the
detection is more difficult because of both technical and physical
reasons. Indeed, the lack of bright, high redshift quasars
prevents the detection of WHIM features in absorption, while the thermal
cutoff is redshifted to lower energies making more difficult to detect the
WHIM emission even in the soft X-rays. An additional issue is that,
according to cosmological models, the WHIM should be cooler at higher
redshift, implying a lower ionization state of the gas (i.e. lower optical
depth of high ionization absorbers) and a thermal cutoff further moved
to lower energies. Yet, it would be
most useful to obtain some constraints on the WHIM properties at high
redshift since, when compared with the WHIM detections in the local
universe, it would provide contraints on the cosmological models of the
evolution of baryons.
To pursue the latter goal we started a detailed investigation of the Lockman
Hole, which is one of the fields where the Galactic absorption is
minimum ()
and where deep X-ray observations have been obtained (Hasinger et al. 1998a, 2001; Hasinger 2003).
We have searched for
superstructures by analyzing the redshift distribution of sources already
identified in this field and found 8 sources in a narrow redshift range at
about z0.8, located within a region of about 20 arcmin. We obtained
multi-object spectroscopy in the same area and, as discussed in
Sect. 2, we have confirmed the presence of a superstructure at
z0.8. Then we have analyzed an XMM map of the LH in the softest band
and, as discussed in Sect. 3, we have obtained tight constraints
on the possible diffuse emission due to WHIM associated with the large-scale
structure. In Sect. 4 we discuss these observational
constraints on the evolution of the WHIM with redshift.
2 Optical observations: detection of a large-scale
structure at z0.8
As mentioned in the Introduction, an analysis of the redshift distribution
of the sources previously identified in the Lockman Hole (most of which are
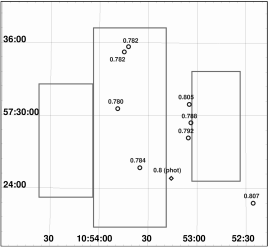
Figure 1: Spatial distribution of objects reported
in the literature in the narrow redshift
range 0.78z0.81 within the Lockman
Hole (see Table LABEL:arch_tab). Each object is labelled with its redshift.
The object marked with a diamond has a
photometric redshift. Boxes indicate the regions
covered by our spectroscopic survey
with 10 masks.
optical counterparts of X-ray sources detected by ROSAT and XMM) has
revealed the existence of 8 sources in the narrow redshift range
0.780–0.807 (111In the whole paper we assume a
cosmology with , and and all the
distances will be expressed in the comoving rest frame.). These sources (listed in table LABEL:arch_tab)
are marked with a circle in Fig. 1 and are located within a
region of about 20 arcmin. In the same region we have found another object
(marked with a diamond) with a photometrically estimated redshift of
. Note that 4 of such objects (distributed along the N–S
direction) have redshifts in the narrower interval 0.780–0.784. This is
strongly suggestive of the existence of a large-scale structure at this
redshift in this region of the Lockman Hole.
To confirm this tentative indication we have obtained multi-object
spectroscopy of 215 galaxies in the same area. We used the
multi-object spectroscopic mode (MOS) of the optical spectrometer
DOLORES, at the Telescopio
Nazionale Galileo (TNG), with the LR–R grating, which covers
the 4470–10360 Å range at a resolution of .
This spectral range allows the identification of
H+[OIII] and [OII] at z0.8.
Table 1: Objects in the narrow redshift range
0.78z0.81 located within the Lockman Hole
reported in the literature.
The observations were performed during four nights in March 2003.
We selected two samples of galaxies within the subarea
of interest of the Lockman Hole. In particular, we selected a shallow sample,
made of galaxies in the magnitude range , and
a deep sample, containing galaxies in the magnitude range .
The shallow sample was observed with seven masks and with an
integration of 1.5 hours for each mask, while the deep sample was
observed with three masks and with an integration of 3 hours per mask.
Most of the masks (7 of them) were located along the N–S direction traced by
the 4 sources at z=0.78, while three masks were located to
the west and to the east to check possible extensions of the putative large
scale structure. The location of the various masks is shown by the boxes in
Fig. 1.
The MOS spectra were reduced following the standard
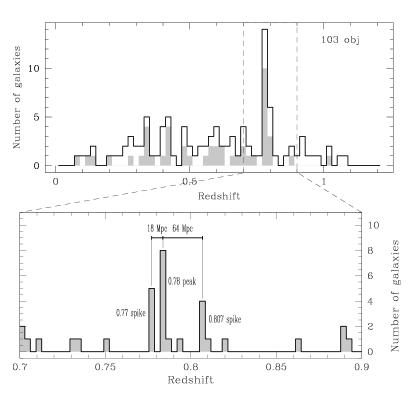
Figure 2: Upper panel: redshift distribution of the objects for which
we have obtained high quality (shaded histogram) and low quality
(hollow histogram) spectroscopic redshift measurements. Lower panel:
zoom of the redshift distribution around the three main
concentrations of objects.
threads (dark and bias subtraction, flat fielding, wavelength
calibration). The deep sample was observed using a dithering of 6
arcsec along the slit axis to enable a better subtraction of sky lines and
an easiest detection of the weak emission lines.
We observed 215 sources in total.
We measured redshifts for 103 objects (see Appendix A for
the catalog) with typical random errors of
, as inferred by the uncertainty on the gaussian fit to the
emission lines222 The only source of possible systematic errors is
spectral calibration. However, such systematic errors are smaller
than the estimated random errors..
For 47 sources the
redshift could be determined unambiguously thanks to the detection of two or
more emission lines. We assigned unambiguously the redshift also in case of
detection of only one strong emission line identified as [OII] line at high
redshift 333Alternatively it would be the H of local objects
(z), but in the latter case the objects should be extended and bright,
unlike the ones in our samples. (in Appendix
A the quality of these redshifts is marked as “high”).
For other 56 objects the redshift
determination was less secure, based on line detections with low signal to
noise ratio (in Appendix
A the quality of these redshifts is marked as “low”).
For 112 sources the spectrum was too weak and without bright lines, and we
could not recover any information on their redshifts.
The redshift
distribution is shown in the top panel of Fig. 2, where a
prominent peak ( significant with respect to the mean histogram
level) is seen at the expected redshift of z=0.78, demonstrating
beyond any doubt the presence of a large-scale structure at this redshift in
this region. As for the archival objects, this spike shows two distinct
sub-concentrations one at z and one at z. The
former is further splitted into a main peak at z and
a nearby spike at
z, as shown in the bottom panel. Fig. 3 shows the
distribution projected on the sky of the sources for which the redshift could be
determined, and in particular for those in the redshift spikes.
Although this redshift survey is not complete, our data
suggest that these structures at slightly different redshifts tend also to be
distributed in different regions of the sky. In particular,
galaxies on the red tail of the main spike, and specifically at
z are located in
the southern part of the field, while galaxies in the main spike at
z are preferentially distributed in the northern part. The
distribution of the galaxies in the farther spike at z overlaps
with the previous two, but the presence of another source at 0.807 (the
one located most to the west in Fig.3),
previously identified by Lehmann et al. (2001),
suggests that this substructure extends towards the west. We have
tentatively encircled the three main substructures with three ellipses in
Fig.3.
On the whole the superstructure outlined by our survey and the
archival objects cover a region
of (at the mean redshift z=0.791). This could be considered as a lower limit to
the dimension of the structure because its size is limited by the
extent of our observations.
However, we note that other spectroscopic surveys covering the entire
XMM and ROSAT-HRI fields have not found additional objects in the
narrow redshift range outside the area considered by us, suggesting
that the large-scale structure is not further extended at least in the
XMM and ROSAT-HRI fields.
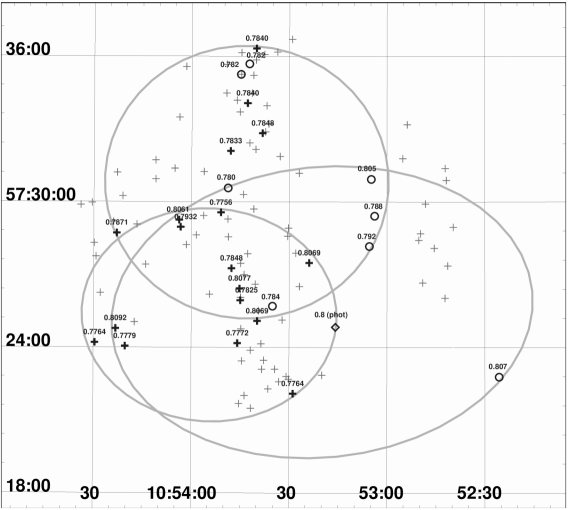
Figure 3: Spatial distribution of the various spectroscopically
identified sources and in particular of those at the
redshift corresponding to the spikes at z0.8.
Crosses mark the position of all the galaxies with redshifts
measured by us (the thick ones are the sources belonging to
the superstructure). The circles and the diamond are the archival
objects at the same redshift of the spike (as in
Fig. 1). For all the
galaxies belonging to the superstructure we have reported
their measured redshift.
The large ellipses tentatively indicate the regions
which may be mostly populated by the three
subspikes.
3 X-ray data: constraints on the WHIM emission
Once demonstrated that large-scale structures at high redshift exist within
the Lockman Hole, we have then investigated whether the associated WHIM emission
could be detected. Such investigation requires sensitive maps at soft
energies E0.5 keV, both because of the low temperatures typical of
WHIM and because of a significant Doppler shift of the emission
to lower energies.
Several deep X-ray
observations have been carried out in the Lockman Hole area, most importantly
with ROSAT and XMM-Newton (Hasinger et al. 1998a, 2001).
ROSAT maps would have the required field of view and sensitivity at low
energies to properly constrain the presence of diffuse warm gas at high
redshifts. However, the region which we are investigating is also
characterized by a high density of X-ray point sources (a fraction of which
belonging to the large-scale structure at z=0.78) and by a few clusters of
galaxies (Hasinger et al. 1998b). After the subtraction of the instrumental background and the point
source removal through the procedures described in Zappacosta et al. (2002),
we find diffuse emission coincident with the superstructure.
However, the relatively extended
wings of the ROSAT PSF from the point sources probably contribute
significantly to the diffuse emission.
Indeed, this apparently extended emission elongated in the direction N–S is
also found in the
harder maps (R45 and R67). The spectral shape of such extended emission
is the same as for the point sources, associating this emission with
residual wings of point sources as well as a
possible detection of unresolved AGNs associated with the large-scale structure
(e.g. Gilli et al. 2003). The observed hardness of the emission is also at
variance with what found in other fields where diffuse emission has a much
softer spectrum (e.g. Zappacosta et al. 2002). The presence of such
N-S unresolved AGN emission further suggests the presence of an
overdense region of galaxies in this area of the Lockman Hole.
Chandra has a much better angular resolution which allows the removal of the
contribution from point sources with a much higher accuracy.
However, its sensitivity drops
drastically at energies E0.5 keV, preventing us to
study the level of soft diffuse X-ray emission.
The small field of view of ACIS-S (the Chandra chip
which has higher sensitivity in the soft band
than ACIS-I) is also problematic to detect extended
emission.
XMM has the appropriate compromise between angular resolution, good
sensitivity in the softest X-ray band at E0.5 keV, and extension of
the field of view. The Lockman Hole has
been subject of deep observations with XMM
(Hasinger et al. 2001; Hasinger 2003).
In particular, the 100 ksec observation obtained by Hasinger et al. (2001)
was performed
with the “thin” filter, which
allows the detection of photons down to 0.2 keV.
Additional 800 ksec of integration (Hasinger 2003) were obtained
with the “medium” filter, which absorbs
photons with E0.5 keV. The latter observation cannot
be used to constrain the WHIM emission because of
its energy cutoff at 0.5 keV, however it can be
efficiently used to subtract spurious contribution
to the diffuse emission by hard sources, as we shall
discuss later on. In the following we will focus
on the analisys of the XMM data taken with the
“thin” filter.
The major difficulty in using the soft
energy band is the presence of the electronic noise that dominates the
emission (Lumb et al. 2002; Read & Ponman 2003). The spectrum
of the electronic noise is very stable, and its statistical noise consists
in a number of small-amplitude events occurring during every frame
exposure. There are no fluctuations in a
number of events, so the removal of these has no major influence on the
detection statistics for the X-ray emission. Electronic noise has a similar
spatial distribution for the same detector read-out mode, but its spectrum
varies as a function of frame time and is subject to an energy offset
on the 10
eV scale for each individual pixel. This energy offset applies to all
events, resulting in a decrease of the energy resolution for an extended
source. Investigations of the electronic noise by the EPIC calibration team
at the Max-Planck Institut für Extraterrestrische Physik showed that it is
possible, by using the shape of the electronic noise, to actually determine the
energy offset in each pixel for each observation and then
efficiently and accurately
remove the electronic noise from the event lists. The software and
processing recipes are made available to a general user as a new task,
epreject, within SAS 6.0 release. In this Paper we
describe the results obtained for a single Lockman Hole pointing as a part
of software testing stage by Konrad Dennerl (see Dennerl et al. (2004) and
epreject task description). For further details of the
noise removal and a discussion of associated uncertainties see epnreject task description. We selected the longest EPIC-pn observation, made
with the “thin” filter and detector full frame mode (for a description
of EPIC-pn see Strüder et al. 2001), which yields 35 ksec of useful exposure. For
purposes of our analysis, a subtraction of out-of-time events (OOTE) is not
necessary, given the position of bright sources with respect to the
superstructure and an orientation of CCDs in the selected observation.
The sensitivity reached by this observation is good enough to set
relatively tight constraints on the presence of diffuse soft X-ray
emission in the region of the Lockman Hole.
The image in the softest available band 0.2–0.4 keV was extracted
and processed through a variable wavelet filter detection algorithm (Vikhlinin et al. 1998)
to identify both point and extended sources
(see Zappacosta et al. 2002, for details).
We set the wavelet peak detection
threshold to , and followed the extension of the detected flux
down to . We performed ten
iterations at wavelet kernel scales ranging from to .
We started from the smallest scale and removed the detected sources
prior to proceeding with the next larger scale.
“Point sources” were identified as sources detected with
kernels of size (central part of the field of view) and (outer
region, where the PSF is larger).
The resulting wavelet map (the sum of all wavelet orders) is
shown in Fig. 4.
Several
point sources are detected as well as a few known clusters. However, we
do not find any evidence for diffuse extended emission down to
a limit of 2 of confidence from the high order wavelet
maps, particularly in the region where the large-scale structure at
z0.78 has been detected.
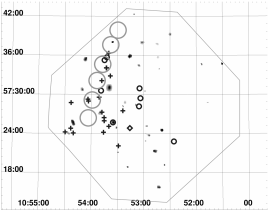
Figure 4: XMM-Newton EPIC-pn wavelet reconstructed image in the
0.2–0.4 keV band. Crosses, small circles and the diamond are the galaxies belonging
to the superstructure detected in optical as in Fig. 3. Big circles are the regions where we measured the
residual soft X-ray flux. The thin line shows the position
of the EPIC-pn camera.
To place limits on the presence of a soft diffuse component associated with
the optical structure, identified above, we have selected a number of
circles along the superstructure traced by galaxies
(see in Fig. 4 the big circles).
We masked out from final
analysis all the parts where X-ray emission has been detected in the 0.5–2
keV and in the 2–7.5 keV bands in the full ksec XMM-Newton
exposure on the
Lockman Hole, obtained with the “medium” filter;
in this way we could remove instrumental
scattering effect, two clusters located near
the superstructure, as well as the
contribution by unresolved AGNs (which have
a much harder spectrum than the WHIM).
We then used the 0.2–0.4 keV band to extract the counts from the
observation with the thin filter. We also selected two
additional regions, closer to the center of the
pointing and at the edge of the CCD to estimate both a level of the
foreground and background emission close to the position of our
measurement and to estimate the possible contribution of the induced
background, as due to the soft protons. To do that, we make a reasonable
assumption, based on our best knowledge,
that the sky components and X-ray foreground
components (such as the Local Hot Bubble, LHB)
have flat distribution on the sky, at least
within the XMM field of view, and thus are
vignetted by the
telescope, while the induced background components have a flat distribution of
their intensity over the detector (e.g. Lumb et al. 2002).
After subtraction of these in-field estimated background components, the
residual soft X-ray flux is , that increases by
after the correction for HI absorption.
This is a very marginal detection
and could be explained by statistical fluctuations around the zero
value. Therefore, we consider such a flux as an upper limit to the soft
diffuse X-ray emission in this region.
It should be noted that the Lockman Hole is the
clearest window for this kind of X–ray studies, being the region with the lowest
Galactic hydrogen column density. This means that a superstructure, as
the one we have found in optical, should clearly show X–ray
diffuse emission due to the collapsed gas in the dark matter potential
well traced by the galaxies, unless the gas temperature is very low.
This issue will be discussed more in detail in the next section.
4 Temperature of the WHIM at z0.8
In this section we discuss the upper limit obtained for the diffuse
X-ray emission and estimate whether it is compatible with the
predictions of the cosmological models and/or constraints on the latter can
be inferred.
In the local universe () various detections of emission by WHIM
indicate temperatures ranging from 1 keV down to about
0.2 keV
(Wang et al. 1997; Zappacosta et al. 2002, 2004; Sołtan et al. 2002; Kaastra et al. 2003; Finoguenov et al. 2003). The lower
temperature limit could be ascribed to observational issues, since the
bulk of the emission from gas with the temperatures below 0.1 keV
is absorbed even in regions of low Galactic . Moreover, low
Oxygen abundance characteristic of
the WHIM (Cen & Ostriker 1999; Finoguenov et al. 2003)
precludes WHIM detection through the OVII emission
lines. The situation
will change, however, with advent of microcalorimeters with ’large grasp’.
The alternative technique
of using the OVII and OVIII X-ray absorption
lines allowed the detection of Local WHIM at much lower temperatures
(Nicastro et al. 2002). For a homogeneous comparison, here
we focus on the properties of the WHIM detected in emission.
We take as a reference
for the local universe the WHIM emission from the Sculptor
supercluster (z=0.1)
reported in Zappacosta et al. (2004). In this region the median temperature
detected for the WHIM is about T0.4 keV (extending up to 0.5 keV
and also to 0.3 keV). The minimum average WHIM emission (i.e. assuming
the maximum possible subtraction of the LHB contribution) is
in the
0.14–0.28 keV ROSAT band, corresponding to a flux
.
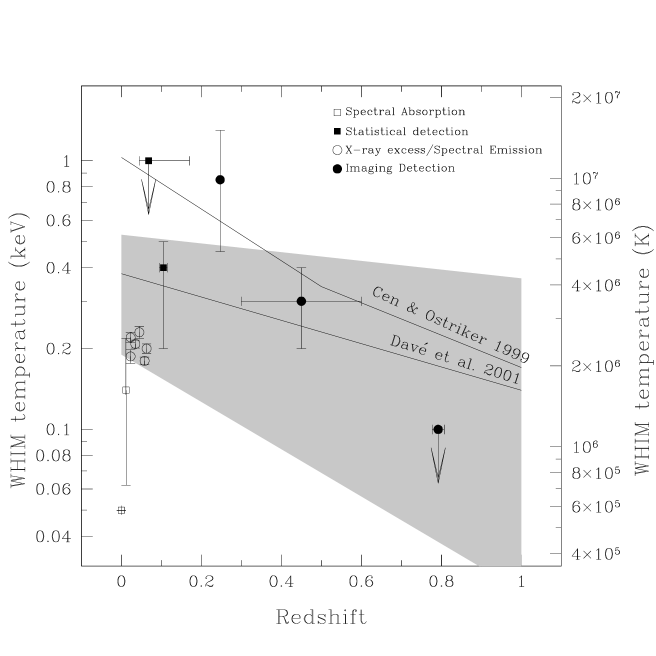
Figure 5:
Observed WHIM temperatures as a function of the redshift taken from the
reference reported in Table 2. The solid lines
are the predictions of equation 4 in Cen & Ostriker (1999) and
Davé et al. (2001). The shaded region shows the interval of
temperatures which includes
50% of the WHIM as
reported in Fig. 5 of Davé et al. (2001).
We assume that these values are roughly representative of the emission
by WHIM in the superstructures of the local universe, however we will
show that our conclusions are not critically dependent on such
assumptions. If we move such
a medium to a redshift of 0.8, in absence of evolution its density
will increase proportionally to (1+z)3 due to the Hubble flow,
and more precisely by a factor [(1+0.8)/(1+0.1)]4.4.
However, we also have to include the intrinsic
density evolution expected for the WHIM. From Davé et al. (2001,
therein Fig. 4) we can estimate that the WHIM at high redshift (z1)
should be denser by a factor of 1.5 than locally444These predictions refer to the bulk of the
WHIM that virtually, having on average
lower densities than the WHIM in supercluster environment,
should not be detectable with the present day instruments. It is possible that the denser WHIM phase in the
supercluster environment evolve in a different way. We are not aware of
theoretical works exploring
the evolution of this dense WHIM phase. .
When combined with the effect of the Hubble flow, the density increases by a factor
.
The thermal emission increases proportionally to , therefore
from z0.1 to z0.8 the WHIM emissivity is expected to
increase by a factor . Since we are observing (or constraining)
the surface brightness, we have also to account for a cosmological dimming
proportional to (1+z)4, i.e. [(1+0.8)/(1+0.1)]7.2.
Assuming that the temperature does not change (our working
hypothesis) the spectral shape remains unchanged, but the redshift
moves the thermal spectrum to lower energies, certainly not enough to
push the thermal cutoff in our 0.2–0.4 keV band, but the consequent
[b]
Table 2: WHIM temperatures (sorted by redsfhift) measured so far with
different methods by various authors.
K–correction still changes the observed flux significantly, and more
specifically by a factor of 1.8. Summarizing all of these effects,
in absence of temperature evolution the surface
brightness expected for WHIM associated with a superstructure at z0.8
relative to a superstructure at z0.1 is
combined with the surface brightness of the WHIM observed in the
Sculptor supercluster, we obtain an expected surface brightness
for the WHIM at z0.8 of
which is roughly an order of magnitude more (more than a factor of 8) than the upper
limit obtained by us for the superstructure in the Lockman Hole.
One possibility could be that filaments are more rare at high
redshift, and that none is present in our field.
However, cosmological simulations predict that filamentary
structures should already be formed by z1, and that super-structures
(traced by overdensity of galaxies) are the locations where filaments
are most likely to be present. Since we are clearly investigating one of
such super-structures (as demonstrated by the galaxy overdensity),
the filaments expected by cosmological models at such redshifts are much
more likely to be present in our region than in the field.
Another, more likely possibility
is that baryonic filaments are indeed present in this large
scale structure, but that their temperature at z0.8
is significantly lower than in the local Universe (z0.1),
making them undetectable.
Indeed a lower temperature moves the thermal cutoff of the spectrum to lower
energies and specifically below the band 0.2-0.4 keV observed by us.
We have calculated that the maximum allowed temperature at
z=0.8, which
would make the observed flux consistent with our upper limit in the
0.2–0.4 keV band, is about 0.07–0.1 keV. It is important to note that this
temperature limit is weakly sensitive on the density and emissivity
assumptions discussed above.
Indeed, the important result is that
the expected flux is so much higher than
our upper limit that the only way out
is to require the temperature
to be low enough to move the thermal cutoff below the
0.2–0.4 keV band.
5 The thermal history of the WHIM
A summary of the constraints on the observed WHIM temperatures
as a function of redshift is given in Fig. 5. We include
results by other works listed in Table 2
(both emission and absorption detections).
The points give either the median value or the best fitting value.
As expected, imaging and statistical measurements, which tend to detect
the brightest WHIM emissions, obtain higher temperature values.
This is a consequence of the WHIM emissivity per
unit energy being proportional to the temperature555
The thermal emissivity per unit energy is
related to the
temperature and the density as (at energies
below the thermal cutoff).
On the other
hand Davé et al. (2001) showed that the
WHIM temperature and density are directly
proportional, and therefore
..
On the contrary, absorption systems sample
random regions of the WHIM, including the very low temperature regions.
Soft excess around clusters also tend to be biased against high
temperatures, because the latter would be confused with the
cluster emission itself. Moreover the WHIM origin of
cluster soft excesses have recently
been partly brought into question by cosmological
simulations (Mittaz et al. 2004; Cheng et al. 2004).
A homogeneous comparison should be limited to detections
(and upper limits) made with the same technique. In this paper
we have searched for WHIM emission, and therefore our upper limit
must be compared with the other detections and upper limits
obtained with imaging or statistical detections of WHIM emission
(full symbols in Fig. 5).
Such
measurements indicate that the observed WHIM temperature decreases with
redshift (Fig. 5), just as predicted by cosmological models.
The number of observational data is small and with large errorbars,
however the plot in Fig. 5 is the first attempt
of constraining the evolution of the WHIM temperature with redshift,
with the currently available data.
It is possible to go beyond this qualitative statement and investigate the
quantitative agreement with the model predictions.
Cen & Ostriker (1999) presented in their paper a simple argument that can reproduce
representative values for the temperature of the WHIM
(see also Fig. 5 in Davé et al. 2001).
They infer the postshock temperature of a cosmic gas collapsing inside
a slightly nonlinear large-scale structure of size L as , where is the gas sound speed and
the Hubble time at the redshift of interest and K is constant
(see equation 4 in Cen & Ostriker 1999).
Such simple estimate is shown to correctly reproduce the
results from numerical simulations (Cen & Ostriker 1999; Davé et al. 2001).
The same approach was used by Davé et al. (2001) who obtain similar
results.
In Fig. 5 we show the trends of the WHIM temperature
as a function of redshift obtained by Cen & Ostriker (1999) and Davé et al. (2001) by using the
argument discussed above (the shaded area indicates the interval
of temperatures which includes 50% of the WHIM in the
Davé et al. (2001) distributions).
Although the uncertainties of the theoretical models are large,
both predictions fit reasonably well the data points, and
in particular the temperatures inferred from the imaging and statistical
methods.
6 Conclusions
We have identified a large-scale structure of galaxies in the Lockman
Hole at redshift z by means of an optical
spectroscopic survey.
The superstructure extends over a
region of more than 7.5 Mpc (in projection) and is structured
in three sub-concentrations at median redshifts of 0.776, 0.784 and
0.806. In this superstructure the WHIM
predicted by cosmological models should have already formed.
By analysing ROSAT and XMM pointings we could set a tight upper
limit on the WHIM emission associated with the superstructure.
From this flux limit we could estimate
an upper limit of 0.1 keV on the WHIM
temperature at z0.8.
The combination of this tight upper limit with other previous WHIM temperature
measurements (at lower redshifts) strongly suggests that the
WHIM temperature must be rapidly decreasing with redshift,
as expected by the cosmological models.
The agreement of the redshift distribution of the
observed WHIM temperatures with the cosmological
predictions (Cen & Ostriker 1999; Davé et al. 2001) is
reasonably good even from a quantitative point of view.
However further work is required to improve the statistics
on the WHIM temperature measurements (or constraints)
at high redshift.
Acknowledgements.
The paper is based on observations obtained with XMM-Newton, an ESA
science mission with instruments and contributions directly funded by
ESA Member States and the USA (NASA). The XMM-Newton project is
supported by the Bundesministerium für Bildung und
Forschung/Deutsches Zentrum für Luft- und Raumfahrt (BMFT/DLR),
the Max-Planck Society and the Heidenhain-Stiftung, and also by PPARC,
CEA, CNES, and ASI. This work was partially supported by the Italian
Ministry of Research (MIUR) and by the Italian Institute of
Astrophysics (INAF). We thank G. Hasinger, H. Boehringer, X. Barcons
and A. Fabian for letting us to use the Lockman Hole image to remove
point source contamination and Konrad Dennerl for his assistance with
XMM data analysis. AF acknowledges support from BMBF/DLR under grant
50 OR 0207 and MPG.
References
Cen & Ostriker (1999)
Cen, R. & Ostriker, J. P. 1999, ApJ, 514, 1
Cheng et al. (2004)
Cheng, L.-M., Borgani, S., Tozzi, P., et al. 2004, in astro-ph/0409707
Ciliegi et al. (2003)
Ciliegi, P., Zamorani, G., Hasinger, G., et al. 2003, A&A, 398, 901
Davé et al. (2001)
Davé, R., Cen, R., Ostriker, J. P., et al. 2001, ApJ, 552, 473
Dennerl et al. (2004)
Dennerl, K., Aschenbach, B., Briel, U. G., et al. 2004, in
astro-ph/0407637
Fadda et al. (2002)
Fadda, D., Flores, H., Hasinger, G., et al. 2002, A&A, 383, 838
Finoguenov et al. (2003)
Finoguenov, A., Briel, U. G., & Henry, J. P. 2003, A&A, 410, 777
Gilli et al. (2003)
Gilli, R., Cimatti, A., Daddi, E., et al. 2003, ApJ, 592, 721
Hasinger (2003)
Hasinger, G. 2003, in astro-ph/0310804
Hasinger et al. (2001)
Hasinger, G., Altieri, B., Arnaud, M., et al. 2001, A&A, 365, L45
Hasinger et al. (1998a)
Hasinger, G., Burg, R., Giacconi, R., et al. 1998a, A&A,
329, 482
Hasinger et al. (1998b)
Hasinger, G., Giacconi, R., Gunn, J. E., et al. 1998b,
A&A, 340, L27
Kaastra et al. (2003)
Kaastra, J. S., Lieu, R., Tamura, T., Paerels, F. B. S., & den
Herder, J. W. 2003, A&A, 397, 445
Lehmann et al. (2001)
Lehmann, I., Hasinger, G., Schmidt, M., et al. 2001, A&A, 371, 833
Lumb et al. (2002)
Lumb, D. H., Warwick, R. S., Page, M., & De Luca, A. 2002, A&A, 389,
93
Mainieri et al. (2002)
Mainieri, V., Bergeron, J., Hasinger, G., et al. 2002, A&A, 393, 425
Mathur et al. (2003)
Mathur, S., Weinberg, D. H., & Chen, X. 2003, ApJ, 582, 82
Mittaz et al. (2004)
Mittaz, J., Lieu, R., Cen, R., & Bonamente, M. 2004, in
astro-ph/0409661
Nicastro (2003)
Nicastro, F. 2003, in IAU Symposium
Nicastro et al. (2002)
Nicastro, F., Zezas, A., Drake, J., et al. 2002, ApJ, 573, 157
Read & Ponman (2003)
Read, A. M. & Ponman, T. J. 2003, A&A, 409, 395
Sołtan et al. (2002)
Sołtan, A. M., Freyberg, M. J., & Hasinger, G. 2002, A&A, 395, 475
Strüder et al. (2001)
Strüder, L., Briel, U., Dennerl, K., et al. 2001, A&A, 365, L18
Vikhlinin et al. (1998)
Vikhlinin, A., McNamara, B. R., Forman, W., et al. 1998, ApJ, 502, 558
Wang et al. (1997)
Wang, Q. D., Connolly, A., & Brunner, R. 1997, ApJ, 487, L13+
Zappacosta et al. (2004)
Zappacosta, L., Maiolino, R., Mannucci, F., Gilli, R., & Schuecker,
P. 2004, MNRAS accepted, astro-ph/0402575
Zappacosta et al. (2002)
Zappacosta, L., Mannucci, F., Maiolino, R., et al. 2002, A&A, 394, 7