The Kinematics of Thick Disks in External Galaxies
Abstract
We present kinematic measurements of the thick and thin disks in two edge-on galaxies. We have derived stellar rotation curves at and above the galaxies’ midplanes using Ca ii triplet features measured with the GMOS spectrograph on Gemini North. In one galaxy, FGC 1415, the kinematics above the plane show clear rotation that lags that of the midplane by 20-50%, similar to the behavior seen in the Milky Way. However, the kinematics of the second galaxy, FGC 227, are quite different. The rotation above the plane is extremely slow, showing 25% of the rotation speed of the stars at the midplane. We decompose the observed rotation curves into a superposition of thick and thin disk kinematics, using 2-dimensional fits to the galaxy images to determine the fraction of thick disk stars at each position. We find that the thick disk of FGC 1415 rotates at 30-40% of the rotation speed of the thin disk. In contrast, the thick disk of FGC 227 is very likely counter-rotating, if it is rotating at all. These observations are consistent with the velocity dispersion profiles we measure for each galaxy. The detection of counter-rotating thick disks conclusively rules out models where the thick disk forms either during monolithic collapse or from vertical heating of a previous thin disk. Instead, the data strongly support models where the thick disk forms from direct accretion of stars from infalling satellites.
Subject headings:
galaxies: kinematics and dynamics — galaxies: formation — galaxies: structure — galaxies: spiral1. Introduction
Since the discovery of the Milky Way’s thick disk in 1983 (Gilmore & Reid, 1983), there has been a growing body of evidence that the thick disk is a structurally, chemically, and kinematically distinct component of the Galaxy. Structurally, the Milky Way’s thick disk has a significantly larger scale height than the thin disk (for reviews of the thick disk scale height see Reid & Majewski (1993); Buser et al. (1999); Norris (1999) and references therein), and a possibly somewhat longer scale length (Robin et al., 1996; Ojha, 2001; Chen et al., 2001; Larsen & Humphreys, 2003). Chemically, thick disk stars are more metal-poor and older than stars in the thin disk (Reid & Majewski, 1993; Chiba & Beers, 2000). They are also significantly enhanced in -elements, compared to thin disk stars of comparable iron abundance (Prochaska et al., 2000; Tautvaišienė et al., 2001; Bensby et al., 2003; Feltzing et al., 2003; Mishenina et al., 2004; Brewer & Carney, 2004). Kinematically, thick disk stars have both a larger velocity dispersion and slower net rotation than stars in the thin disk (Nissen, 1995; Chiba & Beers, 2000; Gilmore et al., 2002; Soubiran et al., 2003; Parker et al., 2004). All of these facts lead to the conclusion that the thick disk is a relic of the young Galactic disk. As such, it provides an excellent probe of models of disk galaxy formation (see recent reviews by Nissen et al. (2003); Freeman & Bland-Hawthorn (2002)).
Originally detected in S0 galaxies (Burstein, 1979; Tsikoudi, 1979), thick disk components have since been detected in many galaxies, including S0’s (de Grijs & van der Kruit, 1996; de Grijs & Peletier, 1997; Pohlen et al., 2004), Sb’s (van der Kruit, 1984; Shaw & Gilmore, 1989; van Dokkum et al., 1994; Morrison et al., 1997; Wu et al., 2002), and later type galaxies (Abe et al., 1999; Neeser et al., 2002; Yoachim & Dalcanton, 2005). Across all Hubble types, photometric decompositions consistently find that thick disk scale heights are 2-6 times larger than thin disk scale heights and that the thick disks’ scale lengths are slightly larger (Shaw & Gilmore (1989); Wu et al. (2002); Neeser et al. (2002); Pohlen et al. (2004), but see also Abe et al. (1999)).
Thick and thin disks are likely to have distinct formation mechanisms, given the systematic differences between their properties. The structure, dynamics, and chemical abundance of the thin disk strongly suggest that the majority of its stars formed gradually from a rotating disk of high angular momentum gas (Fall & Efstathiou, 1980; Matteucci & Francois, 1989; Chiappini et al., 1997). In contrast, the formation of the thick disk is still poorly understood and is likely to be more complex. The large scale height of the thick disk suggests that its stars were either (1) vertically “heated” from a previously thinner disk (Quinn et al., 1993; Velazquez & White, 1999; Robin et al., 1996; Chen et al., 2001), (2) formed from gas with a large scale height (Eggen et al., 1962; Norris & Ryan, 1991; Burkert et al., 1992; Kroupa, 2002; Fuhrmann, 2004; Gilmore & Wyse, 1986), or (3) directly deposited at large scale heights during the accretion of smaller satellite galaxies (Bekki & Chiba, 2001; Gilmore et al., 2002; Abadi et al., 2003; Martin et al., 2004; Navarro et al., 2004; Brook et al., 2004). Most models of thick disk formation fall into one of these three cases. In the first, the thick disk stars form initially in a thin disk. In the second, they form within the thick disk itself. In the third, they form outside of the Galaxy entirely.
All three of the above scenarios are compatible with the structure of the Milky Way’s thick disk. However, they all imply very different behavior for the early evolution of disk galaxies. The first case would suggest that disks form largely through smooth gas accretion that is occasionally punctuated by minor merging events. The second case would suggest either that disks form primarily through smooth monolithic collapse, with thick disk stars precipitating out of the collapsing gas cloud (Eggen et al., 1962), or that the thick disk forms from a disk of gas that has been energetically heated by star formation (Kroupa, 2002). The third case would suggest that disks can form entirely from merging sub-units, in spite of their highly ordered present day structure. The degeneracies between these models must be broken before the properties of the thick disk can be used as a constraint on theories of galaxy formation.
Past attempts to distinguish among formation models have often relied on the chemical abundances of thick disk stars. The low metallicities of thick disk stars suggest that they formed early in the evolution of the Galaxy. Their -enhancement suggests that the time scale for their formation was sufficiently rapid to suppress iron enrichment by Type Ia supernovae. Unfortunately, the resulting implication that the thick disk formed early and rapidly can be accommodated by all of the possible formation scenarios. Bland-Hawthorn & Freeman (2004) suggest that metallicity measurements of more than stars would be required to definitively constrain the origin of the Milky Way’s thick disk. Metallicities of thick disk stars therefore remain a somewhat weak discriminant among competing models.
In contrast to metallicities, stellar kinematics show more promise for constraining the origin of the thick disk. If the thick disk results from dynamical heating of a young previously thin disk, both components should have similar rotation curves, assuming similar angular momenta for the gas that falls in before and after the heating event. If the thick disk forms from gas as it collapses into the galaxy, then angular momentum conservation requires that the rotation of the thick disk must always lag the rotation of the thin disk, by an amount that depends on the relative scale lengths of the thick and thin disks. Finally, if the thick disk is assembled from stars originally formed in merging satellites, then the relative kinematics of the thick and thin disks are likely to be highly variable.
The rotation of the Milky Way thick disk is marginally consistent with all of these scenarios (Burkert et al., 1992; Robin et al., 1996; Buser et al., 1999; Gilmore et al., 2002; Soubiran et al., 2003). Measurements have consistently shown the Galactic thick disk to be co-rotating with the thin disk, but with modest lag. The exact value of the lag varies by a factor of two depending on the study, ranging from km s-1 (Reid, 1998; Chiba & Beers, 2000) up to km s-1 (Gilmore et al., 2002; Parker et al., 2004). The smaller rotational lags can be easily produced in most thick disk formation models, but the larger lags observed recently are more difficult to explain without satellite accretion. However, rather than ruling out out alternative models, the larger lags are often interpreted as contamination from a single disrupted satellite.
Although data within the Galaxy have not been sufficient to definitively constrain the origin of the thick disk, the Milky Way is only one single case. Instead, measurements of thick disk kinematics in several galaxies are necessary to exploit the full power of kinematic discriminants among formation models. Scenarios involving mergers will naturally lead to much more kinematic variation among the population of thick disks than if thick disks formed during monolithic collapse. Even among merging models, we would expect the relative kinematics of the thick and thin disks to vary more if the thick disk stars are directly accreted than if the thick disk was built from vertically heated thin disk stars. By measuring the relative kinematics of thick and thin disks in a large sample of galaxies, one can therefore discriminate among thick disk formation models far more effectively than by studying the Milky Way alone.
In this paper we present the first results of our on-going study of the kinematic properties of thick disks in a large sample of late-type edge-on galaxies (Dalcanton & Bernstein, 2000, 2002). We have measured of the kinematics of thick and thin disk stars in two edge-on late-type disk galaxies. We first present the sample selection and observations in §2. We then describe the data reduction and extraction of the rotation curves in §3. In §4 we decouple the observed rotation curves to derive the rotation of the thick and thin disks. In §5 we measure radially resolved velocity dispersion profiles above and below the plane. We then discuss the implication of our initial results for models of disk galaxy formation in §6 and summarize our conclusions in §7.
2. Observations
We have carried out long-slit spectroscopic observations of two galaxies drawn from the Dalcanton & Bernstein (2000) sample of edge-on late-type galaxies. The original sample of 49 galaxies was selected from the Flat Galaxy Catalog (Karachentsev et al., 1993) and imaged in , , and (Dalcanton & Bernstein, 2000). Dalcanton & Bernstein (2002) used this imaging to demonstrate the ubiquity of thick disks around late-type galaxies. We have since used two-dimensional decompositions of the galaxy images to measure structural parameters for the thick and thin disks. This decomposition will be presented in detail in a future paper (Yoachim & Dalcanton, 2005), and we now give a brief overview of our decompositions.
When fitting models to our galaxies, we adopt the method of Kregel et al. (2002) and use a Levenberg-Marquardt minimization routine. Each disk is modeled as having a surface brightness
| (1) |
where is a modified Bessel function of the first order, is the edge-on central surface brightness, is the projected radius along the major axis, and is the exponential scale height. We weight individual pixels by the inverse model. This method allows one to fit regions of very low surface brightness without being overly skewed by brighter midplane features. Comparing the formal reduced values of the single disk and two-disk models using an -test (Matthews, 2000), we find that the two-disk models are strongly justified. To derive estimates for our parameter uncertainties, we fit a series of models varying the functional form of the vertical profiles (e.g. sech(), sech) for both the thick and thin disk as well as comparing models which were fitted with the midplane region masked. We estimate our uncertainties by using the full range of convergent values in all the models. Our final fitted parameters and uncertainties are listed in Table 1. Plots of our residuals collapsed along the major axis are shown in Figure 1. Our residuals clearly show that subtracting off a single disk leaves excess flux at high while our preferred models fit well across the full range of latitudes. This procedure is discussed more extensively in Yoachim & Dalcanton (2005).
Columns: (1) Galaxy name from the Flat Galaxy Catalog; (2) Measured Heliocentric recessional velocity; (3) Adopted distance from Karachentsev et al. (2000); (4) 21-cm line width at 50 percent of the peak; (5) Thin disk edge-on -band central surface brightness; (6) Thin disk exponential scale length (Structural parameters taken from Yoachim & Dalcanton (2005)); (7) Thin disk exponential scale height; (8) Thick disk edge-on central surface brightness; (9) Thick disk scale length; (10) Thick disk scale height; (11) Ratio of the thick disk luminosity to the total galaxy luminosity.
| Galaxy | W50/2 | |||||||||
|---|---|---|---|---|---|---|---|---|---|---|
| mag/ | mag/ | |||||||||
| (1) | (2) | (3) | (4) | (5) | (6) | (7) | (8) | (9) | (10) | (11) |
| FGC 227 | 5493 | 6261 | 107 | 21.5 | 10.0 | 1.0 | 22.8 | 9.3 | 2.0 | 0.50 |
| FGC 1415 | 1522 | 2683 | 87 | 20.9 | 14.8 | 1.2 | 22.2 | 20.0 | 3.2 | 0.44 |


To define a sample for measuring the thick disk kinematics, we selected several initial candidates for spectroscopic follow-up. We chose to focus our initial efforts on galaxies with rotation speeds near . These galaxies are rotating fast enough that their kinematics can be measured with moderate resolution spectroscopy. However, they are also low enough mass that they fall below the transition where dust lanes become common (Dalcanton et al., 2004), allowing us to probe their thin disk kinematics and structure more reliably. From the galaxies with , we further restricted our sample to the most nearby, spatially well-resolved galaxies. The resulting sample was then submitted to the NOAO Gemini North observing queue. The choice of the specific galaxies targeted was then left to the Gemini observers, to maximize the chances that one of our targets would be visible at any night during the observing semester. In this paper we present results for the two galaxies that were selected by the Gemini queue – FGC 227 and FGC 1415. The properties of both galaxies are listed in Table 1, details of our observations are listed in Table 2, and images of the galaxies are shown in Figure 2.
| Galaxy | RA | Dec | Slit PA | Offset from midplane | % of Light from | Integration | |
|---|---|---|---|---|---|---|---|
| (J2000) | (J2000) | E of N) | Thick Disk | (minutes) | |||
| FGC 227 | 02:00:56.7 | 19:42:26 | 9 | - | - | 20% | 3x20 |
| FGC 227 | 02:00:56.5 | 19:42:25 | 9 | 3.0 | 1.3 | 50% | 28x20 |
| FGC 1415 | 12:20:27.7 | 01:28:09 | 146 | - | - | 30% | 3x20 |
| FGC 1415 | 12:20:28.0 | 01:28:12 | 146 | 5.4 | 1.0 | 70% | 46x20 |
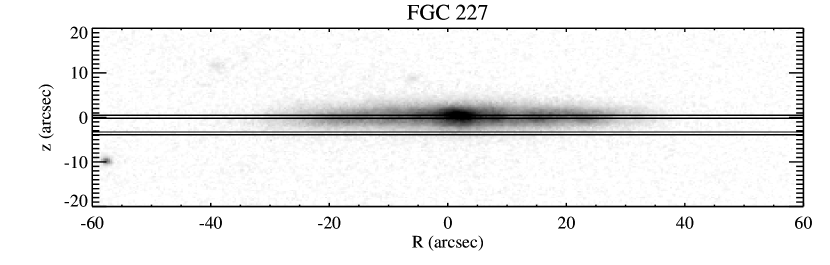
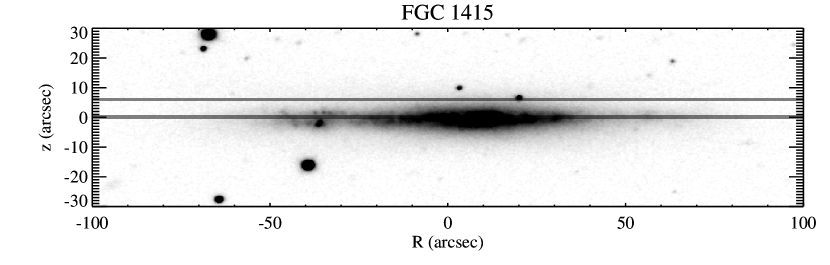
We obtained long-slit spectroscopy of the Ca ii triplet (8498Å, 8542Å, and 8662Å) to measure stellar kinematics. We chose two slit locations for each galaxy, oriented with the slit parallel the major axis of the galaxy. The first slit position was located along the midplane, where the light is dominated by thin disk stars. The second slit position was located 3–4.5 thin disk scale heights above the midplane, where % of the light came from the thick disk, based on the thick and thin disk decompositions of Yoachim & Dalcanton (2005). The locations of the slits are superimposed on the galaxy images shown in Figure 2. Typical surface brightnesses in the midplane and high-latitude slit positions were 21.5 and 23, respectively, in the -band.
The galaxies were observed with the Gemini North GMOS spectrograph using an 0.5 wide slit and the R400-G5305 grating set with a central wavelength of Å. The CCD was binned by 2 in the spatial direction during readout. The resulting spectra have spectral resolution of 3.4Å (FWHM) near the Ca ii triplet region as measured by CuAr arc spectra. This resolution allows lines to be centroided to 10.
Accurate placement of our slit is of great importance because we are combining images taken over several nights. Our offsets from the midplane are relatively small, and an error in placement of order an arcsecond could compromise our results. In our remote observing program, we instructed the Gemini observing specialists to align the slit along the galaxy midplane, after which, a pre-programmed offset iterator would shift the slit to the appropriate off-plane locations. To place the slit, the observing specialist first took an exposure with no dispersion element to locate the galaxy midplane. The longslit was then moved into the light path and another exposure was taken. If the slit did not fall on the galaxy midplane, the telescope was offset to the correct position. Inspecting the returned acquisition images, we find that the observing specialists were able to accurately place the slit along the midplane within arcseconds (1-2 GMOS pixels). Because our spectra are dithered along the slit with offsets of around 5-10 arcseconds, we have checked the overall accuracy of Gemini offset commands and found that they are correct to pixel (0.15 arcseconds). Overall, we find that the slit was always placed within 0.21 of our target position which ensures our target regions were always in the 0.5 slit.
Observations of FGC 227 and FGC 1415 were executed during the spring and fall observing semesters of 2003, respectively. The image quality was in the 70th-85th percentile, corresponding to typical seeing of . Because our galaxies are large (), as are the offsets between the two slit observing positions (), poor seeing has little effect on the resulting spectra. The midplane slit positions were observed with three 20 minute exposures for both galaxies. The thick disk of FGC 1415 was observed in 4620 minute exposures over 9 separate nights, for a total of 15.3 hours. The thick disk of FGC 227 was observed in 2820 minute exposures over 8 separate nights, for a total of 9.3 hours. The spectra were dithered along the slit in a random pattern between exposures, with typical shifts of 5.
3. Data Reduction
The GMOS CCD’s were bias corrected using both bias images and fits to 31 columns of overscan. Flat fielding was performed with the Facility Calibration Unit (FCU) and the twilight sky. FCU flats were interleaved with the science exposures approximately every hour to ensure complete removal of any variation in the CCD fringing pattern. Twilight flats were combined and used to correct for uneven illumination of the CCD.
The spectra were wavelength calibrated using night sky emission lines. We combined the sky line data of Osterbrock et al. (1996) with the IRAF sky line list to construct an atlas of lines (or line blends) that would be bright and centroidable at our instrumental resolution. This procedure yielded lines for chip 2 (containing the Ca ii triplet) and lines for chip 3. We fit the resulting wavelength solution with a 6th degree Chebychev polynomial. RMS errors in wavelength calibration were of order 0.3 Å, or at the wavelengths of interest.
Analysis of the Ca ii triplet absorption line features requires accurate sky subtraction due to the high density of sky lines at long wavelengths. Each column of the wavelength-rectified spectrum was fit with a low order () polynomial in regions uncontaminated by the galaxy. The resulting polynomial was then subtracted from the entire column. Unfortunately, in our deepest off-plane integrations, clear errors in sky-subtraction remain. These errors are quite small (typically only 5% of the sky), and are not noticible in low signal-to-noise images. However, they are a substantial source of uncertainty in the off-plane spectra, where the surface brightness of the galaxy is less than 10% of the sky and only 1% of the brightest skylines. Measurements of an image of the slit suggest that these errors result from small-scale (10%) variations in slit width, that lead to systematic errors when removing extremely bright sky lines. While nod-and-shuffle techniques can greatly reduce this problem, our targets are too large to effectively use this observing mode.
After sky subtraction, frames were corrected for atmospheric extinction. No absolute flux calibration was applied. The spectra were then Doppler corrected to the local standard of rest, spatially aligned, and combined using a sigma-clipping algorithm to eliminate cosmic rays.
Before extracting one-dimensional spectra, we re-binned our galaxy spectra to a scale linear in . Such re-binning allows Doppler velocity shifts to be performed as linear shifts in . The logarithmic bin size was set to 25 km/s in order to preserve the total number of pixels.
Spectra were extracted by summing 30-300 pixels perpendicular to the dispersion direction, corresponding to radial bins of 4-40. We varied the extraction bin size to ensure that each spectra reaches an average signal-to-noise ratio of 10-15 per pixel. In the case of FGC 227’s shallower off-plane observations, we were forced to bin to a lower S/N () to obtain reasonable sampling across the length of the galaxy. Once extracted, the galaxy spectra were normalized by dividing by a low-order polynomial. Error spectra were computed by analyzing regions of blank sky on the reduced images, and are clearly dominated by the sky-subtraction problems discussed above (see Figure 3). In regions where the sky spectra is smooth, our noise spectra closely matches expectations from Poisson statistics and read noise. Columns that showed excessive systematic residuals caused by skylines ( above what would be expected from Poisson noise) were flagged and masked from later analysis.


4. Template Fitting
The spectra of galaxies contain detailed information on their stellar kinematics. Methods to extract this kinematic information include cross-correlating the galaxy spectra with a template star (Simkin, 1974; Tonry & Davis, 1979; Bottema, 1988), or directly fitting a redshifted stellar template (Rix & White, 1992; Kelson et al., 2000; Barth et al., 2002). Direct fitting has the advantage of permitting variable weighting across pixels. We therefore adopt the direct fitting method to allow us to mask bright skylines that overlap some of the Ca ii triplet features. We fit the extracted galaxy spectra with a redshifted and broadened K-giant stellar template in the restframe region of 8480-8700 Å, similar to the methods of Kelson et al. (2000) and Barth et al. (2002). In particular, we construct a model galaxy spectra as
| (2) |
where is the normalized template stellar spectra binned logarithmically in wavelength, z is a redshift, is a Gaussian broadening function, is a low-order polynomial, is a flat continuum, and denotes convolution. The polynomial and flat continuum are used here to correct for any errors made when normalizing the galaxy and template spectra. The order of the polynomial is kept small to ensure that absorption features are not affected. While the broadening function can be used to measure the line-of-sight stellar velocity dispersion, our large radial bins introduce additional broadening into our spectra. We therefore defer an analysis of the stellar velocity dispersion to § 5, and choose to hold the width of the Gaussian broadening function constant during the fits. We find the best-fit redshift and polynomial coefficients simultaneously using a Levenberg-Marquardt routine to minimize :
| (3) |
where is the extracted galaxy spectra and is the weighting derived from the noise spectra with masked columns set to zero weight. Uncertainties were calculated from the covariance matrix and rescaled so that the reduced chi-squared equals unity (i.e., we assume our fits are of good quality). This step is mostly conservative in that it greatly increases error bars on several points and leaves most virtually unchanged. Our rescaling also prevents any residual unmasked systematic errors from the sky subtraction from overly influencing our error spectra and fits. An example spectra and template fit can be seen in Figure 3. The raw extracted rotation curves are presented in Figures 4 and 5.


4.1. Fitting the Rotation Curves
Photometry suggests that our sample galaxies have both a thin and a thick disk, both of which contribute significantly to the measured dynamics at each slit position (Table 2). We now attempt to decouple the kinematics of these two components. We first introduce a convenient analytical equation for the rotation curves:
| (4) |
where is the recessional velocity at the galaxy’s center , is the asymptotic velocity at the flat part of the rotation curve, is the transition radius between rising and flat sections of the rotation curve, governs the degree of sharpness in the transition zone, and is a scaled radial parameter equal to . This equation is equivalent to Courteau (1997)’s Model 2 with the parameter set to zero. This equation is purely phenomenological and is flexible enough to fit a wide variety of rotation curves.
We create model rotation curves at each slit position as follows. We first adopt independent rotation curves for the thick and thin disks, and , using the parameterized rotation curve of equation 4. We then assume our observations are some linear combination of these two rotation curves, i.e., that each velocity measurement is given by
| (5) |
where is the fraction of luminosity from the thick disk at the slit position.
We fix the relative contributions of the thick and thin disks at each slit position using the photometric decompositions from Yoachim & Dalcanton (2005); as described in §2 . We adopt four different possible models, shown in Tables 3 & 4 and Figure 1. The first is our “preferred” model, corresponding to our best fit photometric decomposition. We also include two extreme models, corresponding to the brightest and the faintest thick disks that are compatible with the photometric data. For the “faint thick” model, we assume that the thin disk is larger and brighter, by decreasing and increasing and by their uncertainties, and that the thick disk is smaller and fainter, by adjusting the same parameters in the opposite direction. We then recalculate . For the “bright thick” model, we make the opposite parameter shifts. The “faint thick” and “bright thick” models are truly extreme fits to the photometric data, and result in reduced chi-squared () values that are statistically much worse than the “preferred” models (), particularly for the “faint thick” model. For completeness, we also derive a “simple” model assuming that the midplane and above plane spectra are entirely dominated by the thin and thick disks, respectively. These latter fits are shown in Figure 6. We do not include radial gradients in , because our photometric decompositions suggest the thick and thin disks have comparable scale lengths. Likewise, we neglect seeing, which should have no effect on the midplane value of . Seeing affects the off-plane values only marginally, shifting the value of by , which is an order of magnitude below the range of values we explore.


We bin our model rotation curves using the same bin sizes and flux weighting as our observations. The rotation curve parameters of both disks are then adjusted to minimize , subject to the constraints that both rotation curves have the identical central velocity , that is greater than 0.7, and that the galaxy’s kinematic center is fixed to the flux maximum of the galaxy’s continuum emission. The value of is also constrained to be greater than -200 km s-1 to prevent divergent fits. We therefore have 7 free parameters: , , , , , , and . The best fit values are listed in Tables 3 & 4 along with , which is the total reduced chi-squared for the photometric model plus rotation curve fit. The “faint thick” disk models fail to converge to reasonable values, but we include the fits for completeness. The resulting rotation curve fits are shown in Figures 6, 7 and, 8. For both galaxies, every model has the rotation of the thick disk lagging the thin disk, or even counter-rotating.


We now test the justification for modeling the rotation curve data with two distinct kinematic components. Specifically, we are attempting to rule out the hypothesis that a single underlying rotation curve can explain both the midplane and above plane observations. Using as a measure of goodness-of-fit, we expect the minimized values of to be drawn from a chi-squared distribution for degrees of freedom, where is the number of data points and is the number of adjustable parameters in our fit. We calculate the probability that a value of larger than the one we find should occur by chance. When the midplane and off-midplane are fit with independent rotation curves (the “simple” model), we find =94% for FGC 1415 and 91% for FGC 227, suggesting that this is a very good fit and/or we have overestimated our uncertainties. We then compute the probability that the off-plane observations are described by same simple thin disk rotation curve that fit the midplane, but binned in the same manner as the thick disk observations. This tests if both the midplane and the off-plane observations could be sampling the same underlying rotation curve. We find that the off-plane observations of FGC 1415 have a 24% chance of matching the thin disk rotation curve. For FGC 227, there is only a 4% chance the off-plane observations are fit by the simple thin disk rotation curve111These results explain the failure of the “faint thick” disk models to converge. The “faint thick” disk model assumes that the thin disk dominates the light at both slit positions, which is essentially equivalent to the hypothesis we are ruling out. In such a case, the thick disk is driven to extreme values in order to minimize .. Although these probabilities do not formally eliminate the possibility that the midplane and off-plane observations are due to the same underlying rotation curve, they do suggest that it is highly unlikely. When coupled with the additional facts that our photometric decompositions strongly support two disk components, that there are different colors of the stellar populations at the two slit positions, and that the kinematics of the thick disk and thin disk kinematics in the Milky Way are different, we believe that our assumption of two kinematic components is strongly justified.
A final concern is that our observations could be biased by the effects of dust in the galaxies. Obscuration by dust may systematically reduce the velocities measured near the centers of galaxies, where the optical depth due to dust is largest. These central velocities will be systematically lower due to the failure of observations to penetrate to the center of the disk, allowing only stars with small line-of-sight velocities to contribute to the spectra. The resulting obscured rotation curve would then appear to be that of a rotating ring, and would thus mimic solid-body rotation at the inner radii that are strongly obscured by dust. Kregel et al. (2004) detect just such a signature in longslit spectroscopy of NGC 891, a massive galaxy with a prominent dust lane.
The stronger the extinction caused by dust, the more an observed rotation curve would approach solid-body rotation (Goad & Roberts, 1981). This could be cause for concern as our RC’s are slowly rising and fairly linear. Using Monte Carlo radiative transfer techniques, Matthews & Wood (2001) and Baes et al. (2003) find that realistic optical depths cannot explain the slowly rising rotation curves in edge-on LSB galaxies such as ours, which lack dustlanes and have a very patchy, highly clumped distribution of dust (Dalcanton et al., 2004). Matthews & Wood (2001) conclude that dust can be ignored even at inclinations of in LSB galaxies and Bosma et al. (1992) find that galaxies with rotational velocities km s-1 are transparent at optical wavelengths. Our galaxies are comparable to those in the Matthews & Wood (2001) and Bosma et al. (1992) studies and thus we are confident that our spectra are a true measure of stellar orbits and not an artifact of dust extinction.
There are three additional pieces of evidence suggesting that our results are largely unaffected by dust. First, our galaxies are bluer in their midplanes than above them, indicating that they do not have central dust lanes. Second, our observations show that the off-plane rotation curves are lagging the midplane–the opposite of what we would see if there was a dusty midplane. If dust were affecting the midplane, then the thick disk would be lagging the thin disk by even more than we have reported. Finally, our observations, while not in the far infrared, are red enough ( Å) that we should be able to penetrate the small amount of patchy dust which undoubtedly exists in the galaxies even in the absence of a concentrated dustlane.
| Model | midplane, | off-plane, | ||||||||
|---|---|---|---|---|---|---|---|---|---|---|
| preferred | 0.2 | 0.5 | 5493. | 4.6 | 0.9 | 20. | 1.4 | 111. | -51. | 5.0 |
| faint thick | 0.1 | 0.1 | 5493. | 4.8 | 0.5 | 200. | 207.5 | 87. | -37. | 15.8 |
| bright thick | 0.5 | 0.9 | 5493. | 5.0 | 5.8 | 28. | 10.6 | 145. | 16. | 8.2 |
| simple | 0.0 | 1.0 | 5493. | 5.1 | 7.0 | 176. | 12.0 | 80. | 35. | – |
| Model | midplane, | off-plane, | ||||||||
|---|---|---|---|---|---|---|---|---|---|---|
| preferred | 0.3 | 0.7 | 1522. | 2.8 | 0.8 | 17. | 0.7 | 102. | 28. | 24 |
| faint thick | 0.2 | 0.4 | 1522. | 2.7 | 21.4 | 100. | 15.2 | 97. | -200. | 45 |
| bright thick | 0.4 | 0.9 | 1522. | 2.8 | 2.5 | 21. | 5.8 | 101. | 40. | 26 |
| simple | 0.0 | 1.0 | 1522. | 2.7 | 2.2 | 33. | 13.4 | 77. | 41. | – |
5. Velocity Dispersion
We now turn to an analysis of the line-of-sight velocity dispersion (LOSVD) of our galaxy spectra. While direct fitting returns quality fits for recessional velocities, we find that at low S/N this method fails when adding additional free components, and is thus unable to measure the LOSVD. To measure the LOSVD we have therefore used the updated cross-correlation (XC) method of Statler (1995). This method measures the LOSVD by fitting the peak of a template star-galaxy XC with a broadened stellar autocorrelation function (AXF).
To avoid possible errors from template mismatch, we use two stellar templates, HD4388 (spectral type K3III) and HD213014 (spectral type G9III). Both were observed with GMOS-N for other programs and were downloaded from the Canadian Astronomy Data Centre (CADC) archive222Guest User, Canadian Astronomy Data Centre, which is operated by the Herzberg Institute of Astrophysics, National Research Council of Canada.. The stars were reduced using standard IRAF routines and binned logarithmically in wavelength. Spectra of reference arcs were used to determine the amount of artificial broadening needed to match the resolution of the stellar template to the galaxy spectrum.
Before performing the XC, we performed several pre-processing steps. First, we once again extracted galaxy spectra by summing our reduced 2D image along the spatial direction until adequate S/N was reached (). Next, the galaxy and stellar templates were normalized by dividing by a low-order fit to the continuum, after which the mean was subtracted. The spectra were padded (100 pixels) to eliminate “wrap-around” effects when cross-correlating. Residual low frequency components were removed by tapering the ends of the spectra in the Fourier domain.
The faintness of our off-plane spectra requires that we bin or observations spatially to reach adequate signal-to-noise. However, using such large extraction bins artificially broadens our galaxy spectra by including stars from different parts of the rotation curve. To eliminate this, we first run the XC fitting code to find the recessional velocity along the galaxy. We then shift individual rows of the 2D galaxy spectrum to remove the measured rotation and re-extract 1D spectra. The XC fit is then run again in order to measure the LOSVD. We find no major effects from template mismatch and can use our template stars interchangeably. When fitting for rotation, the two templates return nearly identical results with an RMS spread of 1.2 km s-1 with a maximum of 4 km s-1 difference. Velocity dispersions show a km s-1 systematic difference which is less than the statistical uncertainties and may result from mismatching the dispersions based on reference arc spectra.
We must emphasize that the velocity dispersion measurements are very uncertain, especially for FGC 227. In the direct fitting method, we were able to mask troublesome skylines and use partial sections of the Ca triplet. When using the XC method, masking small sections of spectra can create large changes in the Fourier domain, so we were forced to use only 2 of the 3 Ca absorption features for FGC 227. Therefore, the LOSVD measurements for FGC 227 should be viewed with caution.
The resulting measurements of the line-of-sight velocity and velocity dispersion are shown in Figure 9. The rotation curves from this method confirm the results of our direct fitting method. Both methods show a possible slight lag for the thick disk of FGC 1415 and zero net rotation for the thick disk of FGC 227. The LOSVD measurements of FGC 1415 are similar for the midplane and off-plane, and show a roughly constant velocity dispersion with radius. The midplane of FGC 227 shows a possible increase in the LOSVD with radius. Unfortunately, the off-plane observations of FGC 227 have sufficiently low S/N and high sky-line contamination that the LOSVD measurements have very large error bars. We are therefore unable to detect the increase in velocity dispersion expected for a thick disk which is not supported by rotation. The midplane LOSVD is qualitatively consistent with the presence of a counter rotating thick disk, but the off-plane observations have too low S/N to make firm conclusions.


To understand the radial behavior of the LOSVD, we modeled the velocity fields of two superimposed rotating disks viewed edge-on, corresponding to a thick and thin disk rotating at two different speeds. We have assumed each disk has an intrinsic velocity dispersion of km s-1. We created a series of artificial spectra from a combination of two broadened template stellar spectra with different flux strengths and recessional velocities, and then recovered their LOSVD with our XC procedure. A sample of the resulting LOSVD are plotted in Figure 10. We find that, at our resolution, the XC method is unable to separate the cross-correlation peaks unless the two stellar components have velocity differences km s-1. For a case like FGC 1415, where the thick disk is only mildly lagging the thin disk, we would therefore expect only a slight increase in the observed LOSVD to occur with radius, consistent with the constant LOSVD seen in Figure 9. However, we find that adding a second component at a different velocity can dramatically increase the observed LOSVD if the rotational velocity difference is in the range 90-150 km s-1 and the second component comprises more than 20% of the total flux. For FGC 227 we observe a large increase in velocity dispersion with radius as expected if there is a counter-rotating thick disk present.

6. Discussion
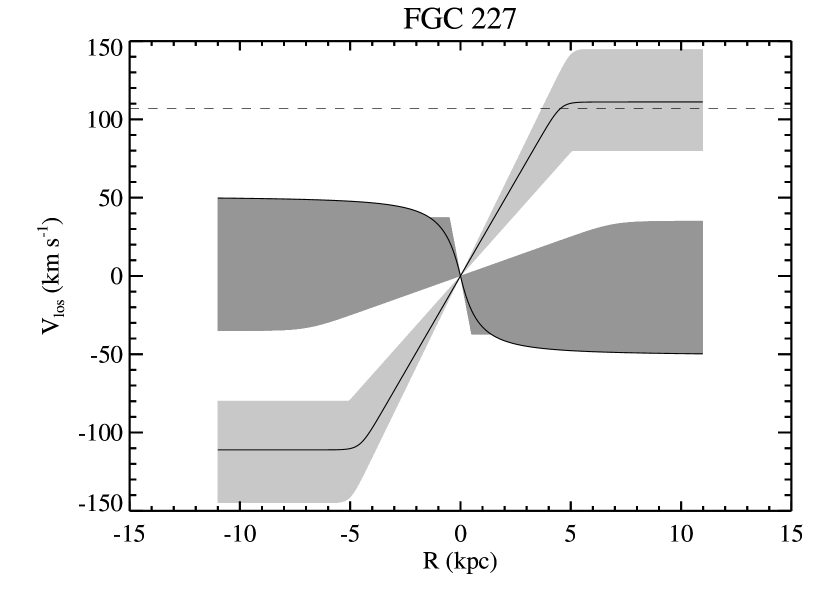
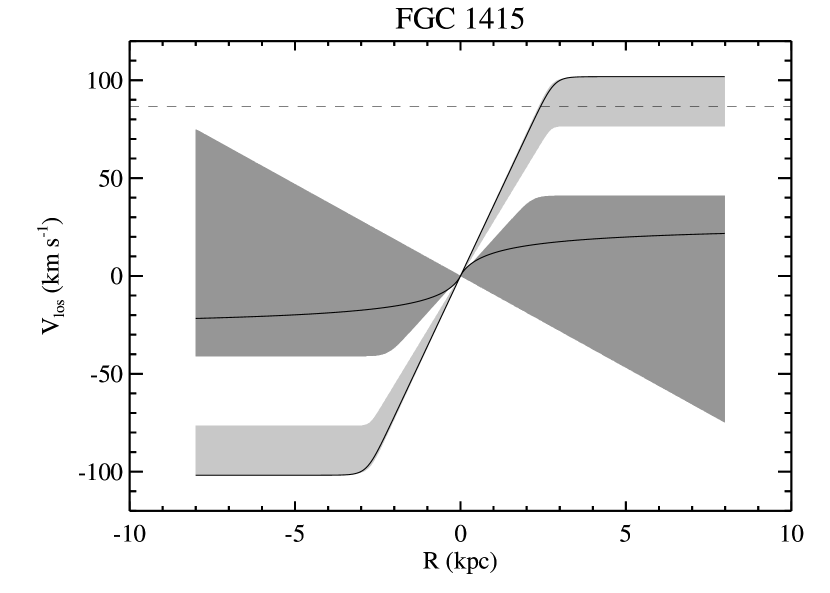
The results of §4 and 5 indicate that the thick disks of FGC 227 and FGC 1415 have very different kinematics. The raw rotation curves in Figures 4 & 5 show that both galaxies appear to be rotating more slowly above the midplane than within it. However, when the thick and thin disk kinematics are decomposed (Figure 8), even stronger differences emerge.
In FGC 1415, the decomposition strongly favors a thick disk that rotates in the same direction as the embedded thin disk, but with a lag of 50% or more. The kinematics of FGC 1415 are therefore fully consistent with those seen in the Milky Way, where the thick disk lags the rotation of the thin disk by up to at large scale heights (Gilmore et al., 2002; Parker et al., 2004). This suggests that any of the theories that can explain the kinematics of the Milky Way’s thick disk can also explain the kinematics of FGC 1415.
The kinematics of FGC 227 are quite different. The very slow rotation above the plane in FGC 227 is due entirely to contamination from the thin disk. Unlike FGC 1415, the thick disk in FGC 227 is counter-rotating, if it is even rotating at all. While monolithic collapse scenarios could potentially explain the rotation of FGC 1415 and the Milky Way’s thick disk, they are unable to explain the slow counter-rotation seen in FGC 227. In such scenarios, the rotational lag between the thick and thin disks arises from the spin up of gas as it collapses into the thin disk while preserving its angular momentum. Thus, the thick and thin disks must always rotate in the same direction, in contrast to the behavior of FGC 227. The data for FGC 227 could marginally accommodate a very slowly co-rotating thick disk, but only if its thick disk formed very early in the collapse process, before the gas had spun up substantially. This would form a thick disk that is substantially thicker and more extended than the thin disk. However, the structure of FGC 227’s and FGC 1415’s thick and thin disks are comparable, ruling out monolithic collapse as a possible explanation.
The data for FGC 227 are also incompatible with models where the thick disk forms via vertical heating of a young thin disk. Simulations show that infalling satellites (Quinn et al., 1993; Walker et al., 1996; Velazquez & White, 1999; Aguerri et al., 2001; Benson et al., 2004) and dark matter halo substructure (Font et al., 2001; Ardi et al., 2003) increase the velocity dispersion of the disk stars, but do not substantially alter their angular momenta. The slowly rotating thick disk of FGC 227 is therefore unlikely to have formed from a rapidly rotating thin disk. Another possibility is that the thick disk formed from a thin disk that was also slowly rotating. Such a disk must have had a much smaller scale length because of its low angular momentum, and thus, the heated thick disk would have a smaller scale length as well. This is in contrast to observations that consistently find large thick disk scale lengths (Wu et al., 2002; Neeser et al., 2002; Yoachim & Dalcanton, 2005; Pohlen et al., 2004). We therefore rule out vertical heating as a plausible mechanism for forming FGC 227’s thick disk. Our conclusions are consistent with those of Pohlen et al. (2004), who performed a very different analysis of thick disk structural parameters in S0 galaxies.
Having ruled out monolithic collapse and vertical heating, the only remaining possibility is that the thick disk formed from direct accretion of stars from satellites. In this scenario, two or more galactic fragments merge together to form the final galaxy. The majority of the stars in the satellites remain in the thick disk, due to their inability to lose kinetic energy and “cool” into a thinner disk. Meanwhile, the gas in the merging satellites collapses further into a rotating disk, converts into stars, and forms the thin disk. The gas in the thin disk may be supplemented at later times by additional gas infall. These “shredded satellites” are becoming popular as explanations for a wide variety of structures in the MW (Navarro et al., 2004; Martin et al., 2004; Parker et al., 2004; Helmi et al., 2003), as well as for low velocity stars at high latitude in the Milky Way thick disk (Gilmore et al., 2002; Soubiran et al., 2003). This class of models can also reproduce the enrichment patterns seen in Milky Way halo stars (Chiba & Beers, 2000; Nissen & Schuster, 1997; Brook et al., 2003; Saleh et al., 2004).
Recently, specific satellite accretion models for the formation of the thick disk have been advocated on the basis of numerical simulations. Abadi et al. (2003) and Brook et al. (2004) both identify thick disk components in galaxies formed in cosmological simulations. The thick disk in Abadi et al. (2003) is composed of stars accreted from merging galactic “sub-units”, while Brook et al. (2004) find that the thick disk stars form during the chaotic merging of gas-rich clumps that produce the disk itself. These new simulations form thick disks through a series of mergers, in contrast to older models that relied on a single final merging event to heat a thin disk into a thick disk (Quinn et al., 1993; Walker et al., 1996; Velazquez & White, 1999). The merging scenario explored by the Abadi et al. (2003) and Brook et al. (2004) simulations may sometimes reproduce the behavior of the older disk heating models, for example, when one massive satellite comes in at late times. However, the newer models provide mechanisms for producing a wider range of thick disk properties. Variations in the orbital properties and gas richness of the merging proto-galactic clumps easily yield variations in the kinematics of the thick disk, as well as its size and its luminosity relative to the thin disk.
For example, satellite merging can readily produce a modest rotational lag for the thick disk. In general, the same satellites produce both the gas that settles into the thin disk and the stars which are left in the thick disk, assuming little subsequent gas accretion. The thin disk and thick disk should therefore show similar angular momentum distributions, but the rotation speed of the gas should be slightly higher, because it has contracted further into the halo. This process naturally leads to a thin disk which rotates more rapidly and has a smaller scale length than the thick disk, as seen in the Milky Way and FGC 1415.
A different combination of orbital parameters and gas richnesses in the merging satellites can also produce the slowly rotating thick disk of FGC 227. If the merging satellites had little net angular momentum (for example, two equal mass satellites orbiting the center of mass in opposite directions), then the stars the satellites deposited in the thick disk would show little net rotation. However, if one of the merging satellites was particularly gas rich, then it alone could provide enough gas to create the rapidly rotating thin disk. This pathway would lead to a rapidly rotating thin disk, a stationary or even counter-rotating thick disk, and comparable scale lengths for the thick and thin disks, exactly as seen in FGC 227. The resulting thick disk would also have a large velocity dispersion, but unfortunately, our data are not sufficient to conclusively demonstrate this for FGC 227.
One possible limitation with the stochastic satellite accretion model is its questionable ability to consistently form highly flattened stellar systems. Our past imaging indicates that late-type disks routinely host flattened thick disks with 5:1 axial ratios (Morrison et al., 1997; Dalcanton & Bernstein, 2002; Neeser et al., 2002; Wu et al., 2002). However, if satellites are accreted from random directions, then there is no a priori reason why the the satellite debris should necessarily be aligned with the embedded thin disk. One would therefore expect to see a significant fraction of galaxies that lack thick disks, but are instead embedded in round stellar halos.
There are several possible resolutions to this problem. The first is that much of the satellite debris that is not aligned with the disk instead becomes identified with the bulge. This may be particularly true when the merging satellites are gas-rich and are on largely radial orbits, leading to centralized bursts of star formation and the formation of a high surface brightness bulge. Any stars formed during the burst, or accreted later, will tend to be identified with the brighter bulge component. However, this potential solution cannot explain why flattened thick disks are seen in bulgeless late-type galaxies.
The second possibility is that the orientation of the angular momentum vector of the accreted thick disk stars may be preferentially aligned with that of the accreted gas that forms the thin disk, even if the amplitude of the angular momentum vectors differ. Abadi et al. (2003) have argued that this alignment naturally arises from the tendency of satellites to travel along filaments, providing a preferred direction for satellite accretion. The alignment also may occur through dynamical friction. Satellites on circular orbits will have longer lifetimes, and will thus be influenced more by dynamical friction. Simulations by Walker et al. (1996) show how a non-planar satellite orbit can be quickly dragged into the plane by dynamical friction in only orbits. The relative contribution of stars from satellites with different orbits in the Abadi et al. (2003) simulations support this picture.
The third possibility is that the tendency to detect flattened thick disks is a selection bias against detecting rounder distributions of satellite debris. If a merging satellite does not happen to be in a coplanar orbit with the thin disk, then it will deposit stars over a larger volume throughout the stellar halo. The resulting distribution of stars will have a much lower surface brightness than if the accreted stars were concentrated near the midplane in a thick disk. This difference naturally biases against detecting a rounder distribution of stellar debris. Wu et al. (2002) may have detected this component in deep intermediate-band imaging of NGC 4565, as may have Zibetti et al. (2004) using stacked images of edge-on galaxies from the Sloan Digital Sky Survey. However, there is a possibility that some of this light is due to the extended light from bulges embedded in the coadded thin disks, so this latter result remains ambiguous. A final possibility is that the surface brightness of any round component will be further reduced by orbital instabilities. Assuming that the potential of most galaxies are triaxial, orbits around the intermediate axes will be unstable. These orbits will tend to reorient around the stable short or long axes, pulling a fraction of the stars back into a coplanar orientation.
7. Conclusion
We have measured the rotation curves and velocity dispersion of stars at and above the midplane of two edge-on galaxies. Comparisons between the two positions indicate that the stars above the plane are significantly lagging the rotation of the stars in the midplane. We have decomposed the observed rotation into two components, corresponding to the thick and thin disks. We find that the rotation speed of the thick disk component is less than 50% of the rotation speed of the thin disk, and is counter-rotating in one of the two cases. We use these observations to conclusively rule out older monolithic collapse or disk heating models for forming all thick disks. We conclude that the only viable mechanism capable of forming counter-rotating thick disks is one where the majority of thick disk stars are directly accreted from merging satellites. Simulations suggest that the early merging required by these models is a generic feature of hierarchical galaxy formation. As such, the models imply that all disk galaxies should host thick disks. This suggests that merger models for the thick disk not only account for the variation in kinematics, but also explains the apparent ubiquity of thick disks around disk galaxies, as argued for by Dalcanton & Bernstein (2002).
We are currently expanding the sample to encompass a wider range of galaxy masses. We will discuss the larger sample and the measured velocity dispersions in a future paper.
References
- Abadi et al. (2003) Abadi, M. G., Navarro, J. F., Steinmetz, M., & Eke, V. R. 2003, ApJ, 597, 21
- Abe et al. (1999) Abe, F., Bond, I. A., Carter, B. S., Dodd, R. J., Fujimoto, M., Hearnshaw, J. B., Honda, M., Jugaku, J., Kabe, S., Kilmartin, P. M., Koribalski, B. S., Kobayashi, M., Masuda, K., Matsubara, Y., Miyamoto, M., Muraki, Y., Nakamura, T., Nankivell, G. R., Noda, S., Pennycook, G. S., Pipe, L. Z., Rattenbury, N. J., Reid, M., Rumsey, N. J., Saito, T., Sato, H., Sato, S., Sekiguchi, M., Sullivan, D. J., Sumi, T., Watase, Y., Yanagisawa, T., Yock, P. C. M., & Yoshizawa, M. 1999, AJ, 118, 261
- Aguerri et al. (2001) Aguerri, J. A. L., Balcells, M., & Peletier, R. F. 2001, A&A, 367, 428
- Ardi et al. (2003) Ardi, E., Tsuchiya, T., & Burkert, A. 2003, ApJ, 596, 204
- Baes et al. (2003) Baes, M., Davies, J. I., Dejonghe, H., Sabatini, S., Roberts, S., Evans, R., Linder, S. M., Smith, R. M., & de Blok, W. J. G. 2003, MNRAS, 343, 1081
- Barth et al. (2002) Barth, A. J., Ho, L. C., & Sargent, W. L. W. 2002, AJ, 124, 2607
- Bekki & Chiba (2001) Bekki, K., & Chiba, M. 2001, ApJ, 558, 666
- Bensby et al. (2003) Bensby, T., Feltzing, S., & Lundström, I. 2003, A&A, 410, 527
- Benson et al. (2004) Benson, A. J., Lacey, C. G., Frenk, C. S., Baugh, C. M., & Cole, S. 2004, MNRAS, 351, 1215
- Bland-Hawthorn & Freeman (2004) Bland-Hawthorn, J., & Freeman, K. C. 2004, Publications of the Astronomical Society of Australia, 21, 110
- Bosma et al. (1992) Bosma, A., Byun, Y., Freeman, K. C., & Athanassoula, E. 1992, ApJ, 400, L21
- Bottema (1988) Bottema, R. 1988, A&A, 197, 105
- Brewer & Carney (2004) Brewer, M., & Carney, B. W. 2004, Publications of the Astronomical Society of Australia, 21, 134
- Brook et al. (2003) Brook, C. B., Kawata, D., Gibson, B. K., & Flynn, C. 2003, ApJ, 585, L125
- Brook et al. (2004) Brook, C. B., Kawata, D., Gibson, B. K., & Freeman, K. C. 2004, ApJ, in press (astro-ph/0405306)
- Burkert et al. (1992) Burkert, A., Truran, J. W., & Hensler, G. 1992, ApJ, 391, 651
- Burstein (1979) Burstein, D. 1979, ApJ, 234, 829
- Buser et al. (1999) Buser, R., Rong, J., & Karaali, S. 1999, A&A, 348, 98
- Chen et al. (2001) Chen, B., Stoughton, C., Smith, J. A., Uomoto, A., Pier, J. R., Yanny, B., Ivezić, Ž., York, D. G., Anderson, J. E., Annis, J., Brinkmann, J., Csabai, I., Fukugita, M., Hindsley, R., Lupton, R., Munn, J. A., & the SDSS Collaboration. 2001, ApJ, 553, 184
- Chiappini et al. (1997) Chiappini, C., Matteucci, F., & Gratton, R. 1997, ApJ, 477, 765
- Chiba & Beers (2000) Chiba, M., & Beers, T. C. 2000, AJ, 119, 2843
- Courteau (1997) Courteau, S. 1997, AJ, 114, 2402
- Dalcanton & Bernstein (2000) Dalcanton, J. J., & Bernstein, R. A. 2000, AJ, 120, 203
- Dalcanton & Bernstein (2002) —. 2002, AJ, 124, 1328
- Dalcanton et al. (2004) Dalcanton, J. J., Yoachim, P., & Bernstein, R. A. 2004, ApJ, 608, 189
- de Grijs & Peletier (1997) de Grijs, R., & Peletier, R. F. 1997, A&A, 320, L21
- de Grijs & van der Kruit (1996) de Grijs, R., & van der Kruit, P. C. 1996, A&AS, 117, 19
- Eggen et al. (1962) Eggen, O. J., Lynden-Bell, D., & Sandage, A. R. 1962, ApJ, 136, 748
- Fall & Efstathiou (1980) Fall, S. M., & Efstathiou, G. 1980, MNRAS, 193, 189
- Feltzing et al. (2003) Feltzing, S., Bensby, T., & Lundström, I. 2003, A&A, 397, L1
- Font et al. (2001) Font, A. S., Navarro, J. F., Stadel, J., & Quinn, T. 2001, ApJ, 563, L1
- Freeman & Bland-Hawthorn (2002) Freeman, K., & Bland-Hawthorn, J. 2002, ARA&A, 40, 487
- Fuhrmann (2004) Fuhrmann, K. 2004, Astronomische Nachrichten, 325, 3
- Gilmore & Reid (1983) Gilmore, G., & Reid, N. 1983, MNRAS, 202, 1025
- Gilmore & Wyse (1986) Gilmore, G., & Wyse, R. F. G. 1986, Nature, 322, 806
- Gilmore et al. (2002) Gilmore, G., Wyse, R. F. G., & Norris, J. E. 2002, ApJ, 574, L39
- Goad & Roberts (1981) Goad, J. W., & Roberts, M. S. 1981, ApJ, 250, 79
- Helmi et al. (2003) Helmi, A., Navarro, J. F., Meza, A., Steinmetz, M., & Eke, V. R. 2003, ApJ, 592, L25
- Karachentsev et al. (2000) Karachentsev, I. D., Karachentseva, V. E., Kudrya, Y. N., Makarov, D. I., & Parnovsky, S. L. 2000, Bull. Special Astrophys. Obs., 50, 5
- Karachentsev et al. (1993) Karachentsev, I. D., Karachentseva, V. E., & Parnovskij, S. L. 1993, Astronomische Nachrichten, 314, 97
- Kelson et al. (2000) Kelson, D. D., Illingworth, G. D., van Dokkum, P. G., & Franx, M. 2000, ApJ, 531, 159
- Kregel et al. (2002) Kregel, M., van der Kruit, P. C., & de Grijs, R. 2002, MNRAS, 334, 646
- Kregel et al. (2004) Kregel, M., van der Kruit, P. C., & Freeman, K. C. 2004, MNRAS, 351, 1247
- Kroupa (2002) Kroupa, P. 2002, MNRAS, 330, 707
- Larsen & Humphreys (2003) Larsen, J. A., & Humphreys, R. M. 2003, AJ, 125, 1958
- Martin et al. (2004) Martin, N. F., Ibata, R. A., Bellazzini, M., Irwin, M. J., Lewis, G. F., & Dehnen, W. 2004, MNRAS, 348, 12
- Matteucci & Francois (1989) Matteucci, F., & Francois, P. 1989, MNRAS, 239, 885
- Matthews (2000) Matthews, L. D. 2000, AJ, 120, 1764
- Matthews & Wood (2001) Matthews, L. D., & Wood, K. 2001, ApJ, 548, 150
- Mishenina et al. (2004) Mishenina, T. V., Soubiran, C., Kovtyukh, V. V., & Korotin, S. A. 2004, A&A, 418, 551
- Morrison et al. (1997) Morrison, H. L., Miller, E. D., Harding, P., Stinebring, D. R., & Boroson, T. A. 1997, AJ, 113, 2061
- Navarro et al. (2004) Navarro, J. F., Helmi, A., & Freeman, K. C. 2004, ApJ, 601, L43
- Neeser et al. (2002) Neeser, M. J., Sackett, P. D., De Marchi, G., & Paresce, F. 2002, A&A, 383, 472
- Nissen (1995) Nissen, P. E. 1995, in IAU Symp. 164: Stellar Populations, 109–+
- Nissen et al. (2003) Nissen, P. E., Chen, Y., Asplund, M., & Max, P. 2003, Elemental Abundances in Old Stars and Damped Lyman- Systems, 25th meeting of the IAU, Joint Discussion 15, 22 July 2003, Sydney, Australia, 15
- Nissen & Schuster (1997) Nissen, P. E., & Schuster, W. J. 1997, A&A, 326, 751
- Norris (1999) Norris, J. E. 1999, Ap&SS, 265, 213
- Norris & Ryan (1991) Norris, J. E., & Ryan, S. G. 1991, ApJ, 380, 403
- Ojha (2001) Ojha, D. K. 2001, MNRAS, 322, 426
- Osterbrock et al. (1996) Osterbrock, D. E., Fulbright, J. P., Martel, A. R., Keane, M. J., Trager, S. C., & Basri, G. 1996, PASP, 108, 277
- Parker et al. (2004) Parker, J. E., Humphreys, R. M., & Beers, T. C. 2004, AJ, 127, 1567
- Pohlen et al. (2004) Pohlen, M., Balcells, M., Lütticke, R., & Dettmar, R.-J. 2004, A&A, 422, 465
- Prochaska et al. (2000) Prochaska, J. X., Naumov, S. O., Carney, B. W., McWilliam, A., & Wolfe, A. M. 2000, AJ, 120, 2513
- Quinn et al. (1993) Quinn, P. J., Hernquist, L., & Fullagar, D. P. 1993, ApJ, 403, 74
- Reid (1998) Reid, N. 1998, AJ, 115, 204
- Reid & Majewski (1993) Reid, N., & Majewski, S. R. 1993, ApJ, 409, 635
- Rix & White (1992) Rix, H., & White, S. D. M. 1992, MNRAS, 254, 389
- Robin et al. (1996) Robin, A. C., Haywood, M., Creze, M., Ojha, D. K., & Bienayme, O. 1996, A&A, 305, 125
- Saleh et al. (2004) Saleh, L., Beers, T. C., & Mathews, G. J. 2004, ApJ, submitted (astro-ph/0407159)
- Shaw & Gilmore (1989) Shaw, M. A., & Gilmore, G. 1989, MNRAS, 237, 903
- Simkin (1974) Simkin, S. M. 1974, A&A, 31, 129
- Soubiran et al. (2003) Soubiran, C., Bienaymé, O., & Siebert, A. 2003, A&A, 398, 141
- Statler (1995) Statler, T. 1995, AJ, 109, 1371
- Tautvaišienė et al. (2001) Tautvaišienė, G., Edvardsson, B., Tuominen, I., & Ilyin, I. 2001, A&A, 380, 578
- Tonry & Davis (1979) Tonry, J., & Davis, M. 1979, AJ, 84, 1511
- Tsikoudi (1979) Tsikoudi, V. 1979, ApJ, 234, 842
- van der Kruit (1984) van der Kruit, P. C. 1984, A&A, 140, 470
- van Dokkum et al. (1994) van Dokkum, P. G., Peletier, R. F., de Grijs, R., & Balcells, M. 1994, A&A, 286, 415
- Velazquez & White (1999) Velazquez, H., & White, S. D. M. 1999, MNRAS, 304, 254
- Walker et al. (1996) Walker, I. R., Mihos, J. C., & Hernquist, L. 1996, ApJ, 460, 121
- Wu et al. (2002) Wu, H., Burstein, D., Deng, Z., Zhou, X., Shang, Z., Zheng, Z., Chen, J., Su, H., Windhorst, R. A., Chen, W., Zou, Z., Xia, X., Jiang, Z., Ma, J., Xue, S., Zhu, J., Cheng, F., Byun, Y., Chen, R., Deng, L., Fan, X., Fang, L., Kong, X., Li, Y., Lin, W., Lu, P., Sun, W., Tsay, W., Xu, W., Yan, H., Zhao, B., & Zheng, Z. 2002, AJ, 123, 1364
- Yoachim & Dalcanton (2005) Yoachim, P., & Dalcanton, J. 2005, in preparation
- Zibetti et al. (2004) Zibetti, S., White, S. D. M., & Brinkmann, J. 2004, MNRAS, 347, 556