On
the evolutionary status of early–type galaxies in
clusters at
– I. The Fundamental Plane222Based on observations collected at the Centro
Astronómico Hispano Alemán (CAHA) at Calar Alto, operated by the
Max-Planck-Institut für Astronomie, Heidelberg, jointly with the
Spanish National Commission for Astronomy.
Abstract
We investigate a spectroscopic sample of 48 early-type galaxies in the rich cluster Abell 2390 at and 48 early-type galaxies from a previously published survey of Abell 2218 at . The spectroscopic data of A 2390 are based on Multi-Object-Spectroscopy with MOSCA at the 3.5-m telescope on Calar Alto Observatory and are complemented by ground-based imaging with the 5.1-m Hale telescope and Hubble Space Telescope (HST) observations in the F555W and F814W filters. Our investigation spans a broad range in luminosity () and a rather wide field-of-view of Mpc2.
Since the A 2218 and A 2390 samples are very similar, we can combine them and analyse a total number of 96 early-type (E+S0) galaxies at . Using the ground-based data only, we construct the Faber–Jackson relation (FJR) for all 96 E+S0 galaxies and detect a modest luminosity evolution with respect to the local reference. The average offset from the local FJR in the Gunn -band is . Similar results are derived for each cluster separately. Less-massive galaxies show a trend for a larger evolution than more-massive galaxies. HST/WFPC2 surface brightness profile fits were used to derive the structural parameters for a sub-sample of 34 E+S0 galaxies. We explore the evolution of the Fundamental Plane (FP) in Gunn , its projections onto the Kormendy relation and the ratios as a function of velocity dispersion. The FP for the cluster galaxies is offset from the local Coma cluster FP. At a fixed effective radius and velocity dispersion our galaxies are brighter than their local counterparts. For the total sample of 34 E+S0 cluster galaxies which enter the FP we deduce only a mild evolution with a zero-point offset of 0.100.06, corresponding to a brightening of 0.310.18m. Elliptical and lenticular galaxies are uniformly distributed along the FP with a similar scatter of 0.1 dex. Within our sample we find little evidence for differences between the populations of elliptical and S0 galaxies. There is a slight trend that lenticulars induce on average a larger evolution of 0.440.18m than ellipticals with 0.020.21m. The ratios of our distant cluster galaxies at are offset by dex compared to those of Coma. Our results can be reconciled with a passive evolution of the stellar populations and a high formation redshift for the bulk of the stars in early-type galaxies. However, our findings are also consistent with the hierarchical formation picture for rich clusters, if ellipticals in clusters had their last major merger at high redshift.
keywords:
galaxies: elliptical and lenticular, cD – galaxies: evolution – galaxies: fundamental parameters – galaxies: kinematics and dynamics – galaxies: clusters: individual: Abell 2218 – galaxies: clusters: individual: Abell 23901 Introduction
Since the first development and application of theoretical galaxy models (e.g., Larson 1975; Toomre 1977) much progress has been achieved to explore the evolution of early–type (E+S0) galaxies. Nevertheless, one of the key questions of early-type galaxy formation and evolution has not been fully answered yet: When and within what time-scales have the stellar populations of early–type galaxies been formed?
In the hierarchical galaxy formation picture the formation histories of early-type galaxies in cluster and low-density environments are significantly different (Baugh, Cole & Frenk 1996; Kauffmann & Charlot 1998). Merging of galaxies and the infall of new cold gas from the galaxy haloes are the main drivers of structure evolution. Clusters are formed out of the highest peaks of primordial density fluctuations and most stars of massive cluster ellipticals are generated at high redshift (), which is in agreement with observational findings (e.g., Ziegler & Bender 1997; van Dokkum et al. 1998). However, explicit age variations between early-type cluster galaxies and E+S0 galaxies in low-density regions are predicted. For clusters, models predict ellipticals to have a mean luminosity-weighted age of 9.6 Gyr and lenticular galaxies to be younger by 1 Gyr (Baugh, Cole & Frenk 1996; Cole et al. 2000). Both types indicate a weak trend that fainter galaxies are older. On the contrary, for early-type galaxies in low-density regions the hierarchical cluster models predict a broader age spread over a larger luminosity range and mean luminosity-weighted ages of 5.5 Gyr.
Numerous observational studies imply four main evidences for a high redshift formation of early-type galaxies: (i) the homogenous stellar populations of E+S0 galaxies seen in tight correlations between colours/absorption line strengths and velocity dispersion and in the Fundamental Plane (FP), which combines kinematics with structural properties, (ii) the [Mg/Fe] overabundance and (iii) the weak evolution in colours and line strengths with redshift.
In the nearby Universe, inconsistent results have been acquired regarding any possible difference between field and cluster galaxies. For example, de Carvalho & Djorgovski (1992) derived from a subset of cluster and field early-type galaxies taken from the “Seven Samurai” group (Faber et al. 1989; Djorgovski & Davis 1987) that field ellipticals show a larger scatter in their properties indicating that they consist of younger stellar populations than cluster galaxies. James & Mobasher (1999) investigated NIR spectra of 50 ellipticals in three nearby clusters and in the field, using the CO (2.3m) absorption feature to explore the presence of an intermediate-age population. They detected no stronger CO absorption for the field ellipticals. Very isolated field ellipticals show a very homogenous population and a small range of metallicity with no sign of recent star formation (SF). In groups, ellipticals have a wide range in metallicity, mostly showing evidence for an intermediate-age population, whereas in rich clusters they exhibit intermediate properties in metallicity and CO absorption. Bernardi et al. (1998) analysed a large sample of ENEAR field and cluster galaxies and found slight zero-point changes in the Mg relation. They explain this as an age difference, with field objects being younger by 1 Gyr. However, they conclude that the bulk of stellar populations of E+S0 in both environments has been formed at high redshifts (). Kuntschner et al. (2002) detected in a sample of nine local early-type galaxies (five morphologically disturbed) in low-density environments (LDR) no strong ongoing SF. The results were compared to cluster E+S0s in Fornax. The ages of the LDR galaxies are spread over a broad distribution, similar to that of Fornax S0 galaxies and being on average younger by 2-3 Gyr than the E+S0s in Fornax. These LDR galaxies indicate 0.2 dex higher metallicities (in conflict with semi-analytical models) than their cluster representatives, which suggests that the formation of E+S0 galaxies in low-densities continues to , whereas in clusters most stars have already been generated at . Recently, Sánchez-Blázquez et al. (2003) studied 98 E+S0 galaxies in the field and in clusters and found higher C4668 and CN2 absorption line strengths for the field population. They interpret this as a difference in abundance ratios arising from different star formation histories. However, both field and cluster E+S0s show similar relations in Mgb and .
At higher redshift differences between field and cluster galaxies should become more apparent. Recent results from investigations based on the Fundamental Plane at intermediate redshift (), indicate no significant variations between the cluster and field early-type populations (van Dokkum et al. 2001; Treu et al. 2001b; Rusin et al. 2003). With respect to the mean age of these populations, field galaxies seem to comprise slightly younger stars than the cluster population, whereas the majority of stars must have formed at a much higher redshift of . However, at higher redshift (), some studies derive a significant offset between field and cluster galaxies (Treu et al. 2002).
Since the last years a multiplicity of investigations of distant rich clusters have been performed (Ellis et al. 1997; Dressler et al. 1997; Stanford et al. 1998; van Dokkum et al. 1998; Kelson et al. 2000b; van Dokkum et al. 2000; Ziegler et al. 2001; Treu et al. 2003; Wuyts et al. 2004). Most of these studies can be reconciled with the picture of a monolithic collapse with a high redshift formation of the stellar populations of E+S0 galaxies. Results from these distant clusters have not found any differences in the properties of E+S0 galaxies (e.g., Kelson et al. 2000b). Recently, in a re-analysis of two high redshift clusters at and no environmental dependence of the FP residuals was detected (Wuyts et al. 2004). When looking at the residuals of the FP, and suggesting that the residuals correlate with environment, it is difficult to distinguish if this effect is due to changes in velocity dispersion, size or luminosity of the galaxies. Selection effects have strong influence on the parameters and can also mimic possible correlations. In a study on 9000 early-type galaxies from the SDSS (Bernardi et al. 2003), a weak correlation between the local density and the residuals from the FP was revealed, in the sense that the residuals in the direction of the effective radii increase slightly as local density increases. However, the offset is quite small and subject to selection and evolutionary effects. The open question still to address is, how this dependence occurs.
Looking at the morphology, the formation and evolution of lenticular galaxies is different and stands in contrast to elliptical galaxies. Deep studies of galaxies in distant rich clusters using the WFPC2 camera onboard the Hubble Space Telescope (HST) revealed that S0 galaxies show a rigorous evolution with redshift in these dense environments (e.g., Dressler et al. 1997). Although S0 galaxies form the dominant population in local rich clusters of 60%, at intermediate redshift () spiral and disturbed galaxies compose the major part of the luminous galaxies, whereas S0 galaxies are less abundant (10–20%). Schade et al. (1999) studied early-type field galaxies at intermediate redshifts () and detected emission lines in about of these galaxies, which indicates ongoing star formation. Furthermore, in about the same fraction of faint spheroidal HDF galaxies significant variations of internal colours were found, frequently showing objects with blue cores (Menanteau et al. 2001). The authors conclude that at about half of the field S0 galaxies show clear signs of star formation activity. Using deep optical and NIR imaging, Smail et al. (2001) revealed differences between more luminous () and less luminous () early-type galaxies in A 2218. The faintest S0s show a wide spread in the colours, and 30 % of these S0s exhibit on average younger ages (2-5 Gyrs).
These results seem to imply that galaxy transformation via interaction is an important phenomenon in clusters. Due to the large velocity dispersion mergers are less frequent in rich clusters, whereas effects such as ram–pressure stripping by the hot intra cluster medium (ICM) or tidal interactions between the galaxies are more likely. A unique mechanism for the transformation into S0 galaxies is still missing to explain the strong decrease in the frequency of S0’s since the last 5 Gyrs (). A possible scenario is that field spiral galaxies falling into the cluster centre experience a starburst phase, resulting in the Butcher–Oemler effect. Ram–pressure stripping by the ICM (also maybe through tidal stripping) over a short time-scale of less than one Gyr, could cause the wide-spread and rapid decline in star formation leading to post–starburst galaxies and red passive spiral galaxies (e.g., Barnes & Hernquist 1992). Harassment by the tidal field of the galaxy cluster and high speed encounters have a non negligible effect on the following passive evolution of a galaxy by removing stars from the disk which may end up in an S0 galaxy (Moore et al. 1996; Poggianti et al. 1999).
In terms of structural parameters, elliptical galaxies comprise not a single homogenous group of galaxies but encompass two different groups, disky and boxy ellipticals (Bender et al. 1988; Bender 1988; Kormendy & Bender 1996). The shape of these galaxies is very important since it correlates with other physical properties, such as luminosity, shape, rotation (axis) and core profile. Recently, the origin of disky and boxy ellipticals was investigated (Naab et al. 1999; Naab & Burkert 2003). Equal-mass mergers result in an anisotropic system with slow major axis rotation and a large amount of minor-axis rotation (boxy elliptical), whereas unequal-mass merger of mass ratio 3 : 1 and 4 : 1 lead to a rotationally supported system with only a small rotation along the minor-axis (disky elliptical). In general, giant high-luminous ellipticals preferably contain boxy isophotes, whereas low-luminous ellipticals comprise a disky structure. Could they maybe have a different evolution? At intermediate redshift we cannot distinguish between disky and boxy galaxies. However, with respect to our large sample we are able separate low from high luminous galaxies and look for possible differences in their evolution. Results of such a comparison would give conclusions if the two types of ellipticals might undergo different formation scenarios.
Cluster environments provide the opportunity to observe a larger number of early-type galaxies with multi-object spectroscopy simultaneously. Furthermore, at a redshift of , the cluster galaxies are bright enough to observe even sub- systems with 4-m class telescopes, while still representing a look-back time of 3 Gyrs, adequate to address evolutionary questions. To look for the environmental dependence, it is desirable to investigate possible radial dependences in age and metallicity of stellar populations with a large sample of early-type galaxies. Therefore, we have undertaken a programme to acquire high-quality spectra of a large number of early-type galaxies in two rich clusters, for Abell 2218 and in the case of Abell 2390, across a wide range in luminosity (down to , with ; corresponding to for ) and a wide field-of-view (10). Each cluster centre has been observed with HST allowing therefore accurate structural parameter determinations. As already demonstrated in Ziegler et al. (2001), both clusters may well serve in the future as suitable benchmarks for the comparison to rich, high redshift clusters, since aperture corrections are less crucial than e.g. to the Coma cluster.
The analysis and results of our study of the cluster A 2218 are discussed in detail in Ziegler et al. (2001) (hereafter Z01). In this article, we present the investigation of A 2390. Combining these two large data samples, a total number of 34 E+S0 galaxies enter the FP, which represents – apart from the study of Kelson et al. (2000b) – the most extensive investigation on early-type cluster galaxies at intermediate redshift. Our study is dedicated to explore intrinsically low-luminosity elliptical and S0 galaxies at redshifts where some evolution is visible and over a wide field-of-view in order to look for environmental variations of the evolution of E+S0 galaxies. Another important aim of this work is also to break the “age-metallicity” degeneracy of early-type galaxies. In a forthcoming paper we will explore the evolution of the A 2390 stellar populations in age, metallicity and abundance ratios by analysing absorption line strengths (e.g., H, Mgb, Fe-indices), and comparing them with stellar population models.
The paper is organised as follows. The photometry on the ground-based images of A 2390 and the HST structural analysis are presented in §2. Spectroscopic observations of the cluster A 2390, the sample selection and reduction of the spectra are described in §3. In §4 the evolutionary status of the rich clusters A 2390 and A 2218 at is illustrated. Results for both clusters derived with scaling relations such as the Faber-Jackson relation and FP and the evolution of the ratio are given in §5. A summary of our results is presented in §6.
In this paper we assume the concordance cosmology for a flat Universe with , and km s-1 Mpc-1. This results for the nearby Coma comparison cluster () in a distance modulus of mag, for the cluster A 2218 () in mag and for A 2390 () in mag, a scale of 3.65 kpc arcsec-1 and a look–back time of Gyrs.
2 Photometry of Abell 2390
2.1 Abell 2390
The cluster Abell 2390 (, ) at , richness class 1, has a large velocity dispersion, km s-1(Carlberg et al., 1996) and a high X-ray luminosity, (0.7–3.5 keV) = 4.7 erg s-1 (Le Borgne et al., 1991). Carlberg et al. (1996) analysed the dynamical state of the cluster and its mass distribution and found a virial radius of Mpc and virial mass of , which makes A 2390 more massive than Coma (). At a constant mean interior density of 200, A 2390 and Coma have -masses of 1.2 and , respectively.
Our study of the early-type galaxy population in A 2390 is based upon Multi-Object Spectroscopy (MOS) using MOSCA (Multi Object Spectrograph for Calar Alto) at the Calar Alto 3.5-m Telescope on Calar Alto Observatory (CAHA) in Spain (see §3). In addition, optical photometry from the 5.1-m Hale telescope at Palomar Observatory is available and we have exploited WFPC2 images taken with HST providing high-quality morphological information for a subset of our sample. Table 1 gives a summary of the obtained observations.
Log of Observations
| Tel. | Instrument | Date | Band (phot) | |
|---|---|---|---|---|
| Mask / | [ksec] | |||
| HALE | COSMIC | 09–12/06/94 | 3.00 | |
| COSMIC | 09–12/06/94 | 0.50 | ||
| COSMIC | 09–12/06/94 | 0.50 | ||
| HST | WFPC | 10/12/94 | F555W | 8.40 |
| WFPC | 10/12/94 | F814W | 10.50 | |
| CA 3.5 | MOSCA | 07–10/09/99 | 1 / 17 | 29.88 |
| MOSCA | 07–10/09/99 | 2 / 22 | 42.12 | |
| MOSCA | 26–28/07/00 | 3 / 24 | 42.48 |
2.2 Ground-based imaging
Abell 2390 was observed at the 5.1-m Hale telescope on Mount Palomar using COSMIC (Carnegie Observatories Spectroscopic Multislit and Imaging Camera) in the (3000 sec), (500 sec) and -band (500 sec), allowing to select early-type galaxies in the full field-of-view of MOSCA due to the nearly equally large field-of-view of COSMIC of . Seeing conditions ranged from 1.4″ in the -band, 1.3″ in the to 1.1″ in the -band (Smail et al. 1998). At mag a completeness level of 80% from a comparison with deeper field counts is warranted. All frames from the ground-based imaging data were reduced in a standard manner with iraf111IRAF is distributed by the National Optical Astronomy Observatories, which are operated by the Association of Universities for Research in Astronomy, Inc., under cooperative agreement with the National Science Foundation. using standard reduction packages.
As a consistency check of our ground-based photometry we compared our photometric data with the results for the cluster A 2390 by Yee et al. (1996) which were derived as part of the CNOC cluster redshift survey. Through a cross-correlation we identified 12 galaxies with spectra which are included in both data sets. After the transformation of our to Gunn magnitudes, we found no significant difference between the magnitudes, mag. In addition, the redshift determinations of all these objects show a very good agreement.
Absolute magnitudes were calculated from our ground-based imaging. Total apparent magnitudes were derived with the Source Extractor package (SExtractor, see Bertin & Arnouts 1996) as given by Mag_BEST. The transformation of the Johnson-Kron-Cousins -band magnitudes to absolute Gunn rest-frame magnitudes was performed in the following way. Synthetic photometry was performed using the observed spectral template for a typical E/S0 galaxy by Kinney et al. (1996) and the synthetic spectral templates by Möller et al. (2001), which were generated with evolutionary synthesis models. The SEDs were redshifted to the cluster redshift of to determine the flux through the filter and at through the Thuan & Gunn (1976) filter. This lead to the transformation . Typical uncertainties in the k-corrections are for the SEDs of both ellipticals and S0 galaxies.
The correction for the Galactic extinction was performed by using the COBE dust maps by Schlegel et al. (1998). For A 2390 an index was determined, resulting in extinction coefficients for the Johnson Cousins filters of A, A and A, respectively. For the HST/WFPC2 F814W filter was derived. The uncertainty in the extinction is .
The total errors in absolute magnitude Gunn , , follow as the linear sum of the errors in the total -band magnitude , the uncertainty in the k-correction and the error in the extinction correction . For our ground-based magnitudes covers the range between , with an average error of .
2.3 Structural parameters
During Cycle 4 A 2390 was observed with the HST222Based on observations made with the NASA/ESA Hubble Space Telescope, obtained at the Space Telescope Science Institute, which is operated by the Association of Universities for Research in Astronomy, Inc., under NASA contract NAS 5–26555. These observations are associated with program # 5352. in the filter F555W () with 8400 sec and in the F814W () with 10500 sec as part of a large gravitational lensing survey. These exposure times are deep enough to determine structural parameters down to 23 mag (Ziegler et al. 1999).
2.3.1 Choice of luminosity profile
A fundamental question when determining the structural parameters of galaxies is what kind of surface brightness profile type is the most suitable. Generally, derivation of total magnitudes involves an extrapolation of curves of growth to infinity, thus relying on fits to the luminosity profiles of the galaxies. For example, Caon et al. (1993) used Sérsic profiles to fit the surface brightness profile of early-type galaxies (see also La Barbera et al. 2002). Another approach is to use the classical de Vaucouleurs () law with an exponential disk component (e.g., Simard et al. 2002; Tran et al. 2003).
Tran et al. (2003) explored the results of three different profile models (double exponential, Sérsic bulge+exponential disk and an bulge+exponential disk) using the GIM2D package (Galaxy Image Two-Dimensional, Simard et al. 2002) on a sample of 155 cluster galaxies in CL 1358+62 at . Based on their extensive profile tests these authors conclude that the de Vaucouleurs bulge with exponential disk profile is the most appropriate way to investigate the structural properties. As our sample comprises only early-type galaxies we use a similar approach, namely a combination of an plus exponential disk profile by Saglia et al. (1997a). These authors demonstrated that the Sérsic profiles can be understood as a “subset” of +exponential models. This algorithm also explores the effect of an efficient sky-subtraction. For example, for large extrapolations are needed which could lead to large errors in the sky-subtraction of up to % and, therefore, to additional uncertainties in the absolute magnitudes and half-light-radii.
2.3.2 The surface brightness models
For analysing structural parameters we use the fitting algorithm developed by Saglia et al. (1997a, 1997b). The galaxies’ parameters are derived searching for the best combination of seeing-convolved, sky-corrected and exponential laws. This approach accounts for various types of observed luminosity profiles, i.e. it models the extended luminosity profiles of cD galaxies and provides fits to the range of profile shapes of early-type galaxies (ellipticals featuring a flat core to S0 galaxies with the presence of a prominent disk).
Subframes of all 14 early-type galaxies both with spectroscopic and HST information (without the cD galaxy) were extracted and each galaxy was analysed individually. In a first step stars and artifacts around the galaxies were masked in order not to cause any problems in the fitting process. In the next step the circularly averaged surface brightness profile of the galaxy was fitted with PSF-convolved and exponential components, both simultaneously and separately (see also Z01 and Fritz et al. 2004). This method allowed to derive the effective (half-light) radius (in arcsec), the total -band magnitude and the mean surface brightness within , , for the entire galaxy as well as the luminosity and scale of the bulge ( and ) and disk ( and ) component separately, within the limitations described by Saglia et al. (1997a).
In total, structural parameters could be determined for 14 galaxies out of 15 for which we also have obtained spectra (see Table 2). In Fig. 11 of the Appendix examples of the surface brightness profile fits are shown. In most cases, the observed profile is best described by a combination of a bulge (de Vaucouleurs law) and a disk component (exponential law). Typical residuals between the observed profile and the fit as a function of are in the order of . Comparing the differences between elliptical and lenticular (S0) galaxies we detect a small disk component for the S0 exhibiting a lens-like structure. For example, the elliptical galaxy # 2438 is well represented by a pure de Vaucouleurs profile. In the case of the S0 galaxy # 2946 a combined model of an -law and an additional disk component results in the best luminosity profile. For the innermost regions (), the model is extrapolated to the calculated central surface brightness of the galaxy.
For some cases (# 2198, # 2438 and # 2763) we do not detect any additional disk component, i.e. a pure classical de Vaucouleurs law profile () results in the best profile for the galaxy’s light distribtuion. Therefore, our approach also allows for the possibility that dynamically hot galaxies may all have profiles. But most of our galaxies are well described by the superposition of bulge and exponential disk profiles. Bulge+disk models provide better fits than a pure law, and the addition of an exponential disk component improves the fit for many of the galaxies. The surface brightness at the half-light radius is a strong function of the chosen fitting profile and the half-light radius is dependent on the assumed surface brightness model. However, the product (with ) provides a Fundamental Plane parameter which is stable for all applied profile types, from to exponential laws (Saglia et al. 1993; Kelson et al. 2000a). Under the constraint of this coupling, galaxies can only move parallel to the edge-on view of the Fundamental Plane.
Some previous Fundamental Plane studies derived their structural parameters with a pure profile. Therefore, we have also tested our results using surface brightness models based on a pure de Vaucouleurs law only. Only systems featuring a dominant disk (Sa bulges) show some deviations. As expected, these galaxies move only along the edge-on projection of the Fundamental Plane. Note, that the errors of the FP parameters of effective radius () and surface brightness () are highly correlated. However, the rms uncertainty in the product which propagates into the FP is only 4 %, corresponding to with and a scatter of the latter relation of 0.05 mag arcsec-2 (Saglia et al. 1993). The results of the structural measurements are presented in Table 3. Fig. 8 shows the Fundamental Plane for A 2218 and A 2390 constructed based on a pure -law profile. The -law structural parameters for A 2218 can be requested from the first author.
| ID | log | h | morp | ||||||||
| [km s-1] | [mag] | [mag/arcsec2] | [mag] | [arcsec] | [kpc] | [arcsec] | [arcsec] | ||||
| (1) | (2) | (3) | (4) | (5) | (6) | (7) | (8) | (9) | (10) | (11) | (12) |
| 2106 | 144.5 | 19.18 | 18.28 | 19.93 | 0.282 | 0.013 | 0.250 | 0.033 | 0.20 | 0.36 | E |
| 2120 | 140.3 | 18.88 | 18.22 | 19.63 | 0.314 | 0.060 | 0.202 | 0.154 | 0.34 | 0.46 | S0 |
| 2138 | 165.4 | 16.97 | 20.60 | 17.72 | 2.264 | 0.918 | 1.324 | 1.800 | 4.48 | 0.36 | E |
| 2180 | 161.2 | 17.80 | 19.49 | 18.55 | 0.928 | 0.530 | 0.580 | 1.195 | 0.88 | 0.60 | S0 |
| 2198 | 148.9 | 18.59 | 17.92 | 19.34 | 0.313 | 0.058 | 0.313 | 0.155 | 0.00 | 0.00 | E |
| 2237 | 162.2 | 17.66 | 19.94 | 18.41 | 1.217 | 0.648 | 1.195 | 1.385 | 0.73 | 0.81 | Sa |
| 2438 | 119.8 | 18.74 | 19.59 | 19.49 | 0.631 | 0.363 | 0.631 | 0.808 | 0.00 | 0.00 | E |
| 2460 | 258.6 | 18.00 | 18.90 | 18.75 | 0.642 | 0.370 | 0.509 | 0.892 | 1.09 | 0.17 | E |
| 2592 | 192.0 | 17.20 | 20.11 | 17.95 | 1.625 | 0.774 | 1.104 | 1.618 | 2.55 | 0.29 | E |
| 2619 | 229.3 | 18.53 | 18.20 | 19.28 | 0.366 | 0.126 | 0.320 | 0.326 | 0.27 | 0.37 | E |
| 2626 | 195.6 | 18.31 | 18.65 | 19.06 | 0.497 | 0.259 | 0.325 | 0.640 | 0.38 | 0.92 | S0 |
| 2763 | 300.5 | 17.55 | 18.89 | 18.30 | 0.789 | 0.460 | 0.789 | 1.108 | 0.00 | 0.00 | E |
| 2946 | 131.9 | 18.69 | 19.26 | 19.44 | 0.554 | 0.306 | 0.405 | 0.708 | 0.60 | 0.34 | S0 |
| 6666 | 211.0 | 17.65 | 18.79 | 18.40 | 0.721 | 0.421 | 0.488 | 1.024 | 1.00 | 0.32 | E/S0 |
| ID | log | |||||||
| [km s-1] | [mag] | [mag/arcsec2] | [mag] | [arcsec] | [kpc] | [arcsec] | ||
| (1) | (2) | (3) | (4) | (5) | (6) | (7) | (8) | (9) |
| 2106 | 131.0 | 19.07 | 18.55 | 19.82 | 0.335 | 0.088 | 0.335 | 0.219 |
| 2120 | 127.2 | 18.75 | 18.51 | 19.50 | 0.382 | 0.145 | 0.382 | 0.363 |
| 2138 | 150.0 | 17.14 | 20.04 | 17.89 | 1.621 | 0.772 | 1.621 | 1.630 |
| 2180 | 146.2 | 17.67 | 19.79 | 18.42 | 1.133 | 0.617 | 1.133 | 1.342 |
| 2198 | 135.0 | 18.59 | 17.92 | 19.34 | 0.313 | 0.058 | 0.313 | 0.155 |
| 2237 | 147.1 | 17.12 | 21.10 | 17.87 | 2.667 | 0.989 | 2.667 | 1.802 |
| 2438 | 108.6 | 18.74 | 19.59 | 19.49 | 0.631 | 0.363 | 0.631 | 0.808 |
| 2460 | 234.5 | 18.01 | 18.86 | 18.76 | 0.628 | 0.361 | 0.628 | 0.872 |
| 2592 | 174.1 | 17.27 | 19.87 | 18.02 | 1.408 | 0.711 | 1.408 | 1.533 |
| 2619 | 207.9 | 18.40 | 18.55 | 19.15 | 0.456 | 0.222 | 0.456 | 0.553 |
| 2626 | 177.4 | 18.01 | 19.29 | 18.76 | 0.768 | 0.448 | 0.768 | 1.033 |
| 2763 | 272.5 | 17.55 | 18.89 | 18.30 | 0.789 | 0.460 | 0.789 | 1.108 |
| 2946 | 119.6 | 18.62 | 19.36 | 19.37 | 0.599 | 0.340 | 0.599 | 0.778 |
| 6666 | 191.3 | 17.65 | 18.74 | 18.40 | 0.701 | 0.408 | 0.701 | 1.000 |
Thumbnail images for the 14 galaxies are provided in the Appendix in Fig. 12. A detailed description of the morphological classification of galaxies residing in the HST field is outlined in the Appendix §A. The final classification is listed in Table 2 and is also given for each galaxy in Fig. 12.
As an additional comparison, we also performed an isophote analysis based on the procedure introduced by Bender & Möllenhoff (1987). Deviations from the elliptical isophotes were recorded as a function of radius by a Fourier decomposition algorithm. The presence and strength of the coefficient, which represents the signature of diskyness, is in good agreement with the visually classified morphologies of S0 and spiral bulges.
2.3.3 Error evaluation
The errors of the photometric parameters of effective radius and surface brightness are correlated and enter the FP in combination. The errors in (in arcseconds) and (in magnitudes) propagate into the FP relationship in the following form (Treu et al. 2001a):
| (1) |
An error calculation with this formula is not an approximation but a particularly robust computation, as in three-dimensional space defined by the FP it is the only natural way to provide an accurate error estimation (see also Saglia et al. 1997a; Kelson et al. 2000a; Treu et al. 2001a for further details). For this reason, we show the errors in the FP only in the edge-on projection along the short axis that separates kinematic measurements and photometric parameters (see upper right panel in Fig. 7). The errors are calculated for the F814W filter with a parameter value of . Since the slope is very well defined with only a small variation with wavelength, the error estimations change negligibly within the observed range of values (Pahre et al. 1998a).
The errors on the derived structural parameters are assigned through a combination of individual quality parameters, including the effects of sky subtraction errors, seeing and pixel sampling, average galaxy surface brightness relative to the sky, variations, extrapolation involved to derive , radial extent of the profile and reduced of the fit resulting in a final global quality parameter. The total quality parameter is defined by the maximum of the quality parameters of individual errors = Max(Qmax, QΓ, QS/N, QSky, QδSky, QE, Q) (Saglia et al. 1997a). For the typical uncertainty in total magnitude is and in effective radius log (%). A value of leads to errors of and log (%), respectively. A quality parameter of ensues errors of and log . For A 2390 we find that 43% (6) of our galaxies have , 57% (8) galaxies have and no galaxy yield a quality parameter of . We estimate the average error in to be 10 % and the error in of %.
Furthermore, we include variations in the zero-point calibration (Saglia et al. 1997b), uncertainty in galactic extinction , as well as errors in the k-correction of . The combination of the uncertainties on the measured parameters [in mag] and [in arcsec] according to equation 1 are listed as . Adding the errors of galactic extinction correction, the k-correction and the errors in zero-point in quadrature ensues the final total error of the FP in the rest-frame Gunn -band, . A summary of our error analysis is given in Table 4.
| ID | ||||
|---|---|---|---|---|
| 2106 | 0.078 | -0.055 | 0.081 | 0.082 |
| 2120 | 0.071 | -0.020 | 0.044 | 0.045 |
| 2138 | 0.136 | 0.124 | 0.080 | 0.081 |
| 2180 | 0.049 | -0.001 | 0.017 | 0.019 |
| 2198 | 0.073 | -0.020 | 0.044 | 0.046 |
| 2237 | 0.076 | 0.050 | 0.025 | 0.027 |
| 2438 | 0.027 | -0.040 | 0.049 | 0.051 |
| 2460 | 0.030 | -0.019 | 0.029 | 0.031 |
| 2592 | 0.105 | 0.094 | 0.059 | 0.061 |
| 2619 | 0.054 | -0.018 | 0.035 | 0.037 |
| 2626 | 0.029 | -0.030 | 0.040 | 0.041 |
| 2763 | 0.032 | -0.004 | 0.015 | 0.016 |
| 2946 | 0.021 | -0.026 | 0.033 | 0.034 |
| 6666 | 0.028 | -0.014 | 0.023 | 0.025 |
2.3.4 Determination of rest-frame surface brightnesses
At the cluster redshift of A 2390, the observed F814W passband is close to rest-frame Gunn . Therefore, it is more promising to use a single k-correction term of the observed to Gunn in rest-frame rather than to take a more complicated way in converting to first and then using a colour transformation. The latter procedure would increase the overall uncertainties.
Analysis of the rest-frame luminosities of the galaxies, was performed in the following way. According to Holtzman et al. (1995), the instrumental magnitude in the F814W filter is given by:
| (2) |
with being the respective gain ratios for the WF chips and the zero-point for an exposure time s. with consideration of the difference between “short” and “long” exposures of 0.05 mag (Hill et al. 1998) and an aperture correction of 0.0983 (Holtzman et al. 1995).
Since we do not have any ground-based colours a similar transformation from Cousins to Gunn following the procedure as in Z01 can not be conducted. Instead, we used the spectral template for a typical E/S0 galaxy by Kinney et al. (1996), redshifting it to the cluster redshift of , to determine the flux through the filter and at through the Thuan & Gunn (1976) filter. This lead to the translation . We checked this result by transforming the synthetic SEDs by Möller et al. (2001), yielding only a slightly higher value of mag.
The mean surface brightness within is defined as:
| (3) |
where the parameter denotes rest frame Gunn magnitude. The dimming due to the expansion of the Universe is corrected by the last term of this equation. Applying the formula in Z01, the mean surface brightness in units of L/pc2 was calculated. Furthermore, the effective radius in kpc was computed for our cosmology with an angular distance of A 2390 of Mpc. For Coma () the angular distance is Mpc.
3 Spectroscopy of Abell 2390
3.1 Sample selection
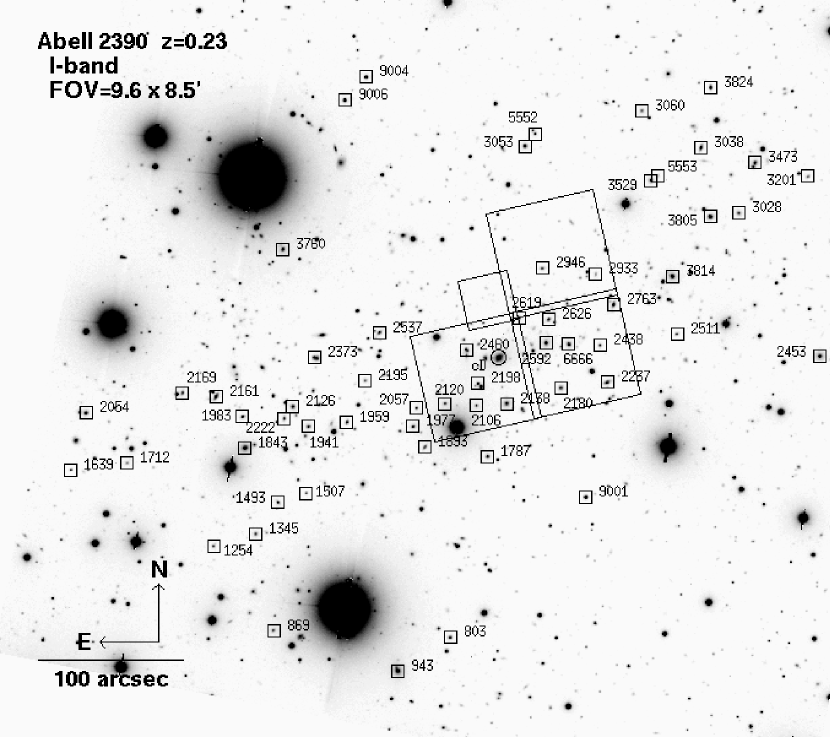
In order to enable a good sky subtraction which requires long slit lengths (with a minimum length of 15′′), each mask was constrained to only about 20 galaxies in total. For this reason, we were very careful to select only galaxies which were likely to be cluster members based upon their broad-band colours. The target objects were selected on the basis of the ground-based -band images and a combination of defined colour regions. Using a similar selection procedure as described in Z01, all galaxies were rejected which were falling outside a defined colour range, restricted to and . This method puts negligible restrictions on the stellar populations of the selected objects, but eliminates the majority of background galaxies. Since our galaxies were distributed over the whole field-of-view (FOV) of 10 (see Fig. 1), corresponding to Mpc2, we can study the evolution of early-type galaxies out to large clustercentric distances.
3.2 Observations
The observations were carried out during two observing runs in four nights of September 7.–11., 1999 and five nights of July 26.–31., 2000. To achieve intermediate resolution spectra for the galaxies in A 2390 at , we chose the grism green 1000 with a typical wavelength range of –7500Å, encompassing important absorption lines such as H, H, Mgb, Fe5270 and Fe5335 at the cluster redshift of . The slit widths were set to 1.5″and the instrumental resolution around H and Mgb ( Å) was 5.5 Å FWHM, corresponding to km s-1. The spatial scale was 0.33″ pixel-1 and seeing conditions varied between .
Three masks were observed with total exposure times between 29880 sec (8.3 hrs) and 42480 sec (11.8 hrs) each (see Table 1). In total, we obtained 63 high-signal-to noise spectra of 52 different galaxies, of which 15 are situated within the HST field. Three objects, # 1507, # 1639 and # 2933, turned out to be background galaxies at , and , respectively; one galaxy (# 3038) is located in the foreground at . We discard these galaxies from our sample yielding a total of 48 different early-type cluster members, proving that our sample selection was highly efficient.
In Fig. 2 the colour-magnitude diagram versus for our 48 early-type cluster members of A 2390 with available spectroscopic information is shown. A least-squares fit to the seven ellipticals in A 2390 gives which is indicated by the solid line in Fig. 2. The outlier object # 2237 with the bluest colour of was classified a spiral Sa galaxy.
3.3 Data reduction
The reduction of the spectra was undertaken using midas333ESO–MIDAS, the European Southern Observatory Munich Image Data Analysis System is developed and maintained by the European Southern Observatory. with own Fortran routines and followed the standard procedure. For each observing run, bias frames were taken at the beginning and end of the night. All frames showed a very stable two–dimensional structure, thus all bias frames from the individual nights were used to generate master biases, one for each observing run. An averaged super bias image was constructed of median–scaled individual bias frames. After calculating the median in the overscan region of the super bias, the super bias frame was scaled to median of each individual bias image. Finally this scaled master bias frame was subtracted from each frame. Variations in the bias level were 5%.
The 2-d images of each slit spectrum were extracted from the MOS frame (after bias subtraction) and reduced individually. Special care was taken in correcting for the S–distortions (curvature) of the spectra, which were strongest when lying closest to the edges of the field. For this purpose a special IRAF program was used which fits a user-defined Legendre polynomial (in most cases of third order) to compute the parameters for the curvature correction. The same set of coefficients were applied to the science, flatfield and corresponding wavelength calibration frames, respectively.
A minimum number of five dome flat–fields were used to construct a master flatfield through a combination of median–averaged single flatfield exposures. After the rectification, the flatfield slit exposures were approximated by a spline function of third degree to the continuum of each spectrum (in dispersion direction) to account for the CCD response curve. The smoothed spline fit was afterwards applied for normalisation of the original flatfield frame in order to correct for pixel-to-pixel variations.
Cosmic ray events were removed very careful by a – clipping algorithm with a pixel filter, taking into account only to eliminate possible artefacts in the spectra. Furthermore, up to five bad columns per slitlet were cleaned by interpolating from unaffected adjacent columns.
The sky background was subtracted by iteratively fitting each CCD column separately through a – clipping algorithm. To ensure consistent profile centers to within at least half a pixel, corresponding to 0.17″, the one-dimensional spectra were extracted for each exposure separately using the Horne–algorithm (Horne, 1986), which optimally weights the extracted profile to maximise the signal-to-noise. Thus, possible shifts of the spectra which may have occurred during different nights are accounted for in the final one-dimensional summed-up spectra.

For the wavelength calibration exposures, the HgAr and Ne lamps were switched on together in order to gain a sufficient number of emission lines over a large range, –7450 Å. A two–dimensional dispersion relation was computed using polynomial fit functions of third and second degree in dispersion and in spatial direction, respectively. Typical r.m.s. errors of the dispersion fit were 0.05-0.06 Å at a stepsize of 1.3 Å per pixel. After the wavelength calibration, individual exposures were summed up and the final one-dimensional spectrum (see Fig. 3) was rebinned to logarithmic wavelength steps in preparation for the determination of the velocity dispersion using the Fourier Correlation Quotient (FCQ) method (Bender 1990) and measurement of absorption line strengths.
In a similar manner, the spectra of standard stars were reduced. Two spectrophotometric flux standards (HZ2 and HZ4) were observed through an acquisition star hole in one mask. For the kinematic templates, three K giant stars (SAO 32042 (K3III), SAO 80333 (K0III), SAO 98087 (K0III)) were observed through a 0.5″longslit using the same grism as for the galaxies. These stars had a spectral resolution at H and Mgb of 2.2 Å FWHM, corresponding to km s-1). To minimise the effect of any possible variation in slit width, the star spectra were averaged over a small number of rows only.

3.3.1 Velocity dispersions
Galaxy velocity dispersions and radial velocities were calculated using an updated version of the FCQ program kindly provided by Prof. R. Bender (Bender 1990). At a redshift of the Mgb line is strongly affected by the telluric emission line at Å. For this reason, two separate wavelength regimes were analysed. The first wavelength range between –6748 Å was centered on the Mgb feature. In those cases where the Mgb line was affected, either in the central or in the adjacent continuum windows, a reliable measurement of the velocity dispersion could not be ensured so that a second calculation in the range around the G4300 band between –5541 Å was performed.
Since the slitlets of the galaxies had small variations in width size and were not identical in width to the longslit of the stars, a simple comparison and interpretation of the calculated velocity dispersions would be wrong. Thus, we applied a correction procedure to the resulting dispersions to correct for this effect. In a first step, the instrumental dispersion was determined by measuring the width of four unblended emission lines around the position of the redshifted Mgb in the respective arc spectrum of a galaxy. Typical instrumental resolutions are in the range of km s-1. The spectra of the stars were broadened to the same resolution (in km s-1) as the galaxies, before using them as templates in the FCQ algorithm to compute the velocity dispersion for each galaxy. This procedure has the advantage that the galaxy velocity dispersion results directly and no additional correction for the velocity dispersion of the template star is needed (see Z01 for an alternative approach). All values of are given in Table 8 together with their corresponding heliocentric radial velocities .
For a total of eight galaxies which are included in two different MOS masks, we are able to confirm the internal reliability of our spectral analysis. The velocity dispersions have been measured for both individual setups and the agreement between these two determinations is good (with a median offset for at the 10 % level). In order to increase the signal-to-noise () in our final spectra, these repeat observations have been co-added. The in the final spectra varies between 21 and 65 with a median value of per Å and a mean value of per Å.
Velocity dispersions were aperture corrected according to the method outlined by Mehlert et al. (2003). This aperture correction is slightly steeper than the one proposed by Jørgensen (1999) (but consistent within the errors). For our measurements this results in corrections for the cluster A 2390 by and the cluster A 2218 by . For A 2390, the aperture radius was taken as the square root of the slit width of times the mean of number of rows over which the spectra were summed up as pixels (corresponding to ). More details on the correction method are described in Z01.
4 Comparison A 2390 versus A 2218
In a recent study, Z01 performed a detailed analysis of a sample of 48 early-type galaxies in the rich cluster A 2218 at a redshift of . Combining this work with our sample of in A 2390 offers the possibility to explore the evolution of 100 early-type galaxies over a large luminosity range and wide field-of-view at similar cosmic epochs. The combined sample allows an extensive investigation of the evolutionary status of galaxies in rich clusters at . A sub-sample with accurate structural parameters provided by HST comprises 34 E+S0 galaxies, splitted into 17 ellipticals (E), 2 E/S0, 9 S0, 3 SB0/a, 2 Sa bulges and 1 Sab spiral bulge that can be investigated in the FP. With this large sample, possible radial and environmental dependences can be explored in detail for the galaxy properties from the cluster centre to the outskirts using the Faber-Jackson relation and for different sub-populations (E/S0 and S0/Sa bulges).
Before the individual galaxies of the two clusters can be combined into one large sample, it has to be proven that both data sets are characterised by very similar properties and that we accounted for possible differences within the sub-samples. For this reason, we compare the cluster galaxies with respect to their luminosity, colour, size and velocity dispersion distributions. Both clusters feature similar global cluster properties (e.g., richness class, -ray luminosity). Furthermore, the sample selection and all observations, especially the spectroscopy, have been carried out in very similar manner. Therefore, we do not expect significant differences between our galaxy samples.
In the subsequent analysis the cluster galaxies are investigated over the same dynamical range in their properties. Therefore, we excluded the two cD galaxies of the cluster A 2218 as no cD galaxy is included in the A 2390 sub-sample. A comparison of the cluster properties in absolute rest-frame Gunn magnitude, effective radius, () rest-frame colour and velocity dispersion (aperture corrected) is presented in Fig. 4. For each set of parameters, the mean values with the resp. scatter are indicated as overlayed Gaussian curves. Overall, the galaxies are similarly distributed in all plots. For the galaxies in A 2218 the range of absolute Gunn magnitudes is , for the objects in A 2390 (upper left panel in Fig. 4) The median value for A 2390 is , mag fainter than the median luminosity for the galaxies in A 2218. For the size distribution we consider only the 32 objects within the HST fields. In the distributions of galaxy size (upper right panel) small (but not significant) differences are visible. The sizes of the A 2218 galaxies cover a range between 0.22 and 0.82 in (kpc), with a median of . The A 2390 sample contains more galaxies with smaller effective radii , with a mean of (and a median of ), resulting in a broader distribution than for A 2218. These galaxies are low-luminosity galaxies. We will address this issue in more detail in the forthcoming section §5.4. The rest-frame colour distributions show no significant differences between the clusters. Using the predictions of passive evolution models by Bruzual & Charlot (1993; GISSEL96 version, hereafter BC96), we corrected for the offset in between the two clusters, which is due to the difference in redshift. The galaxies’ colours in A 2390 cover a range of , in A 2218 . For the A 2390 galaxies we derive a median value of , for the A 2218 objects , respectively. Both are in very good agreement with the typical colour of for ellipticals at , given by Fukugita et al. (1995). The velocity dispersions for the galaxies are equally distributed (lower right panel), with a median value of 165 km s-1 () for A 2390 and 178 km s-1 () for A 2218. As the velocity dispersion is an indicator for the mass of an object and the measured values exhibit similar ranges, we also conclude that there are no significant differences in mean galaxy masses between the two samples (see §5.5 for a further discussion). In addition, we have also compared the scale lengths (), disk-to-bulge ratios () and the surface brightnesses of our member galaxies and again found negligible differences between the distributions.
As a conclusion we detect no significant offset in the distribution of any galaxy parameters between the two samples. Therefore, we conclude that the properties of the galaxies within the two clusters are very homogeneous and thus a combination of the two data sets is adequate, resulting in a final sample of 96 early-type galaxies.

5 Results in A 2390 and A 2218
In all subsequent figures, large symbols denote the distant galaxies of Abell 2218 and Abell 2390, small boxes represent the local reference sample. Morphologically classified lenticular galaxies (S0) or bulges of early-type spiral galaxies (from the A 2218 and A 2390 HST fields) are indicated by open symbols, elliptical galaxies are denoted by filled symbols. Both the distant clusters and the local sample are fitted only within the region shown by horizontal and/or vertical dotted lines in the plots, which represent the selection boundaries for the combined A 2218 and A 2390 data. We compare our cluster sample with the local Coma sample by Jørgensen (1999) and Jørgensen et al. (1995). In order to match the selection boundaries for the distant sample, the Coma galaxies were restricted to and log . Under assumption of a non changing slope, we look at the residuals from the local relation and derive a mean evolution for the distant galaxies444For a comparison of the slope of the local and distant galaxies, we use the bisector method, which is a combination of two least-square fits with the dependent and independent variables interchanged. The errors on the bisector fits were evaluated through a bootstrap resampling of the data 100 times..

5.1 Local comparison sample
The Coma cluster at is one of the best studied local rich clusters. Therefore, it provides a reliable local reference when addressing evolutionary questions. Jørgensen (1999) and Jørgensen et al. (1995) (hereafter collectively J99) performed a detailed study of a large number of early-type Coma galaxies in Gunn -band. The combined sample comprises 115 early-type galaxies, divided into subclasses of 35 E, 55 S0 and 25 intermediate types (E/S0). Absolute magnitudes cover a range down to with a completeness level of 93 %. In oder to match the local J99 sample, the parameters of the distant clusters were aperture corrected (see §3.3). A number of recent works in the literature have analysed the Fundamental Plane (FP) at in the Gunn and compared it to the Coma cluster (e.g., Jørgensen et al. 1999; Z01). In the intermediate redshift range, observations of early-type galaxies are preferably in the or filters. At , the observed and passbands are very close to rest-frame Gunn . Therefore, the advantages of using the Gunn -band instead of the bluer Johnson or bands are the smaller k-corrections and the lower galactic extinction corrections.
5.2 Faber–Jackson relation
A first test of the formation and evolution of elliptical and lenticular galaxies allows the scaling relation between galaxy luminosity and velocity dispersion, the so-called Faber–Jackson relation (Faber & Jackson 1976). In the -band, the luminosity of an object is proportional to the random motion of the stars as .
The Faber–Jackson relation (FJR) in the Gunn -band for 96 distant early-type galaxies in the clusters A 2218 and A 2390, compared to the local Coma sample of J99 is shown in Fig. 5. For the FJR scaling relation, the whole cluster data set can be considered as their magnitudes were measured with SExtractor on the ground-based images. The distant galaxies have velocity dispersions down to 105 km s-1. A bootstrap bisector fit to the restricted Coma reference sample yields:
| (4) |
The observed scatter is . The scatter of the bisector fits to the local FJR is indicated as solid lines in Fig. 5. Fits to the distant sample (within ) are shown as the hashed area. Because of the younger mean ages of the stellar populations, the distant clusters are on average brighter than their local counterparts for a given velocity dispersion. If we assume a formation redshift of for the cluster galaxies, the predictions of single-burst passive evolution models by BC96 (Salpeter IMF with , mass range and burst duration of 1 Gyr) suggest an increase of their Gunn brightness by 0.21 mag at . Assuming that the local slope holds valid for our distant galaxies, we analyse the mean residuals from the local FJR, i.e. the difference in luminosity for each galaxy from the local FJR fit. The scatter of these offsets for the distant galaxies are .
Table 5 lists the derived mean and median luminosity evolution of our early-type cluster galaxies for various samples in the FJR. The final total error in the FJR evolution results from a linear sum of the total error in absolute magnitude (see §2.2) and the error as introduced by the velocity dispersions as , where denotes the mean error in the velocity dispersion (see Appendix §B) and the bisector slope of the A 2218 and A 2390 sub-samples. This error in the mean luminosity evolution is given as the 1 uncertainty in Table 5. For the total sample of 96 galaxies we detect in the FJR a luminosity evolution of . Similar offsets are deduced for each cluster separately. The early-type galaxies in A 2218 show an evolution of , whereas the E+S0 galaxies in A 2390 are brighter by . Both results agree with the BC96 model predictions. Dividing our sample with respect to luminosity at in two groups of equal number, the difference in mean luminosity between lower-luminous and higher-luminous galaxies is negligible. Both sub-samples have a similar slope with an insignificant slope change ().
5.2.1 Mass dependence
As the distant galaxies cover a broad range in velocity dispersions (log ) down to 105 km s-1, it is also possible to explore any evolution in the slope of the FJR. The Coma sample has a steeper slope than that of the distant clusters, with a slope difference of (see Fig. 5). This gives some evidence for a difference between massive and less-massive E+S0 galaxies. Subdividing the total sample with respect to their velocity dispersion at km s-1(log ) into two sub-samples of equal number, the lower-mass objects (log ) show on average a larger evolution with . More massive galaxies (log ) are on average brighter by . Table 5 gives a comparison between the two groups of early-type galaxies. The galaxies with lower and higher mass feature different mean velocity dispersions (log , and 2.34, respectively). For this reason, a two-dimensional Kolmogorov-Smirnov (KS) test is not the appropriate statistical method for a comparison. Instead, we perform bootstrap-bisector fits to the sub-samples which results in different slopes for the low and high mass galaxies. The slope difference between the low-mass galaxies and the high-mass galaxies is , which is significant but depends on the defined selection boundaries for the local Coma reference. However, there remains the trend that less-massive galaxies feature a larger luminosity offset which could be a possible hint for a faster evolution of the low-mass galaxies compared to the more massive counterparts.
5.2.2 Radial dependence
In order to investigate any possible dependence on clustercentric radius within our large data set, we have measured the distance of each galaxy from the brightest cluster galaxy and subdivided the cluster sample into two radial bins of equal size (at kpc), so that they comprise equal numbers of galaxies. The average projected radius for galaxies in the core region is 244 kpc compared to 724 kpc for galaxies in the outer bin. Based on the relation between the virial mass of a cluster and its projected velocity dispersion, the virial radius can be derived as (Girardi et al. 1998), with the projected velocity dispersion given in km s-1. For A 2218, we adopt km s-1(Le Borgne et al. 1992) and for A 2390 Mpc (Carlberg et al. 1996). For our assumed cosmology, this yields to virial radii for the clusters A 2218 and A 2390 of Mpc (1268′′) and Mpc (605′′), respectively.
The mean and median evolution of the E+S0 galaxies for the central and the outer region are shown in Table 5. As the galaxies in the core and outer region feature similar mean velocity dispersions (log , and 2.23, respectively), the two-dimensional KS test provides a good measure of consistency. Applying the KS test results in a probability of that the two distributions are similar. The slope for the galaxies in the core region is similar to the slope derived for the galaxies in the outskirts. Looking at the residuals from the local FJR, here is a slight trend with clustercentric radius, but not significantly (within 1). On average, galaxies in the outskirts of the cluster indicate a larger luminosity offset of than in the core region . However, the offset has only a low significance and its not sure whether this gradient is real or maybe just a projection effect. Our galaxies cover a radial range out to (1.1 Mpc), which is in case of A 2390 roughly the beginning of the transition region that is far from the cluster centre but still within the virial radius of the cluster. Therefore, still many processes are simultaneously at work which could account for this slight observed trend. Futhermore, our sample does not reach the outer districts of the clusters such as the complete transition or periphery zone, where a possible radial gradient with luminosity would be more apparent. We will readdress this issue in our next paper with respect to the line strength measurements for our galaxies.
| Sample | ||||
|---|---|---|---|---|
| A 2218 | 48 | 0.31 | 0.15 | 0.29 |
| A 2390 | 48 | 0.32 | 0.29 | 0.35 |
| A 2218+A 2390 | 96 | 0.32 | 0.22 | 0.35 |
| low massa | 48 | 0.62 | 0.34 | 0.63 |
| high mass | 48 | 0.02 | 0.16 | 0.01 |
| inb | 48 | 0.26 | 0.20 | 0.24 |
| out | 48 | 0.35 | 0.20 | 0.40 |
a less-massive: log , more-massive: log .
b in: only core sample kpc,
out: only outer region sample kpc.

5.3 Kormendy relation
Another useful probe to study the evolution is the Kormendy relation (Kormendy 1977), which is the projection of the FP on the photometric plane. As this relation does not comprise galaxy kinematics, it can be studied to fainter magnitudes and therefore higher redshifts. However, the Kormendy relation samples have larger scatter than in the FP and are more affected by selection biases (Ziegler et al. 1999). Nevertheless, results on the Kormendy relation should complement and endorse findings obtained with the Fundamental Plane. The Kormendy relation (KR) in Gunn for the galaxies in A 2390 and A 2218 is shown in Fig. 6. The structural parameters of effective radius and mean surface brightness within , , are based on curve of growth fits and derived using a combination of disk and bulge surface brightness models. In the upper right corner we show an average error which enters the KR in the coupled form , assuming a typical uncertainty of and . In a similar manner as for the FJR, we compute the luminosity evolution for the distant galaxies in the KR. Within our selection boundaries, a bisector fit to the Coma sample gives:
| (5) |
with an observed scatter of in . The scatter of the bisector fits to the local KR is shown as solid lines in Fig. 6, whereas the bisector fits within to the distant sample are indicated as the hashed area. Again, we assume a constant slope with look–back time for determining the offsets for the distant sample from the local KR. The scatter of these offsets is . Comparing our galaxies within their observed magnitude range () with the restricted Coma KR, we find a larger luminosity evolution as with the FJR. In particular, in the rest-frame Gunn the 34 cluster galaxies are on average brighter by (median value 0.46), compared to Coma. Similar results are obtained using the de Vaucouleurs structural parameters in the KR. The E+S0 galaxies of both clusters show an offset of , with a median of 0.42. Note that, if -law structural parameters are used to construct the KR, individual objects are differently distributed along the KR, whereas the derived average offsets from the local KR give similar results.
5.4 Fundamental Plane
The family of early–type galaxies form a homogenous group regarding to several of their properties. In a three dimensional parameter space, defined by three observables, the effective radius , effective surface brightness within , and velocity dispersion , the Fundamental Plane (FP) establishes a tight correlation (Djorgovski & Davis 1987; Dressler et al. 1987) in the following form:
| (6) |
This empirical relationship relates galaxy structure ( and ) to kinematics ().
In general, FP studies presume that E+S0 galaxies are a homologous group, i.e., that they exhibit a similar structure. Under this assumption the total galaxy mass (including dark matter) is proportional to its virial mass (Treu et al. 2001b). Elliptical galaxies do not fill the FP plane entirely, but rather are restricted to a certain band within it (Guzmán, Lucey & Bower 1993). Different factors account for the precise form of the FP, known as the lack of exact homology of early-type galaxies, e.g., visible in differences in the luminosity profiles or in the dynamical structure (Caon et al. 1993; Graham et al. 1996). Thanks to the small scatter of the local FP of 0.1 dex, the formation and evolution of E+S0 galaxies can be constraint with good precision (e.g., Bender, Burstein & Faber 1992; Pahre et al. 1998a).
The Fundamental Plane in rest-frame Gunn for the distant clusters A 2218 () and A 2390 () is illustrated in Fig. 7. The figure also shows the FP for the local Coma samples of J99 (). All mean surface brightness magnitudes have been corrected for the dimming due to the expansion of the Universe. Errors are provided in the short edge-on FP projection (upper right panel of Fig. 7), with kinematic and photometric properties on separate axes. Following results were derived. Firstly, the FP for both individual galaxy populations as well as for the combined sample show a well-defined, tight relation with a small scatter. Both intermediate redshift clusters show a similar behaviour within and along all projections of the FP. There is no evidence for an increasing scatter with redshift. Jørgensen et al. (1996) found for a sample of 10 local clusters an rms scatter of in log . Our distant cluster galaxies have an rms scatter of , which is not significant higher than the local value. Secondly, only a moderate evolution of the FP and hence the stellar populations of the galaxies with redshift is seen. Assuming there is no evolution in the structure of the galaxies, i.e., at a fixed and , the average brightening of the cluster galaxies can be determined.
The results for the FP in rest-frame Gunn are presented in Table 6. We show the mean and median zero-point offsets from the local Coma FP, their 1 scatter and the derived luminosity evolution. For the combined sample of 34 early-type cluster galaxies we deduce an ZP offset of compared to the local Coma reference, which corresponds to a modest luminosity evolution of mag. Our results are consistent with the picture of simple passive evolution models (e.g., BC96). Assuming a formation redshift of for all stars, for example, these models predict a brightening by mag. For the individual clusters, different results are obtained. A zero-point offset of for A 2390 alone is found, meaning that the early-type galaxies in A 2390 are on average more luminous by mag than the local Coma sample of J99. For the E+S0 in A 2218 we detect an offset of , corresponding to a brightening of the stellar populations by mag. This different result for the clusters may be caused by a combination of two effects: (i) possible effect due to cosmic variance and (ii) sample selection. For example, Jørgensen et al. (1999) have analysed two different clusters (A 665 and A 2218) both at a redshift of and found a slight different evolution of mag. This may give evidence that not all rich clusters have the same FP zero-point offset and that cosmic variance must be accounted for. Another reason may arise from our sample selection. In case of A 2390 particularly fainter galaxies have been selected in order to gain additional insights on the low-mass end of the FP at . For this reason, the A 2390 FP sub-sample comprises more low-luminous galaxies than that of A 2218, which results on average in a stronger luminosity evolution for the A 2390 cluster. Table 6 gives a comparison between the two sub-samples of less and more-massive galaxies and between faint and bright galaxies. If we divide the total sample regarding to velocity dispersion at 192 km s-1(corresponding to log ) into two sub-samples of different mass, we derive a stronger evolution by mag for the low-mass galaxies with respect to their more massive counterparts . Similar results are found when we make a cut in luminosity at , although with a larger scatter. Looking at the thickness of the FP with respect to luminosity, we do not find an increasing scatter for the fainter galaxies within our sample. However, our sub-sample is too small to test the scatter of the FP in greater detail. Jørgensen et al. (1996), for example, divided their local sample with respect to luminosity into faint () and bright galaxies and reported on a larger rms scatter for the lower-luminous galaxies of 0.086. They argued that the larger scatter may be a result of the presence of disks or larger variations in the stellar populations of lower luminosity galaxies. The difference between the lower-luminous and higher luminous galaxies in our sample is also visible in the size distribution of the two samples (Fig. 4) and in the Kormendy relation, with A 2390 containing more galaxies with small sizes and three even with .
| Sample | |||||
|---|---|---|---|---|---|
| A 2218 | 20 | 0.032 | 0.026 | 0.079 | 0.108 |
| A 2390 | 14 | 0.140 | 0.158 | 0.482 | 0.088 |
| A 2218+A 2390 | 34 | 0.076 | 0.100 | 0.305 | 0.113 |
| Ea | 17 | 0.032 | 0.008 | 0.024 | 0.122 |
| S0a | 17 | 0.120 | 0.144 | 0.439 | 0.085 |
| E (pure )b | 17 | 0.032 | -0.010 | -0.030 | 0.125 |
| S0 (pure )b | 17 | 0.115 | 0.134 | 0.409 | 0.079 |
| low lum.c | 17 | 0.085 | 0.100 | 0.305 | 0.114 |
| E | 8 | 0.070 | 0.074 | 0.226 | 0.127 |
| S0 | 9 | 0.098 | 0.122 | 0.372 | 0.107 |
| high lum. | 17 | 0.068 | 0.093 | 0.284 | 0.114 |
| E | 9 | -0.001 | -0.020 | -0.061 | 0.114 |
| S0 | 8 | 0.145 | 0.168 | 0.512 | 0.045 |
| low massd | 17 | 0.129 | 0.153 | 0.466 | 0.106 |
| E | 6 | 0.114 | 0.158 | 0.482 | 0.150 |
| S0 | 11 | 0.138 | 0.153 | 0.466 | 0.080 |
| high mass | 17 | 0.023 | 0.010 | 0.030 | 0.095 |
| E | 11 | -0.012 | -0.015 | -0.046 | 0.081 |
| S0 | 6 | 0.087 | 0.100 | 0.305 | 0.091 |
a based on +exp. disk surface brightness profiles.
b surface brightness profile only.
c lower-luminous: , higher-luminous: .
d less-massive: log , more-massive: log .


5.4.1 Elliptical versus lenticular galaxies
Local investigations based on the Fundamental Plane have not revealed significant differences in the zero-point, slope and/or scatter between elliptical and lenticular galaxies (Bender, Burstein & Faber 1992, 1993; Saglia et al. 1993; Jørgensen et al. 1996). Moreover, they behave very similar as one single group of galaxies with respect to their ratios and within the FP. Going to higher redshifts, differences could be more significant if recent star formation activity plays a role for S0 galaxies. However, previous studies of samples at higher redshift did not find any differences between elliptical and S0 galaxies (van Dokkum & Franx 1996; Kelson et al. 1997; van Dokkum et al. 1998). For example, within the large sample of 30 early-type galaxies in CL 1358+62 at of Kelson et al. (2000b), the 11 ellipticals displayed identical zero-points as the 13 (non–EA) S0 galaxies with no hint for an offset between these groups at all. Moreover, the difference in the slope of 14 % detected between the S0 and elliptical galaxies is not significant.
For the case of S0 galaxies, two main questions are still a matter of debate. How many are a priori S0 galaxies? Which and how many are the result of galaxy transformations and account for the dominant S0 population in rich clusters today? For scenarios which suggest a transformation of star-forming spiral galaxies into passive S0 systems (Dressler et al. 1997; Kodama et al. 2001), these objects can only be classified as lenticular after their morphology has been changed (5 Gyr). However, after this relatively long time-scale, their star formation (SF) could have already been ceased which would make these galaxies hard to detect. EA galaxies could represent galaxies in an intermediate stadium of such a transformation where harassment just has stopped but SF is still present due the result of a starburst which ended within the last 1.5–2 Gyr (Barger et al. 1996). Recently, Yang et al. (2004) performed a study of EA galaxies in the local Universe and argued that these objects only shown an offset in their surface brightnesses but not in their total magnitudes. Such galaxies would be invisible in the FJR but could be revealed within the FP.
Figure 8 illustrates the edge-on view of the FP for 34 E+S0 galaxies of the clusters A 2218 and A 2390 in rest-frame Gunn -band. The FP constructed for the distant clusters at intermediate redshift is compared to the FP for the local Coma sample of J99, indicated by the bisector fit. Our combined sample represents a comparable data set to the study by Kelson et al. (2000b) and hence one of the most extensive investigations of early-type galaxies in clusters at . The Fig. 8 has been splitted in order to visualise the small variations if different luminosity profile fits are used for deriving structural parameters. The left figure displays the FP constructed using a combination of an -lawexponential disk profile, the right figure is based on pure -law fits. The variations in the structural parameters only affect the galaxies to move along the edge-on projection of the FP plane, thereby maintaining the tightness of the plane. As shown by Graham & Colless (1997), both the FP and FP have the same scatter and slope within their errors. A second comparison is given by the FP parameter in Table 2 and Table 3 (column 9). In general, the agreement is good for both elliptical and S0 galaxies.
We will now consider in more detail possible differences between elliptical and lenticular galaxies. As a local reference we adopt the Coma FP coefficients of J99 in the Gunn -band. The choice of the fitting technique, the selection criteria and the measurement errors which are correlated can lead to systematic uncertainties in the FP coefficients in the order of 0.1 dex (Jørgensen et al. 1996; Kelson et al. 2000b). A morphological analysis of the HST images revealed that our A 2390 sub-sample splits nearly equally into elliptical (8) and lenticular (S0) galaxies (6). Both ellipticals and lenticular galaxies are uniformly distributed along the surface of the FP plane. An edge-on projection can therefore be taken for a robust comparison of their stellar populations. Table 6 lists the derived evolution for the E and S0 galaxies. Fixing the slope of the local Coma reference, the zero-point offset for the S0 galaxies in our sample is:
| (7) |
This zero-point offset for lenticular galaxies corresponds to an evolution of mag with respect to the local counterparts. On the other hand, the ZP offset for the ellipticals yields:
| (8) |
Restricting our sample to the elliptical galaxies we derive a negligible zero-point deviation with respect to the local FP, which corresponds to a insignificant luminosity evolution of mag which is within their scatter. For the combined sample of 34 E+S0 cluster galaxies we derive a median offset of:
| (9) |
which corresponds to an brightening of the stellar populations by 0.310.18 mag. On average, the lenticular galaxies in our sample show a larger luminosity evolution than the ellipticals. In both interpretations of Fig. 8 the S0 galaxies are predominantly located below the ellipticals and may indicate a different evolutionary trend between the stellar populations of elliptical and S0 galaxies. Dividing our sample with respect to velocity dispersion into a low mass (log ) and a high mass sub-sample (log ), we find a different evolution. The lower-mass galaxies are on average with more luminous than their more massive counterparts with at . This is also seen for the different sub-groups of elliptical and S0 galaxies, but with less significance (see Table 6).
In conclusion, we derive for the whole sample of 34 E+S0 galaxies only a moderate amount of luminosity evolution. From these results and the previous findings of the FJR and KR, we conclude that at a look-back time of 2.8 Gyrs most early-type galaxies of A 2218 and A 2390 consist of an old stellar population with the bulk of the stars formed at a high formation redshift of about .
5.5 The ratio as diagnostics for stellar populations
Under assumption of homology of the early-type galaxies, the existence of the tight FP implies that the global mass-to-light () ratio of early-type galaxies is related with the mass of an object in the following form (Faber et al. 1987):
| (10) |
The small scatter of 0.10 dex within the FP implies a scatter of only 23% in their ratios.
The evolution of the Fundamental Plane can be characterised in terms of its zero-point. In turn, the zero-point of the FP is related to the mean ratio. Thus, if the FP zero-point for a sample of early-type galaxies changes as a function of redshift , this implies an evolution of the mean ratio and hence an evolution in the luminosity-weighted stellar population properties of the galaxies under consideration.
For the present-day zero-point of the FP we performed a bootstrap bisector fit to the early-type Coma galaxies in rest-frame Gunn -band. This yield a slope of and a zero-point of . The early-type galaxies of A 2390 show a small shift with respect to the Coma galaxies (see Fig. 7). As the velocity dispersions and effective radii of the galaxies in A 2390 span similar ranges like their local counterparts (apart from the Coma cD galaxies with kpc) and the surface brightnesses are slightly increased with respect to the local sample, at least some of the shift in the ratio is due to luminosity evolution. However, when deriving an exact amount of luminosity evolution, one has to be careful as additional combined effects also contribute to the total derived luminosity offset. Some studies found different FP slopes at intermediate redshift compared to the local slope, but they suffer from low number statistics (van Dokkum & Franx 1996; Kelson et al. 1997; van Dokkum et al. 1998). However, more recent investigations based on larger samples reported similarly only a modest change in the FP slope (Kelson et al. 2000b; Treu et al. 2001b; Z01). Thus, the lack of a strong slope change gives evidence against the hypothesis of the FP being solely an age-mass relation. The Fundamental Plane is mainly a relation between the ratio and galaxy mass . Therefore, when comparing small samples with significantly different ranges in galaxy mass, an offset in the ratio can heavily depend on the adopted FP slope. The offset will be a combination of three items: (i) the difference in the slope of the FP, (ii) the mean mass range of the sample and (iii) the ‘true’ offset. By reducing the differences in the mass distribution, the results become insensitive to the adopted slope of the FP and any derived evolution for the distant galaxies is valid for a given range of galaxy masses (Kelson et al. 2000b). For this reason, we have restricted the local Coma sample to a similar mass function as for the galaxies in A 2218 and A 2390.

A comparison of the mass distributions of the distant early-type galaxies of A 2390 and A 2218 with the local Coma galaxies within the plane is shown in Fig. 9. Regions of constant mass, ranging from over down to , derived with the relation in units of (Bender, Burstein & Faber 1992) where is the gravitational constant, are indicated as dashed lines. Both samples exhibit similar ranges in mass () and size (), assuring that a possible evolution will not be driven mainly by any differences between the galaxy mass ranges of the samples.
Adopting a constant slope with redshift, the median zero-point offset for the combined sample of 34 E+S0 cluster galaxies yielded (where the error corresponds to the uncertainty as derived via the bootstrap method). Alternatively using a variable slope in the FP for the distant cluster sample, we find negligible changes in the FP parameters and compared to the locally defined parameters by the Coma data. In particular, a bootstrap bisector fit to all 34 E+S0 cluster gives a slightly steeper slope of and a zero-point offset of , with a 1 confidence level for a slope change. This comparison and the results based on the ratios may give some evidence for a mass-dependent evolution which is stronger for low-mass galaxies.

Fig. 10 shows the observed mass-to-light ratio of the distant clusters A 2218 and A 2390 as a function of velocity dispersion (left) and versus mass (right). We limited the Coma sample to galaxies with log (indicated by the vertical dotted lines in Fig. 10) in order to match the area of parameter space covered by the distant galaxies of A 2390 and A 2218. An analysis based on bootstrap bisector fits to revealed different slopes for the distant (solid lines) and the local (dotted lines) samples. The slope difference between A 2218 and Coma is and an offset in the zero-point of . For A 2390 we detect and . The combined sample of distant clusters has a slope difference of and . We measure with a confidence different slopes for both, the intermediate clusters and the Coma cluster (Coma slope value is ). However, we detect a systematic zero-point offset of the distant relation of , which is not agreement with the proposed change due to passive evolution with (). Ellipticals and S0 galaxies seem to have different slopes changes, with a steeper slope for the elliptical galaxies. Ellipticals: and ; S0s: and .
The ratios as a function of mass are shown in the right plot of Fig. 10. In a similar manner as for the velocity dispersions, the two samples are analysed in terms of bootstrap bisector fits. For the Coma cluster alone we find is . With respect to Coma, the slope difference for A 2218 is with a zero-point offset of . For A 2390 a similar slope change is found , but a larger offset of . The two distant clusters as a whole have and . Dividing the sample into elliptical and S0 galaxies gives no significant slope changes, for Es: and for S0s: . However, the S0s exhibit a larger offset in the zero-point of , compared to the ellipticals .
The correction of the so-called ‘progenitor bias’ (van Dokkum & Franx 2001) for our sample has insignificant influence on the results in the FP and on the ratios (at the evolution in the ratio is underestimated by ). Therefore, we have neglected it. This effect comes into play at a redshift of approximately and has dramatic effect at high redshifts of about .
6 Conclusions
We have investigated the evolution for a total of 96 early-type galaxies in two massive, -ray luminous clusters of galaxies, Abell 2218 () and Abell 2390 (). The data of Abell 2218 was already described in Z01, whereas new kinematics and structural parameters of 48 early-type galaxies in the cluster Abell 2390 are presented. These combined data set represents one of the largest samples at redshift of , ideally suited to study the evolution of early-type cluster galaxies. For the whole sample we have constructed the Faber-Jackson relation (FJR) and for a sub-sample of 34 early-type galaxies, we have explored the evolution of the Fundamental Plane (FP) and Kormendy relation (KR). Our main results are as following:
-
•
In the FJR we find a modest luminosity evolution of the 96 early-type galaxies with respect to the local reference. For the total sample the average offset from the local FJR in the Gunn -band is . Similar findings are obtained if we restrict the sample to the individual clusters. A 2390 has a mean brightening of , A 2218 shows an evolution of . Both results agree with the BC96 model predictions for a passive evolution of the stellar populations assuming a formation redshift of .
-
•
Splitting the total sample of the FJR with respect to velocity dispersion, less-massive galaxies ( km s-1) show a trend for a larger evolution with compared to their more massive counterparts . There is little evidence for a small gradient with clustercentric radius with slightly brighter luminosities for galaxies in the outer regions.
-
•
The 34 early-type cluster galaxies obey a tight Fundamental Plane relation with a small scatter of 0.11 dex at . We find no evidence for an increasing scatter with redshift. For the combined cluster samples we detect a mild luminosity evolution with a zero-point offset of with respect to the local Coma FP relation. The cluster A 2390 alone indicates a larger evolution of . However, this is due to a larger number of low-mass galaxies in the case of A 2390. For A2218 we derive .
-
•
Subdividing our sample in terms of morphology yielded two sub-samples of elliptical (E) and lenticular (S0) galaxies which are equally in size. Ellipticals and S0 galaxies are uniformly distributed along the FP (Fig. 7), with a similar scatter of 0.1 dex. The sub-samples show a median zero-point offset from the local reference of and , respectively. We find little evidence for differences between elliptical and S0 galaxies within our sample. Lenticular galaxies alone induce on average a larger evolution thereby residing a zone in the FP preferably below the ellipticals.
-
•
An analysis of the ratios for the distant galaxies revealed a steeper slope than that of the local counterparts. This effect is weaker than that derived by Jørgensen et al. (1999) for a composite of five intermediate redshift clusters. The sub-samples of ellipticals and S0s appear to have different slopes, with a trend for a steeper slope for the elliptical galaxies (Fig. 10). The ratios as a function of mass indicate no differences in the slopes between elliptical and lenticular galaxies. However, the S0 galaxies feature a larger zero-point offset.
Our results are in good agreement with previous observational studies on rich clusters at intermediate and higher redshifts (Jørgensen et al. 1999; Kelson et al. 2000b; Wuyts et al. 2004). These investigations suggest that the mild luminosity evolution derived for their galaxies is consistent with stellar population models of passive evolution. Assuming a formation redshift of , the BC96 models predict in the Gunn -band a brightening by 0.21 mag at . This is in good agreement with the findings we derive for the FJR and FP. For the cluster A 2390 alone, we detect a larger evolution in the FP and KR. This may be the result of a combination of both cosmic variance and of a larger number of low-luminous galaxies. Our results are consistent with the monolithic collapse scenario and a passive evolution of the stellar populations.
In a forthcoming paper, we will explore the line strengths for our early-type galaxies in order to analyse the stellar populations of the E+S0 cluster galaxies with respect to age, metallicity and abundance ratios. Results of the line indices will be compared to stellar population models and will reveal if there are different sub-populations between elliptical and lenticular galaxies with respect to their age or metallicity of a combination of both properties.
Acknowledgments
We thank the anonymous referee for constructive criticism that improved the clarity of this manuscript. We would like thank Prof. K. J. Fricke for encouragement and support and are grateful to Drs. A. Böhm and A. W. Graham for stimulating discussions and valuable comments. We thank the Calar Alto staff for efficient observational support. AF and BLZ acknowledge financial support by the Volkswagen Foundation (I/76 520) and the Deutsche Forschungsgemeinschaft (ZI 663/1-1, ZI 663/2-1). IRS acknowledges support from the Royal Society and the Leverhulme Trust.
This work is based on observations with the Hale Telescope at Palomar Observatory, which is owned and operated by California Institute of Technology. This research has made use of the NASA/IPAC Extragalactic Database (NED), which is operated by the Jet Propulsion Laboratory, California Institute of Technology, under contract with the National Aeronautics and Space Administration.
References
- Barger et al. (1996) Barger, A. J., Aragon-Salamanca, A., Ellis, R. S., Couch, W. J., Smail, I., Sharples, R. M. 1996, MNRAS, 279, 1
- Barnes & Hernquist (1992) Barnes, J. E., & Hernquist, L. 1992, ARA&A 30, 705
- Baugh, Cole & Frenk (1996) Baugh, C. M., Cole, S., Frenk, C. S. 1996, MNRAS, 283, 1361
- Bender (1988) Bender, R. 1988, A&A, 193, L7
- Bender et al. (1988) Bender, R., Döbereiner, S., & Möllenhoff, C. 1988, A&AS, 74, 385
- Bender & Möllenhoff (1987) Bender, R., Möllenhoff, C. 1987, A&A, 177, 71
- Bender (1990) Bender, R., 1990, A&A, 229, 441
- Bender, Burstein & Faber (1992) Bender, R., Burstein, D., Faber, S. M. 1992, ApJ, 399, 462
- Bender, Burstein & Faber (1993) Bender, R., Burstein, D., Faber, S. M. 1993, ApJ, 411, 153
- Bernardi et al. (1998) Bernardi, M., Renzini, A., da Costa, L. N., Wegner, G., Alonso, M. V., Pellegrini, P. S., Rité, C., Willmer, C. N. A. 1998, ApJ, 508, L143
- Bernardi et al. (2003) Bernardi, M. et al. 2003 AJ, 125, 1866
- Bertin & Arnouts (1996) Bertin, E., Arnouts, S., 1996, A&AS, 117, 393
- Bruzual & Charlot (1993) Bruzual, G. A., Charlot, S. 1993, ApJ, 405, 538
- Caon et al. (1993) Caon, N., Capaccioli, M., D’Onofrio, M. 1993, MNRAS, 265, 1013
- Carlberg et al. (1996) Carlberg, R. G., Yee, H. K. C., Ellingson, E., Abraham, R., Gravel, P., Morris, S., Pritchet, C. J. 1996, ApJ, 462, 32
- Cole et al. (2000) Cole, S., Lacey, C. G., Baugh, C. M., Frenk, C. S. 2000 MNRAS, 319, 168
- de Carvalho & Djorgovski (1992) de Carvalho, R. R., Djorgovski, S. 1992, ApJ, 389, L49
- Djorgovski & Davis (1987) Djorgovski, S., Davis, M. 1987, ApJ, 313, 59
- Dressler et al. (1987) Dressler, A., Lynden-Bell, D., Burstein, D., Davies, R. L., Faber, S. M., Terlevich, R., Wegner, G. 1987, ApJ, 313, 42
- Dressler et al. (1997) Dressler, A., Oemler Jr., A., Couch, W. J., Smail, I., Ellis, R. S., Barger, A., Butcher, H., Poggianti, B. M., Sharples, R. M. 1997, ApJ, 490, 577
- Ellis et al. (1997) Ellis, R. S., Smail, I., Dressler, A., Couch, W. J., Oemler, A. J., Butcher, H., Sharples, R. M. 1997, ApJ, 483, 582
- Faber & Jackson (1976) Faber, S. M., Jackson, R. E. 1976, ApJ, 204, 668
- Faber et al. (1987) Faber, S. M., Dressler, A., Davies, R. L., Burstein, D., Lynden-Bell, D., Terlevich, R., Wegner, G. 1987, Nearly Normal Galaxies. Springer, New York, p. 175
- Faber et al. (1989) Faber, S. M., Wegner, G., Burstein, D., Davies, R. L., Dressler, A., Lynden-Bell, D., Terlevich, R. J. 1989 ApJS, 69, 763
-
Fritz et al. (2004)
Fritz, A., Ziegler, B. L., Bower, R. G., Smail, I., & Davies, R. L. 2004,
in “Clusters of Galaxies: Probes of Cosmological
Structure and Galaxy Evolution,” eds. J. S. Mulchaey, A. Dressler,
and A. Oemler. (Pasadena: Carnegie Observatories,
http://www.ociw.edu/ociw/symposia/series/
symposium3/proceedings.html). - Fukugita et al. (1995) Fukugita, M., Shimasaku, K., Ichikawa, T. 1995, PASP, 107, 945
- Girardi et al. (1998) Girardi, M., Giuricin, G., Mardirossian, F., Mezzetti, M., & Boschin, W. 1998, ApJ, 505, 74
- Graham et al. (1996) Graham, A., Lauer, T. R., Colless, M., Postman, M. 1996, ApJ, 465, 534
- Graham & Colless (1997) Graham, A., Colless, M. 1997, MNRAS, 287, 221
- Guzmán, Lucey & Bower (1993) Guzmán, R., Lucey, J. R., & Bower, R. G. 1993, MNRAS, 265, 731
- Hill et al. (1998) Hill, R. J. et al., 1998, ApJ, 496, 648
- Holtzman et al. (1995) Holtzman, J. A., Burrows, C. J., Casertano, S., Hester, J. J., Trauger, J. T., Watson, A. M., Worthey, G. 1995, PASP, 107, 1065
- Horne (1986) Horne, K. 1986, PASP, 98, 609
- James & Mobasher (1999) James, P. A., Mobasher, B. 1999, MNRAS, 306, 199
- Jørgensen (1999) Jørgensen, I. 1999, MNRAS, 306, 607 (J99)
- Jørgensen et al. (1999) Jørgensen, I., Franx, M., Hjorth, J., van Dokkum, P. G. 1999, MNRAS, 308, 833
- Jørgensen et al. (1995) Jørgensen, I., Franx, M., Kjærgaard, P. 1995, MNRAS, 273, 1097 (J99)
- Jørgensen et al. (1996) Jørgensen, I., Franx, M., Kjærgaard, P. 1996, MNRAS, 280, 167
- Kauffmann & Charlot (1998) Kauffmann, G., & Charlot, S. 1998, MNRAS, 294, 705
- Kelson et al. (2000a) Kelson, D. D., Illingworth, G. D., van Dokkum, P. G., Franx, M., 2000a, ApJ, 531, 137
- Kelson et al. (2000b) Kelson, D. D., Illingworth, G. D., van Dokkum, P. G., Franx, M., 2000b, ApJ, 531, 184
- Kelson et al. (1997) Kelson, D. D., van Dokkum, P. G., Franx, M., Illingworth, G. D., Fabricant, D. 1997, ApJ, 478, L13
- Kinney et al. (1996) Kinney, A. L., Calzetti, D., Bohlin, R. C., McQuade, K., Storchi-Bergmann, T., Schmitt, H. R. 1996, ApJ, 467, 38
- Kodama et al. (2001) Kodama, T., Smail, I., Nakata, F., Okamura, S., Bower, R. G. 2001, ApJ, 562, L9
- Kormendy (1977) Kormendy, J., 1977, ApJ, 218, 333
- Kormendy & Bender (1996) Kormendy, J., & Bender, R. 1996, ApJ, 464, L119
- Kuntschner et al. (2002) Kuntschner, H., Smith, R. J., Colless, M., Davies, R. L., Kaldare, R., Vazdekis, A. 2002 MNRAS, 337, 172
- La Barbera et al. (2002) La Barbera, F., Busarello, G., Merluzzi, P., Massarotti, M., Capaccioli, M. 2002, ApJ, 571, 790
- Larson (1975) Larson, R. B. 1975, MNRAS, 173, 671
- Le Borgne et al. (1991) Le Borgne, J. F., Mathez, G., Mellier, Y., Pello, R., Sanahuja, B. & Soucail, G. 1991, A&AS, 88, 133
- Le Borgne et al. (1992) Le Borgne, J. F., Pello, R., Sanahuja, B. 1992, A&AS, 95, 87
- Mehlert et al. (2003) Mehlert, D., Thomas, D., Saglia, R. P., Bender, R., Wegner, G. 2003, A&A, 407, 423
- Menanteau et al. (2001) Menanteau, F., Abraham, R. G., Ellis, R. S. 2001, MNRAS, 322, 1
- Moore et al. (1996) Moore, B., Katz, N., Lake, G., Dressler, A., & Oemler, A. 1996, Nature 379, 613
- Möller et al. (2001) Möller, C. S., Fritze-v.Alvensleben, U., Fricke, K. J., & Calzetti, D. 2001, Ap&SS, 276, 799
- Naab et al. (1999) Naab, T., Burkert, A., Hernquist, L. 1999, ApJ, 523, L133
- Naab & Burkert (2003) Naab, T., Burkert, A. 2003, ApJ, 597, 893
- Pahre et al. (1998a) Pahre, M. A., Djorgovski, S. G., & de Carvalho, R. R. 1998, AJ, 116, 1591
- Poggianti et al. (1999) Poggianti, B. M., Smail, I., Dressler, A., Couch, W. J., Barger, A., Butcher, H., Ellis, R. S., Oemler Jr., A. 1999, ApJ, 518, 576
- Rusin et al. (2003) Rusin, D. et al. 2003, ApJ, 587, 143
- Saglia et al. (1993) Saglia, R. P., Bender, R., Dressler, A. 1993, A&A, 279, 75
- Saglia et al. (1997a) Saglia, R. P., Bertschinger, E., Baggley, G., Burstein, D., Colless, M., Davies, R. L., McMahan Jr., R. K., Wegner, G., 1997a, ApJS, 109, 79
- Saglia et al. (1997b) Saglia, R. P., Burstein, D., Baggley, G., Davies, R. L., Bertschinger, E., Colless, M., McMahan Jr., R. K., Wegner, G., 1997b, MNRAS, 292, 499
- Sánchez-Blázquez et al. (2003) Sánchez-Blázquez, P., Gorgas, J., Cardiel, N., Cenarro, J., González, J. J. 2003, ApJ, 590, L91
- Schade et al. (1999) Schade, D. et al. 1999, ApJ, 525, 31
- Schlegel et al. (1998) Schlegel, D. J., Finkbeiner, D. P., Davis, M. 1998, ApJ, 500, 525
- Simard et al. (2002) Simard, L. et al. 2002, ApJS, 142, 1
- Smail et al. (1998) Smail, I., Edge, A. C., Ellis, R. S., Blandford, R. D. 1998, MNRAS, 293, 124
- Smail et al. (2001) Smail, I., Kuntschner, H., Kodama, T., Smith, G. P., Packham, C., Fruchter, A. S., Hook, R. N. 2001, MNRAS, 323, 839
- Stanford et al. (1998) Stanford, S. A., Eisenhardt, P. R., Dickinson,M. E. 1998, ApJ, 492, 461
- Thuan & Gunn (1976) Thuan, T. X., Gunn, J. E. 1976 PASP, 88, 543
- Toomre (1977) Toomre, A. 1977, in “The Evolution of Galaxies and Stellar populations”, eds. Tinsley B. T., Larson R. B., Yale University Press, New Haven, p. 401
- Treu et al. (2001a) Treu, T., Stiavelli, M., Møller, P., Casertano, S., & Bertin, G. 2001a MNRAS, 326, 221
- Treu et al. (2001b) Treu, T., Stiavelli, M., Bertin, G., Casertano, S., & Møller, P. 2001b MNRAS, 326, 237
- Treu et al. (2002) Treu, T., Stiavelli, M., Casertano, S., Møller, P., Bertin, G. 2002, ApJ, 564, L13
- Treu et al. (2003) Treu, T., Ellis, R. S., Kneib, J.-P., Dressler, A., Smail, I., Czoske, O., Oemler, A., Natarajan, P. 2003, ApJ, 591, 53
- Tran et al. (2003) Tran, K. H., Simard, L., Illingworth, G., Franx, M. 2003, ApJ, 590, 238
- van Dokkum & Franx (1996) van Dokkum, P. G., Franx, M. 1996, MNRAS, 281, 985
- van Dokkum et al. (1998) van Dokkum, P. G., Franx, M., Kelson, D. D., Illingworth, G. D. 1998, ApJ, 504, L17
- van Dokkum et al. (2000) van Dokkum, P. G., Franx, M., Fabricant, D., Illingworth, G. D., Kelson, D. D. 2000, ApJ, 541, 95
- van Dokkum et al. (2001) van Dokkum, P. G., Franx, M., Kelson, D. D. Illingworth, G. D. 2001, ApJ, 553, L39
- van Dokkum & Franx (2001) van Dokkum, P. G., & Franx, M. 2001, ApJ, 553, 90
- Wuyts et al. (2004) Wuyts, S., van Dokkum, P. G., Kelson, D. D., Franx, M., Illingworth, G. D. 2004, ApJ, 605, 677
- Yang et al. (2004) Yang, Y., Zabludoff, A. I., Zaritsky, D., Lauer, T. R., Mihos, J. C. 2004, ApJ, 607, 258
- Yee et al. (1996) Yee, H. K. C., Ellingson, E., Abraham, R. G., Gravel, P., Carlberg, R. G., Smecker-Hane, T. A., Schade, D., Rigler, M. 1996, ApJS, 102, 289
- Ziegler & Bender (1997) Ziegler, B. L., Bender, R. 1997, MNRAS, 291, 527
- Ziegler et al. (1999) Ziegler, B. L., Saglia, R. P., Bender, R., Belloni, P., Greggio, L., Seitz, S. 1999, A&A, 346, 13
- Ziegler et al. (2001) Ziegler, B. L., Bower, R. G., Smail, I., Davies, R. L., Lee, D., 2001, MNRAS, 325, 1571 (Z01)
Appendix A Properties of the HST subsample
Surface brightness profiles of those galaxies situated within the HST field of Abell 2390 with available spectroscopic information are shown in Fig. 11. For the surface brightnesses a correction for galactic extinction was applied. In most cases the observed profile is best fitted by a combination of a bulge (de Vaucouleurs law) and a disk component (exponential law). Values for the total magnitude , the surface brightness of the disk , the effective radius and the effective radius of the bulge , and the disk-to-bulge ratio are listed. The arrow in each diagram indicates the position of the effective radius . Typical residuals between the observed profile and the modelled fit are in the order of mag at arcsec. Note that the disk fit indicated in Fig. 11 represents the disk component of the combined best fit for the corresponding galaxies.

The single galaxy which could not be fitted (# 2933) does not reside close to the edge of the WF4 chip but is a late-type spiral galaxy (Sbc) with clear signs of spiral pattern. Thumbnail images of the cluster members are enclosed in Fig. 12. Objects were morphologically classified in two independent ways, based on visual inspection as well as fitting routine output. A visual classification was obtained by two of us, AF and IS separately, resulting in the very similar morphologies. The findings from the luminosity profile fitting provided a consistency check, which resulted in the same classification scheme except for two objects (# 2180: E (visual), S0 (fit) and # 2763: S0/Sa (visual), E (fit)). Objects which are best described with an -law are classified as an elliptical (E); those galaxies for which an additional exponential component yield in a slightly improved fit (without a dramatic change in structural properties) are classified as E/S0; S0 galaxies are best approximated by a combination of an -law plus an exponential profile.
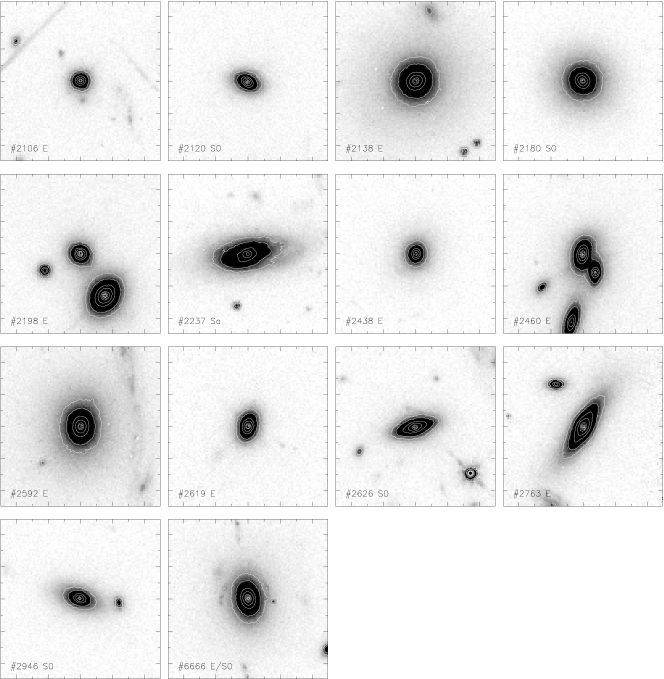
Remarks on special features on individual HST objects of Abell 2390 are listed in Table 7. The first column shows the galaxy ID, the second indicates the morphology of the objects. In the third column, additional information about special features regarding to the galaxy is given.
| ID | morp | comment |
|---|---|---|
| 2120 | S0 | signs of isophotal twists out to outer isophote |
| 2138 | E | very extended low-surface brightness (LSB) environment |
| 2198 | E | close to a bright neighbour |
| 2237 | Sa | [O III] 5007 and H emission, asymmetric LSB extension |
| 2460 | E | lensed?, very close to S0 |
| 2592 | E | next to giant arc |
| 2763 | E | slight twisted low SB |
| 2946 | S0 | small companion |
| 2933 | Sbc | no member, no structural analysis, weird spiral structure, no interaction |
Appendix B Photometric properties of cluster galaxies
In this section we present the photometric parameters derived from the ground-based , and -band Hale imaging of the cluster Abell 2390. The galaxy ID can be found in the finding chart (Fig. 1), is the total magnitude derived from the Hale images (SExtractor’s best_mag), , , and are magnitudes within a circular aperture of 3.0″ diameter measured in a seeing-matched -image. None of the given magnitudes are corrected for extinction. denotes the absolute rest-frame Gunn magnitude. The velocity dispersions of the galaxies (in km s-1) are not aperture-corrected. Column denotes the heliocentric radial velocity (in km s-1) and its error. The galaxy with ID # 3824 is presumably an EA candidate as its spectra features strong H and H Balmer lines. On the ground-based images a disk is clearly visible but no further signs of spiral structure. The object # 3038 is not included, because it is a foreground galaxy at redshift of .
For the analysis we have also excluded the Sbc galaxy # 2933 and two other objects (# 1507 and # 1639) because they all are background galaxies. Their spectra suffer from low and since their G-band is affected by strong sky-lines and the Mg feature falls into the telluric B-band no reliable velocity dispersions could be derived. The properties of these galaxies and the foreground galaxy # 3038 are shown in Table 9. During the observations of our target galaxies four other galaxies fell into the slits by coincidence (# 2222, # 5552, # 5553 and # 6666). However, apart from the object # 6666, their spectra are too faint () to determine accurate velocity dispersions. Thus, they were rejected from the final sample. For the galaxy # 6666, we derived the absolute Gunn -band magnitude using our HST photometry and included it in our data set.
| ID | R.A. | Dec. | ||||||||
|---|---|---|---|---|---|---|---|---|---|---|
| (J2000) | [km s-1] | [km s-1] | [mag] | [mag] | [mag] | [mag] | [mag] | |||
| 803 | 21:53:37.851 | 17:38:26.50 | 67851.4 | 148.0 | 24 | 18.47 | -21.21 | 22.930 | 22.346 | 18.849 |
| 869 | 21:53:46.482 | 17:38:19.79 | 67329.8 | 106.9 | 33 | 18.86 | -20.82 | 23.414 | 22.687 | 19.364 |
| 943 | 21:53:40.247 | 17:37:59.77 | 69571.0 | 204.6 | 40 | 16.69 | -22.99 | 22.305 | 21.588 | 17.993 |
| 1254 | 21:53:49.782 | 17:39:14.32 | 68452.1 | 106.4 | 23 | 19.03 | -20.65 | 23.140 | 22.714 | 19.467 |
| 1345 | 21:53:47.789 | 17:39:25.65 | 70862.4 | 129.1 | 30 | 18.65 | -21.03 | 22.934 | 22.456 | 19.180 |
| 1493 | 21:53:46.838 | 17:39:49.11 | 68239.0 | 154.4 | 28 | 18.60 | -21.08 | 23.138 | 22.490 | 19.057 |
| 1712 | 21:53:54.375 | 17:40:06.60 | 68509.8 | 095.4 | 29 | 19.13 | -20.55 | 23.839 | 23.184 | 19.711 |
| 1787 | 21:53:36.848 | 17:40:34.89 | 68215.8 | 153.3 | 37 | 18.37 | -21.31 | 23.075 | 22.296 | 18.898 |
| 1843 | 21:53:48.694 | 17:40:24.96 | 69626.6 | 213.5 | 55 | 17.21 | -22.47 | 22.255 | 21.485 | 17.996 |
| 1893 | 21:53:39.944 | 17:40:37.38 | 72079.8 | 119.4 | 40 | 18.58 | -21.10 | 22.885 | 22.229 | 18.966 |
| 1941 | 21:53:45.708 | 17:40:43.92 | 68936.3 | 166.6 | 37 | 18.32 | -21.37 | 23.255 | 22.394 | 18.867 |
| 1959 | 21:53:43.856 | 17:40:49.44 | 69561.5 | 159.7 | 29 | 18.62 | -21.07 | 23.047 | 22.385 | 18.935 |
| 1977 | 21:53:40.606 | 17:40:50.81 | 69353.9 | 212.9 | 48 | 18.40 | -21.28 | 22.823 | 22.249 | 18.912 |
| 1983 | 21:53:48.952 | 17:40:46.37 | 68611.0 | 138.8 | 35 | 18.53 | -21.15 | 23.030 | 22.352 | 18.924 |
| 2054 | 21:53:56.603 | 17:40:38.70 | 67758.9 | 246.6 | 34 | 17.43 | -22.25 | 22.816 | 22.019 | 18.468 |
| 2057 | 21:53:40.518 | 17:41:03.88 | 70311.6 | 108.8 | 24 | 19.21 | -20.47 | 23.759 | 22.947 | 19.468 |
| 2106 | 21:53:37.624 | 17:41:09.49 | 70303.6 | 131.0 | 26 | 18.66 | -21.02 | 23.616 | 22.933 | 19.604 |
| 2120 | 21:53:39.159 | 17:41:08.84 | 68348.1 | 127.2 | 34 | 18.69 | -20.99 | 23.632 | 22.840 | 19.310 |
| 2126 | 21:53:46.558 | 17:40:56.81 | 68688.5 | 172.7 | 40 | 18.01 | -21.67 | 22.759 | 22.074 | 18.707 |
| 2138 | 21:53:36.158 | 17:41:12.92 | 73905.5 | 150.0 | 54 | 17.45 | -22.23 | 22.493 | 21.737 | 18.387 |
| 2161 | 21:53:50.345 | 17:40:58.65 | 65805.4 | 153.9 | 55 | 17.28 | -22.40 | 22.028 | 21.373 | 18.193 |
| 2169 | 21:53:51.994 | 17:40:58.94 | 69318.7 | 185.1 | 39 | 16.99 | -22.69 | 22.983 | 22.288 | 18.848 |
| 2180 | 21:53:33.586 | 17:41:27.44 | 68429.8 | 146.2 | 49 | 18.07 | -21.61 | 23.148 | 22.262 | 18.674 |
| 2195 | 21:53:43.144 | 17:41:19.67 | 71527.1 | 128.0 | 25 | 19.20 | -20.48 | 23.654 | 22.899 | 19.692 |
| 2198 | 21:53:37.641 | 17:41:24.93 | 70010.9 | 135.0 | 31 | 18.84 | -20.84 | 23.584 | 22.589 | 19.000 |
| 2237 | 21:53:31.360 | 17:41:34.36 | 73707.2 | 147.1 | 29 | 17.83 | -21.85 | 22.231 | 21.693 | 18.662 |
| 2373 | 21:53:45.730 | 17:41:32.35 | 68244.0 | 156.3 | 34 | 17.58 | -22.11 | 22.816 | 21.913 | 18.577 |
| 2438 | 21:53:31.878 | 17:41:59.61 | 71101.3 | 108.6 | 30 | 19.04 | -20.64 | 23.549 | 22.787 | 19.483 |
| 2453 | 21:53:21.110 | 17:42:06.57 | 69447.8 | 137.3 | 60 | 17.27 | -22.41 | 22.565 | 21.845 | 18.200 |
| 2460 | 21:53:38.369 | 17:41:47.78 | 69519.3 | 234.5 | 40 | 17.78 | -21.90 | 23.125 | 22.194 | 18.582 |
| 2511 | 21:53:28.182 | 17:42:12.63 | 69317.2 | 139.8 | 21 | 19.07 | -20.61 | 23.795 | 22.965 | 19.504 |
| 2537 | 21:53:42.673 | 17:41:53.94 | 67004.5 | 188.8 | 35 | 18.03 | -21.65 | 22.854 | 22.182 | 18.808 |
| 2592 | 21:53:34.514 | 17:41:57.74 | 68966.4 | 174.1 | 45 | 17.47 | -22.21 | 22.870 | 21.919 | 18.444 |
| 2619 | 21:53:35.931 | 17:42:13.22 | 69424.2 | 207.9 | 30 | 18.74 | -20.94 | 23.535 | 22.606 | 19.011 |
| 2626 | 21:53:34.492 | 17:42:14.28 | 67821.9 | 177.4 | 32 | 18.47 | -21.21 | 23.331 | 22.371 | 18.890 |
| 2763 | 21:53:31.400 | 17:42:28.91 | 65665.2 | 272.5 | 51 | 17.64 | -22.05 | 22.792 | 21.889 | 18.354 |
| 2946 | 21:53:35.048 | 17:42:49.44 | 72296.1 | 119.6 | 34 | 18.81 | -20.87 | 23.477 | 22.834 | 19.280 |
| 3028 | 21:53:25.715 | 17:43:40.70 | 70038.0 | 143.1 | 27 | 18.44 | -21.24 | 23.481 | 22.607 | 19.095 |
| 3053 | 21:53:36.433 | 17:44:13.33 | 68419.5 | 227.0 | 39 | 17.94 | -21.74 | 22.886 | 22.004 | 18.502 |
| 3060 | 21:53:30.898 | 17:44:45.62 | 69644.6 | 147.3 | 21 | 18.58 | -21.10 | 23.573 | 22.724 | 19.265 |
| 3201 | 21:53:22.506 | 17:44:10.77 | 67835.1 | 175.6 | 29 | 19.13 | -20.55 | 24.010 | 23.171 | 19.598 |
| 3473 | 21:53:25.146 | 17:44:16.95 | 66780.5 | 140.4 | 49 | 18.06 | -21.63 | 23.143 | 22.236 | 18.642 |
| 3529 | 21:53:30.135 | 17:43:57.75 | 71026.3 | 125.7 | 32 | 18.15 | -21.53 | 23.154 | 22.336 | 18.802 |
| 3760 | 21:53:47.760 | 17:42:45.52 | 72378.9 | 147.7 | 39 | 17.92 | -21.76 | 22.724 | 21.968 | 18.665 |
| 3805 | 21:53:27.091 | 17:43:36.42 | 69601.5 | 227.7 | 41 | 17.42 | -22.26 | 22.791 | 21.870 | 18.189 |
| 3814 | 21:53:28.668 | 17:42:52.37 | 68365.3 | 220.2 | 49 | 17.19 | -22.49 | 22.698 | 21.872 | 18.238 |
| 3824 | 21:53:27.658 | 17:45:06.43 | 66326.5 | 147.4 | 65 | 18.13 | -21.55 | 22.110 | 21.679 | 18.488 |
| 6666 | 21:53:39.059 | 17:42:59.13 | 67163.3 | 191.3 | 28 | 17.68 | -22.00 | – | – | – |
| ID | R.A. | Dec. | ||||||||
|---|---|---|---|---|---|---|---|---|---|---|
| (J2000) | [km s-1] | [km s-1] | [mag] | [mag] | [mag] | [mag] | [mag] | |||
| 1507 | 21:53:45.512 | 17:39:57.40 | 98182.2 | – | – | 19.52 | -20.16 | 23.778 | 22.735 | 19.645 |
| 1639 | 21:53:57.073 | 17:39:58.11 | 97402.8 | – | – | 19.46 | -20.22 | 24.032 | 22.976 | 19.580 |
| 2933 | 21:53:32.404 | 17:42:48.76 | 119347.6 | – | – | 19.47 | -20.21 | 23.688 | 23.221 | 19.979 |
| 3038 | 21:53:27.845 | 17:44:23.82 | 53904.0 | 211.0 | 50 | 17.77 | -21.91 | 22.197 | 21.537 | 18.249 |