Stellar abundance gradients in galactic disks. I. Method and spectral line gradients
Abstract
We describe the technique of absorption line imaging of galaxy disks using the Taurus Tunable Filter on the Anglo-Australian Telescope and demonstrate its sensitivity to the behaviour of spectral features associated with Mg and Fe. Radial profiles of Mg2 and Fe5270 line-strengths are presented for a sample of eight face-on spiral galaxies spanning a range of Hubble types. Signatures of phenomena including merger-induced star formation, H ii rings and galactic bars are also reported. This study demonstrates the capacity of tunable filters to measure Mg and Fe line-strengths across the face of spiral galaxies, which can ultimately reveal clues about the star formation history and chemical evolution.
keywords:
galaxies: abundances – galaxies: photometry – galaxies: spiral – methods: observational – stars: abundances1 Introduction
Radial gradients in the abundances of elements such as oxygen, nitrogen, and sulphur have long been observed in the disk of the Milky Way (Shaver et al., 1983), as well as in the disks of many nearby spiral galaxies (Zaritsky et al., 1994; Ryder, 1995). The gas-phase abundances of these elements in H ii regions are relatively straightforward to determine on the basis of their bright emission-line ratios (see the review by Henry & Worthey (1999)). Analyses by Vila-Costas & Edmunds (1992) and others have revealed interesting correlations between the slope of these abundance gradients, and global galaxy characteristics. A variety of mechanisms have been proposed to account for the fact that the inner regions of spiral galaxies are generally more metal-rich than the outer parts, including ongoing infall of metal-poor gas, and radial inflow of enriched gas. The presence of a bar has been shown to homogenise the abundances somewhat, resulting in a flatter abundance profile than in a non-barred galaxy of similar Hubble type (Martin, 1998).
Since oxygen is a primary element produced in massive stars, its abundance is a useful measure of the cumulative massive star formation rate. In order to build up a proper star formation history however, it is necessary to be able to measure the relative abundances of other elements such as iron and magnesium, which are produced in different types of stars and released into the interstellar medium on different characteristic timescales. Abundance determinations from absorption line studies of these elements are commonplace for stars in our own Galaxy (e.g. Friel & Janes 1993; Gilmore et al. 1995); in the integrated light of elliptical galaxies, bulges, and extragalactic globular clusters (e.g. Huchra et al. 1996; Trager et al. 1998; Cohen, Blakeslee, & Côté 2003); and as a function of radius for inner galactic regions (Raimann et al. 2001; Jablonka, Gorgas, & Goudfrooij 2002; Proctor & Sansom 2002; Worthey 2004). However, such measurements become much more difficult in galactic disks, due to the fact that the surface brightness of the unresolved stellar population (against which a weak absorption feature must be measured) is much lower. Fortunately, interference filter imaging offers almost an order of magnitude gain in effective signal-to-noise over a long-slit spectrograph of the same resolution, as demonstrated by Beauchamp & Hardy (1997) and Mollá, Hardy & Beauchamp (1999). Despite a modest telescope aperture, and the need for expensive, custom-made filters with broader bandpasses than one would like ( Å, to be able to cover a useful range in galaxy redshift), these pioneering studies have revealed the existence of shallow radial gradients in the Mg and Fe features in the disks of NGC 4303, NGC 4321, and NGC 4535.
In this paper, we describe the application of narrow-band absorption-line imaging techniques using the wavelength agility, wide field-of-view, and charge-shuffling ability of the Taurus Tunable Filter (TTF) at the Anglo-Australian Telescope (AAT) to almost triple the number of face-on spiral galaxies for which stellar radial abundance gradients have been measured. We begin by outlining the TTF’s characteristics in Section 2, before demonstrating the sensitivity of our technique on stars with a range of known abundances in Section 3. Our galaxy imaging and surface photometry techniques are presented in Sections 4 and 5, and the radial gradients in “Lick/IDS” spectral line indices (Faber et al. 1985; Worthey et al. 1994) in Section 6. The Lick spectral indices do not measure abundances per se, but can be transformed to quantities like [Fe/H] via the method of spectral synthesis. In Paper II (Fenner, Gibson & Ryder, in preparation), we present models and tools for converting between absolute elemental abundances and line indices in the observer’s plane, and thus place new constraints on the star formation histories of the galaxies presented here.
2 Absorption Line Imaging
2.1 The Taurus Tunable Filter (TTF) Instrument
The TTF is a tunable Fabry-Perot Interferometer consisting of two highly polished glass plates whose separation is controlled to high accuracy by piezoelectric stacks. Unlike most Fabry-Perot etalons which have resolving powers , the TTF is designed to work at plate separations m or less, delivering , comparable to conventional fixed narrow-band interference filters (see Bland-Hawthorn & Jones (1998) and Bland-Hawthorn & Kedziora-Chudczer (2003) for summaries of the optical design and practical applications of the TTF). The TTF is mounted in the collimated beam of the Taurus II focal reducer, and at the f/8 Cassegrain focus of the 3.9 m AAT delivers a field of view up to 10 arcmin in diameter (depending on the clear aperture of the blocking filter in use). The EEV 4096 CCD detector used for these observations has a scale of 0.33 arcsec pixel-1, and a quantum efficiency near 90 percent in the Å wavelength range.
By enabling an adjustable passband anywhere between 3700 and 10000 Å, the TTF obviates the need for an entire suite of narrow-band filters, and makes possible monochromatic imaging of almost any feature of interest over an expansive redshift range. Another important aspect of our observing method is the use of charge-shuffling synchronised with passband-switching, which overcomes many of the systematic errors which plague conventional narrow-band imaging, while allowing accurate differential measurements under less than ideal observing conditions.
2.2 Choice of Lick indices and blocking filters
In their work, Beauchamp & Hardy (1997) and Mollá et al. (1999) concentrated on the Mg2 and Fe5270 features, two of the most prominent “Lick/IDS” indices (Faber et al. 1985; Worthey et al. 1994), in part to limit the number of expensive narrow-band filters that would be required. We chose to image our sample galaxies in these same two lines in order to be consistent with their study and to facilitate comparison with the large body of observational and theoretical work performed with these two indices. Nevertheless, as Tripicco & Bell (1995) point out, these features are susceptible to some contamination by other elements, such as Ca and C.
To simplify the transformations from our observed measurements of the absorption line and continuum flux ratios to the Lick indices, we have endeavoured to match as closely as possible the original line and continuum bandpass definitions laid down by Faber et al. (1985). While selecting the narrowest possible bandpass for the TTF will ensure the maximum contrast between the absorption line core flux and continuum band, the overall signal-to-noise (S/N) of each measurement (and more significantly, of their ratio which defines the index) will suffer from the reduced throughput. On the other hand, the broadest bandpass will improve the throughput, but at the expense of diluting the absorption feature. Because narrowing the gap between the plates in order to broaden the passband risks irreparable damage to the plates should their coatings come into contact with each other, we opted for a minimum plate spacing of 2.5 microns, which yields a Lorentzian passband with Full Width at Half-Maximum (FWHM) Å at 5100 Å. This is four times narrower than the fixed filters employed by Beauchamp & Hardy (1997), and being of the same order as the equivalent widths of the Mg2 and Fe5270 features, is a good compromise between contrast and S/N.
Like all Fabry-Perot etalons, the TTF has a periodic transmission profile, with a finesse , i.e. an inter-order spacing of the instrumental FWHM. Thus, to ensure only a single order of the TTF reaches the detector, we require a blocking filter with Å, but broad enough to contain the full Mg2 and Fe5270 passbands. Unfortunately, none of the existing TTF blocking filters meets both these requirements, and the f126 blocking filter we used, a 380 Å FWHM interference filter centred on 5220 Å, was not ideal. As Fig. 1 shows, the blue continuum of the Mg2 feature lies just outside the blue cutoff of the f126 filter, while the transmission peaks at barely 70 percent, and varies by up to 35 percent over just 100 Å. In addition, the clear aperture of just 63 mm limits the usable field of view to about 6 arcmin in diameter. Nevertheless, as we show in the following sections, this blocking filter adequately met the goals of this project. To cover the blue continuum of the Mg2 feature, we used the TTF’s B4 blocking filter, with a FWHM = 320 Å centred on 5000 Å, a clear aperture of 122 mm, and a peak throughput of 76 percent.
2.3 Wavelength calibration
The plate separation and parallelism in the TTF is set by three piezoelectric stacks, and servo-stabilised against drifting by a capacitance bridge. Tuning to the desired wavelength is performed by fine adjustment of the plate separation through a Queensgate Instruments CS100 controller. In order to define the relationship between a given plate separation (, in analog-to-digital units) and central wavelength of the TTF passband (, in Å), we illuminate the TTF uniformly with an arc lamp, and record the lamp spectrum while scanning the TTF progressively in wavelength. For the region of interest ( Å), a combination of deuterium, helium, and neon lamps yielded sufficient lines for this purpose.
As noted by Jones et al. (2002), at plate separations microns the multi-layer coating thickness becomes a significant fraction of the actual plate spacing. Since the depth within the coatings where reflection occurs is wavelength-dependent, the net effect is that the relation between and is no longer linear as it is for larger plate spacings (or equivalently, narrower bandpasses). Indeed, we found it necessary to apply a quadratic (second order) fit to the relation. Incorrectly assuming a linear relation could result in the passband being offset by the equivalent of the FWHM at the extreme wavelength settings.
3 Stellar observations and calibration onto the Lick system
In order to derive a function for converting absorption line-strengths measured with the TTF into the Lick/IDS system, we applied our technique to 31 Lick standard stars for which Mg2 and Fe5270 indices are available in Worthey et al. (1994). These stars spanned a broad range in metallicity, and thus in their Lick indices. Stars were imaged at 6 intervals in a wavelength range from a minimum of either 5100 or 4870 to a maximum 5400 , with the TTF set to a bandpass of FWHM 17 . In this way, a low-resolution spectrum was built-up from the series of individual images for each star. Each stellar image was trimmed, bias corrected, and flux within a fixed aperture measured using tasks within the iraf package.
Figure 1 compares a TTF spectral scan (solid line) for the star HD131977 against a Coudé Feed stellar spectrum of the same star (found at The Indo-U.S. Library of Coudé Feed Stellar Spectra home page at http://www.noao.edu/cflib/), degraded to match the resolution of the TTF data (dotted line). The TTF spectrum has been corrected for the transmission profiles of the f126 and B4 blocking filters (described in Section 2.2). The filter transmission profiles (dashed lines) were obtained by dividing our TTF spectral scans of the flux standards HR7596 and HR5501 by the flux calibrated spectra from Hamuy et al. (1992). The alignment between the spectral features seen in the TTF scan and those of the Coudé Feed spectrum confirms that the quadratic relation described in Section 2.3 leads to good wavelength calibration. The location of the Lorentzian profiles shown in Fig. 1 indicates the central wavelengths of the Mg2 and Fe5270 absorption features and the corresponding red and blue continua, as defined by Faber et al. (1985). The shape of the Lorentzians illustrates that of the TTF bandpass used in this study, particularly the broad wings.
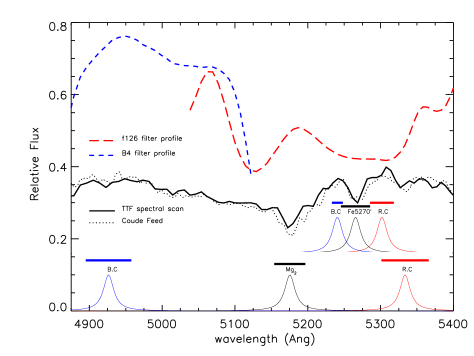
The full stellar spectral scans provide a means for checking not just the wavelength calibration, but just as importantly, in gauging the sensitivity of this imaging technique to spectral features. However, the Mg2 and Fe5270 indices were not calculated from the full spectral scans. Instead, they were derived using only the images at the (velocity-corrected) line and continuum wavelengths, since this is the technique to be applied to the galaxies. Instrumental indices were calculated from the following expressions ( Beauchamp & Hardy 1997):
| (1) |
| (2) |
where and denotes the sky-subtracted, filter profile-corrected flux at the Mg2 and Fe5270 line wavelengths, respectively, and is the FWHM of the Lorentzian bandpass. The continuum flux, , is given by:
| (3) |
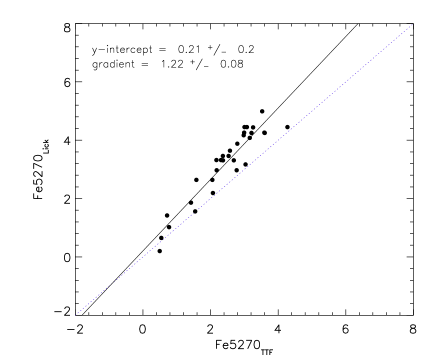
where , and and are the sky-subtracted, filter profile-corrected flux at the red and blue continua, respectively. We varied the weighting given to the red and blue continua and found that the strongest correlation between our TTF indices and the Lick values was obtained by using the red continuum only (i.e. and ). Table 1 presents the gradients, y-intercepts, associated errors and chi-squared values for the fit between TTF and Lick Fe5270 indices obtained using only the red continuum (column 3), only the blue continuum (column 4), and with equal weighting (column 5). Table 1 only shows the case for Mg2 (column 2) because our spectral scans only extended down to 4870 for about half of the stars; however this case gave the best fit.
The deterioration of the fit for the Fe5270 feature upon inclusion of the blue continuum flux is largely due to our non-standard technique for obtaining line core and continuum flux levels, which is more sensitive to the gradient in the spectrum than the Lick/IDS technique. The Lick/IDS Fe5270 blue continuum bandpass covers a narrow wavelength range, just blueward of the absorption feature, that best represents the true continuum level (see the thick horizontal lines in Fig. 1). By comparison, the Lick/IDS line and red continuum bandpasses are 2.12.7 times wider than that for the blue continuum. As evident from Fig. 1, the broad wings of our Lorentzian transmission profile makes the blue continuum flux measured by the TTF sensitive to the shape and gradient of the spectrum around the 52205260 Å range. Better results would be expected if the TTF passband could be narrowed when switching from line to blue continuum wavelengths. However, it was not possible to alter the filter’s plate spacings during charge-shuffle operations.
In the case of Mg2, observing the blue continuum introduces further complications. Firstly, measuring Mg involves changing from the f126 to the B4 blocking filter. Since filters could not be switched while in charge-shuffle mode, one would lose some of the advantage of this differential observing technique to average over temporal variations in air mass and photometric conditions during exposures. Secondly, the blue continuum range of Å, as defined by Worthey et al. (1994), is contaminated in many active galaxies by [O iii] emission. Our sample of eight galaxies contains three Seyferts, for which this [O iii] emission is likely to contribute to the flux in the Mg2,BC images. For these reasons, and considering the fit parameters shown in Table 1, the value in equations 1 and 2, was determined exclusively from red continuum images for both Mg2 and Fe5270.
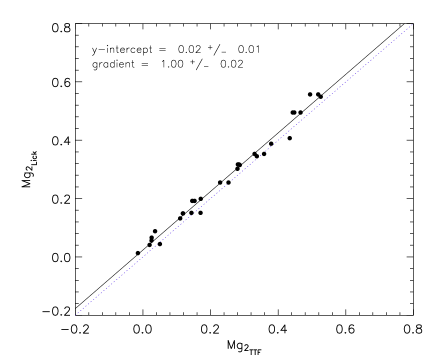
Figure 2 compares the Mg2 and Fe5270 indices obtained for our sample of 31 stars using the absorption-line imaging technique described in this study against the published Lick values. The following equations allow the transformation of and into the Lick system, and were used for subsequent galaxy data analysis:
| (4) |
| (5) |
| Mg2 | Fe5270 | ||||
|---|---|---|---|---|---|
| c | RC | RC | BC | (RCBC)/2 | |
| gradient | 1.00 | 1.22 | 1.16 | 1.44 | |
| gradient | 0.02 | 0.08 | 0.24 | 0.13 | |
| y-intercept | 0.02 | 0.2 | 1.5 | 0.4 | |
| y-intercept | 0.01 | 0.2 | 0.4 | 0.3 | |
| chi-squared | 0.02 | 5.4 | 26 | 9 |
4 Galaxy Observations
Having established the credentials of our technique using Lick standard stars, we observed a sample of eight spiral galaxies, selected in order to satisfy the following needs: 1) to span a range of morphologies, from early to late Hubble types; 2) to be roughly face-on; and 3) to fill enough of our CCD such that the galactic disk covers a large number of pixels but leaves sufficient area from which to estimate the background sky level. The last criterion meant that all our galaxies have diameters between about 2 and 4 arcmin. Choosing galaxies with low inclination angles ensures that the stellar rotational velocity width “fits” within the bandpass used in this study. Some properties of the galaxies are summarised in Table 2.
Galaxy observations consisted of 10 minutes of integration at each wavelength, with the TTF passband being switched between the redshifted line core and red continuum wavelengths each minute, while synchronously shuffling the charge back and forth across the CCD between an “exposure” and a “storage” location. Thus, temporal variations in atmospheric and seeing conditions were smoothed out over both spectral passbands (see Maloney & Bland-Hawthorn 2001 for a detailed description of this charge-shuffle technique). Multiple charge-shuffled exposures were taken of each galaxy, with the total exposure times for Mg2 and Fe5270 given in Table 3.
| Galaxy | Hubble | Recession | Distance | Inclination | mB | Scale | mean surf | D25 |
|---|---|---|---|---|---|---|---|---|
| Typea | Vel. (km s-1)a | (Mpc)b | (deg)c | (mag)a | (pc arcsec-1) | brightness c | (arcmin)c | |
| NGC 5968 | SAB(r)bc | 5448 | 77 | 22 | 13.1 | 352 | 22.7 | 2.2 |
| NGC 6221 | SB(s)bc pec | 1482 | 20 | 62 | 10.7 | 96 | 21.5 | 4.5 |
| NGC 6753 | (R’)SA(r)b | 3124 | 42 | 31 | 12.0 | 202 | 20.8 | 2.6 |
| NGC 6814 | SAB(rs)bc | 1563 | 21 | 65 | 12.1 | 101 | 22.0 | 3.3 |
| NGC 6935 | (R)SA(r)a | 4587 | 61 | 31 | 12.8 | 296 | 21.7 | 2.2 |
| NGC 7213 | SA(s)0 LINER | 1792 | 24 | 29 | 11.0 | 116 | 20.7 | 3.0 |
| NGC 7412 | SAB(s)c | 1717 | 23 | 41 | 11.9 | 111 | 22.1 | 4.1 |
| NGC 7637 | SA(r)bc | 3680 | 49 | 28 | 13.2 | 238 | 22.4 | 2.2 |
| Galaxy | Lick Feature | Date | Total Exp [min] | Notes |
|---|---|---|---|---|
| NGC 5968 | Mg2 line + R.C. | 31 July 2003 | 120 | poor seeing and some clouds |
| Fe5270 line + R.C. | 28 July 2003 | 60 | ||
| NGC 6221 | Mg2 line + R.C. | 7 Aug 2002 | 120 | poor seeing |
| Fe5270 line + R.C. | 6 Aug 2002 | 60 | ||
| NGC 6753 | Mg2 line + R.C. | 29 July 2003 | 120 | |
| Fe5270 line + R.C. | 28 July 2003 | 60 | ||
| NGC 6814 | Mg2 line + R.C. | 8 Aug 2002 | 40 | |
| Fe5270 line + R.C. | 8 Aug 2002 | 60 | ||
| NGC 6935 | Mg2 line + R.C. | 31 July 2003 | 120 | poor seeing |
| Fe5270 line + R.C. | 28 July 2003 | 60 | ||
| NGC 7213 | Mg2 line + R.C. | 7 Aug 2002 | 120 | poor seeing and some clouds |
| Fe5270 line + R.C. | 6 Aug 2002 | 60 | ||
| NGC 7412 | Mg2 line + R.C. | 7 Aug 2002 | 80 | some clouds |
| Fe5270 line + R.C. | 8 Aug 2002 | 60 | ||
| NGC 7637 | Mg2 line + R.C. | 31 July 2003 | 100 | poor seeing |
| Fe5270 line + R.C. | 28 July 2003 | 60 |
5 Galaxy data reduction and analysis
In this section, we describe each of the steps involved in reducing and analysing the galaxy data in order to evaluate the Mg2 and Fe5270 radial profiles.
5.1 Data Reduction
5.1.1 Reduction of raw galaxy images
Due to the charge-shuffle technique, the line and continuum images are located in different regions on a single CCD image. After bias subtraction, each image was bisected into the line and continuum component. These images were trimmed for compatibility with the flat-field images, which were not charge-shuffled. Repeat galaxy images were then averaged to produce four images per galaxy, corresponding to the Mg2 and the Fe5270 line and red continuum wavelengths.
5.1.2 Flat-field correction
Correctly flat-fielding the galaxy images is crucial for eliminating spatial variations in the pixel to pixel response due to filter transmission and with wavelength/etalon spacing. Any residual large-scale structure in the images will compromise subsequent surface photometry. After each night’s observing, a series of dome flats was taken, with the etalon set to the same spacings/wavelengths at which the galaxies were observed. Typically, three exposures were taken per wavelength, and combined into a single image, that was then normalised and divided into the appropriate galaxy image, as part of the iraf flat-fielding procedures.
5.1.3 Ellipse procedure
The ELLIPSE package within iraf/stsdas was used to analyse separately, but identically, the radial surface brightness profiles of the line and continuum images. There were four images per galaxy, taken at the Mg2 line and red continuum and Fe5270 line and red continuum wavelengths. Position angle and ellipticity were fitted interactively to one of the images, with the same settings being applied to the remaining three images and fixed at all radii. Linear radial steps were used and the average flux within each ellipse was calculated with the ELLIPSE package using the median area integration mode. Discrepant data points were eliminated within ELLIPSE by imposing 2- and 3-sigma upper and lower clipping criteria, respectively, and by iterating the clipping algorithm four times. H ii regions were not masked, but they are not expected to significantly affect the measured surface brightness profile because they generally occupy a small fraction of pixels per ellipse and therefore should have a negligible influence on the median flux. Moreover, the clipping algorithm removes many pixels associated with bright H ii regions.
The ELLIPSE procedure yields radial surface brightness profiles for Mg2 and Fe5270 in the line and continuum for each galaxy. Each line and continuum pair of surface brightness profiles then needed to be sky-subtracted, filter-profile corrected, converted to instrumental indices via equations 1 and 2, and finally transformed into the Lick system using equations 4 and 5. These steps are described in the following section.
5.2 Data Analysis
5.2.1 Sky subtraction
The sky level was estimated from the mean flux in an elliptical annulus whose inner radius and width was selected to ensure that the radial variation in surface brightness was less than the pixel-to-pixel dispersion in each ellipse. In this way, the sky was taken from a “flat” part of the radial surface brightness profile and, in most cases, the sky annulus lay well outside the isophotal radius. For each galaxy, the same sky annulus was used for all four Mg2 and Fe5270 line and continuum images. The average brightness in the sky annulus was then subtracted from the surface brightness profile.
5.2.2 Filter profile correction
Two methods of correcting for the wavelength-dependent filter transmission profile were tested. In the first instance, we divided each surface brightness profile by the value of the filter profile (shown in Fig. 1) at the corresponding wavelength, i.e. the same technique as for the standard stars. However, better results were obtained by instead applying a scaling factor to the radial profiles such that the value of the line and continuum sky levels were equal. This forces the TTF instrumental Mg2 and Fe5270 indices to have an average value of zero in the sky annuli.
There are several reasons why the second approach was more accurate than the first approach, despite the former’s success when used on standard stars. Firstly, inspection of Fig. 1 reveals that the Fe5270 line and red continuum fall on a fairly flat part of the f126 filter profile, such that filter transmission is not very sensitive to drifts in wavelength calibration (that can be as large as 4 , as will be discussed in Section 5.3 below). Although the Mg2 line and red continuum fall on steeper parts of the profile, small shifts in wavelength calibration would change the transmission of the line and continuum by similar amounts. Thus, the relative transmission of the line and continuum features for both Mg2 and Fe5270 is fairly robust to wavelength calibration drifts for objects at or near rest-wavelength. The recessional velocities of our sample of galaxies (given in Table 2) shift the spectral features toward longer wavelengths by 30 – 100 . This tends to place the galaxy line and continua in regions of the spectrum where their relative transmission is far more sensitive to small wavelength drifts. Secondly, unlike the stellar observations, the galaxy exposures lasted at least an hour, during which time the TTF alternated between line and continuum wavelengths at one minute intervals. As a result, the amount of light reaching the CCD varied smoothly with changing airmass but also varied unpredictably with fluctuating photometric conditions. If one applies the filter profile correction factor to the surface brightness profiles, it is still necessary to scale the images to account for residual differences in atmospheric conditions. Conversely, by using the relative line and red continuum sky levels to correct for filter transmission, one naturally corrects for variable observing conditions during exposures. However, this approach assumes that the intensity of the background sky is the same at both the line and red continuum wavelengths.
5.2.3 Conversion to Lick system
5.3 Errors
Our results are subject to various sources of uncertainty, the most important of which are: 1) sky subtraction, 2) filter transmission profile correction, and 3) TTF to Lick conversion. Each of these sources of error act on the calculated radial line-strength profiles in different ways. The foremost factor influencing the line-strength gradients is the estimation and subtraction of the background sky level, which introduces very large errors toward the outer galactic disk, where the galaxy surface brightness is very low relative to the sky. The sky subtraction uncertainty, , was evaluated from the flux dispersion in the annulus designated as the sky region. The position of this sky annulus was somewhat subjective and was chosen to minimise the rms dispersion.
The error, , due to correcting for the wavelength-dependent filter transmission profile does not influence the shape or gradient of the radial line-strength profile, but instead can uniformly shift the radial profile vertically.
Converting the instrumental indices into the Lick system introduces the errors specified in equations 4 and 5. These errors affect both the profile shape and the absolute values of the line-strengths. It should be emphasised that the uncertainty in the profile shape due to sky subtraction overwhelms that associated with TTF-to-Lick conversion.
Although we frequently re-calibrated our relation between galaxy exposures, the wavelength tuning was found to drift by up to 5 over the course of a night. Such a drift introduces errors into the measured indices in two ways: firstly, one loses sensitivity to the absorption-line as the bandpass shifts away from the centroid of the absorption feature; and secondly, the blocking filter transmission profile is strongly wavelength-dependent - especially for and , as evident in Fig. 1. The error introduced by this wavelength calibration drift is, however, already folded into the TTF-to-Lick conversion error. This is because the stellar observations used to transform TTF instrumental indices into the Lick system were themselves subject to calibration drift, and this contributes to the scatter seen in Fig. 2.
Seeing varied from less than 1 arcsec to about 4 arcsec in the worst conditions, but because the flux was azimuthally averaged in 5 arcsec spaced radial bins, poor seeing is only likely to have affected the calculated line-strengths in the innermost radii. Moreover, since the radial gradients listed in Table 4 refer to the disk only, excluding the central bulge, our calculations are barely affected by changing seeing conditions.
6 Results
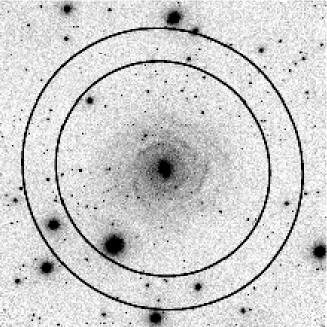
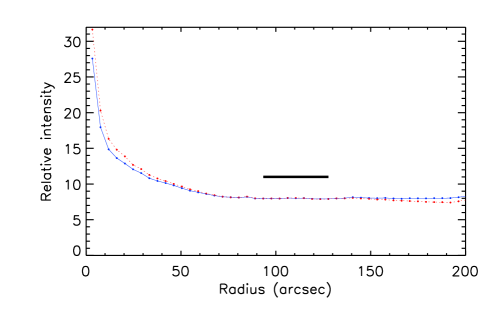
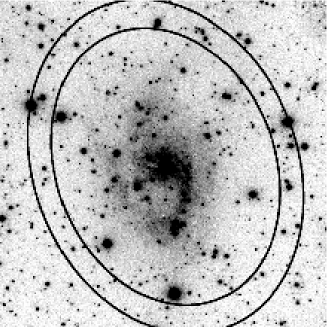
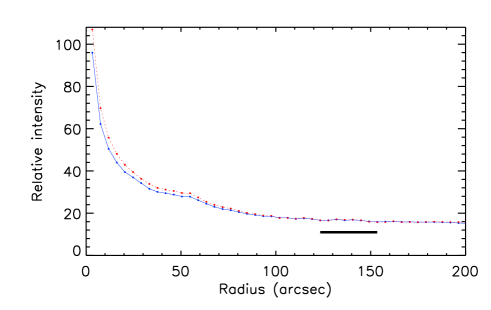
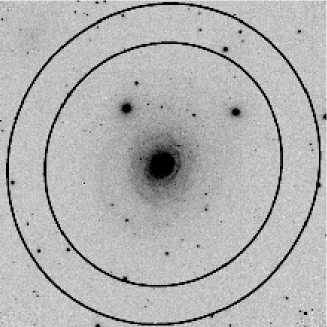
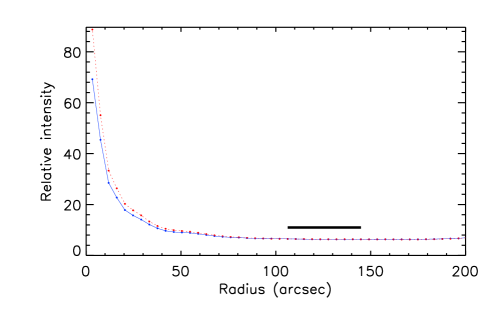
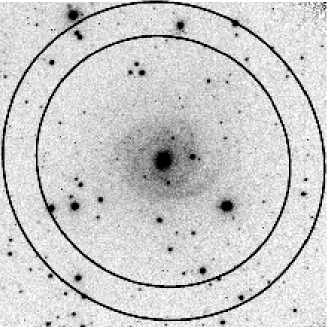
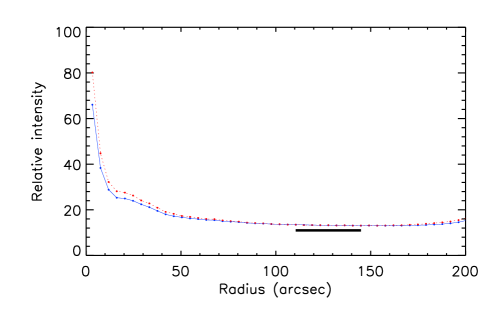
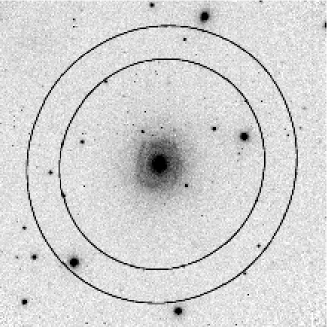
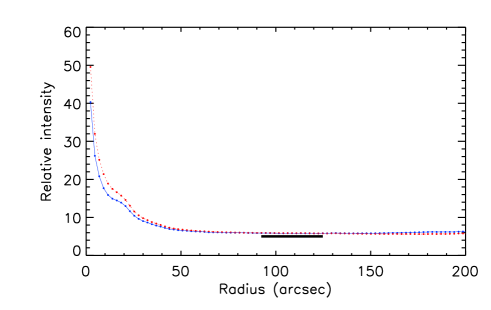
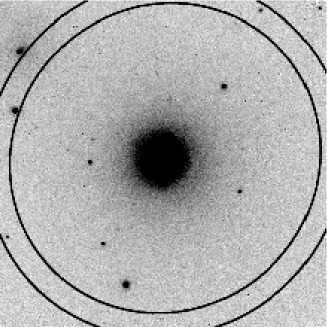
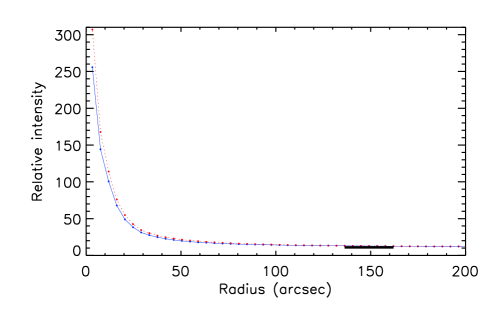
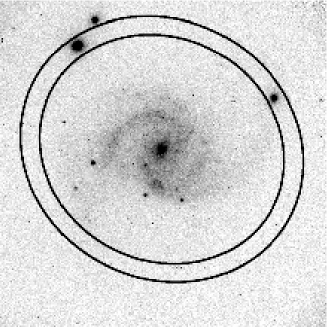
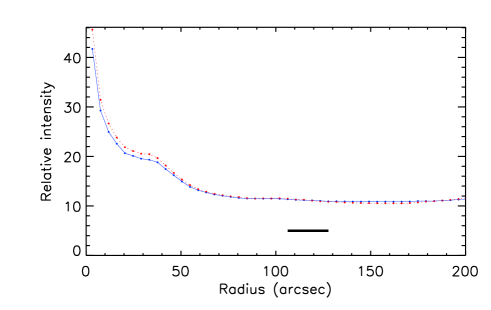
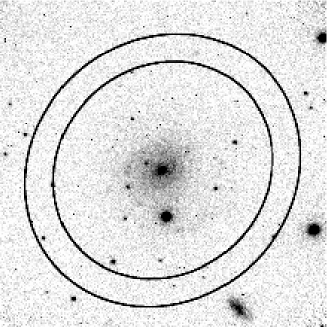
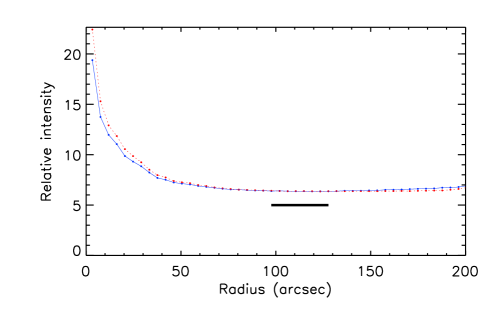
Figures 310 illustrate the main results of this study. Images of each galaxy are presented along with plots of the radial variation of surface brightness and the Mg2 and Fe5270 indices. In each figure a 288 288 arcsec image of the galaxy in the Fe5270 line is presented in panel , overlaid with two ellipses indicating the inner and outer bounds of the region from which the background sky level was calculated. For each individual galaxy, the ellipse geometry was fitted using the technique described in Section 5.1.3 and fixed for all radii. Panel in each figure shows the radial variation in surface brightness, with the thick solid line denoting the location of the background sky annulus. Panels and show the radial gradients of the Mg2 and Fe5270 Lick indices, respectively, calculated using the method described in Section 5. The data in panels and are tabulated in Appendix A. Note that the surface brightness profile plots extend to greater radii than the line strength gradient plots. The total uncertainty due to sky subtraction, filter transmission correction and transformation into the Lick system is shown by thin error bars, while the thick bars display the error due to sky subtraction alone. The dashed line indicates the sky subtraction error-weighted line of best fit to the disk. Since the radial gradients are most sensitive to uncertainty in sky subtraction, they were calculated using only sky subtraction errors to weight the data points. As pointed out in Section 5.3, the errors from filter transmission correction and transformation into the Lick system act to uniformly shift the curves vertically, but do not change the gradient. The disk gradient calculations excluded the inner bulge, which was identified from the change in slope of the radial log(surface brightness) profile, indicative of a bulge-to-disk transition.
Table 4 summarises the Mg2 and Fe5270 indices derived for the inner bulge along with the gradient and vertical intercept of the linear fit to the radial line-strength profiles in the disk of the eight galaxies in our sample. The disk gradients exclude the galactic bulge and are expressed with respect to the apparent radius, R25 = D, where D25 is listed in Table 2.
One motivation for this kind of study is to test the dependence of abundance gradients in disk galaxies on Hubble type. In an investigation into line-strength gradients in S0 galaxies, Fisher, Franx & Illingworth (1996) found evidence for a strong relationship, with the shallowest gradients being found in S0 galaxies and the steepest in later-type spirals. We find no clear trend between Hubble type and gradient in our small sample, but we note that the only S0 galaxy in our sample also has the only positive gradient. Unfortunately, our sample is too small to draw statistically significant conclusions.
As this study presents the first ever measurements of Lick indices across the disks of these eight galaxies, a direct comparison of our main results with the literature was not possible. Restrictions imposed by the availability of targets meeting the selection criteria outlined in Section 4 prevented any overlap between our sample and that of Beauchamp & Hardy (1997) and Mollá et al. (1999). Idiart, de Freitas Pacheco & Costa (1996) measured Lick indices in the bulge of one of our galaxies, NGC 6935, finding Mg2 = 0.243 0.009 mag and Fe5270 = 2.3 0.23 Å. Reassuringly, our value of Fe5270 = 2.4 0.4 Å in the central galaxy is in very good agreement with Idiart et al. (1996), although our value of Mg2 = 0.29 0.03 mag is slightly higher. We note that, unlike Idiart et al. (1996), our values have not been corrected for velocity dispersion, nor reddening. However, Beauchamp & Hardy (1997) demonstrated that spectral broadening due to stellar velocity dispersion is small for face-on spirals like those in our sample. From the results of Beauchamp & Hardy (1997), we also expect that any reddening corrections are less than uncertainties in the data and would not significantly affect the index gradients. We emphasise that the chief sources of error affecting the absolute values of our derived Mg2 and Fe5270 in the bulge come from correcting for the filter transmission profile and transforming into the Lick system. For each galaxy, these uncertainties translate into roughly the same offset in absolute value for all radii. The following discussions concentrate on the radial behaviour and gradients of the line-strengths: properties that are robust to most sources of uncertainty aside from sky subtraction.
Cid Fernandes, Storchi-Bergmann & Schmitt (1998) measured radial variations in stellar absorption features in the inner regions of active galaxies, including the three Seyfert galaxies in our sample; NGC 6221, NGC 6814 and NGC 7213. They did not use the Lick system to measure spectral lines, however their radial profiles of the equivalent width (EW) of the Mg I+Mg H feature allow for a qualitative comparison with our Mg2 measurements. Their wavelength window of 51565196 for Mg I+Mg H matches the Lick definition for Mg2, but Cid Fernandes et al. (1998) use different pseudo-continua. As will be discussed in more detail below, the shape of their Mg I+Mg H profiles compare well with our Mg2 profiles for all three galaxies, although their measurements only extend to radii less than a quarter those reached in this investigation.
| Galaxy | Mg2(r = 0) | Fe5270(r = 0) | Mg2 / R25 a | Fe5270 / R25 a | Mg2 intercept b | Fe5270 intercept b |
|---|---|---|---|---|---|---|
| NGC 5968 | 0.22 0.03 | 3.2 0.4 | 0.15 0.05 | 0.8 0.7 | 0.26 0.02 | 3.0 0.3 |
| NGC 6221 | 0.17 0.03 | 1.9 0.3 | 0.0 0.06 | 1.5 1 | 0.17 0.02 | 1.6 0.3 |
| NGC 6753 | 0.40 0.03 | 2.6 0.4 | 0.09 0.02 | 1 0.5 | 0.268 0.005 | 2.8 0.1 |
| NGC 6814 | 0.23 0.03 | 1.0 0.3 | 0.1 0.05 | 2 1 | 0.27 0.01 | 2.3 0.2 |
| NGC 6935 | 0.29 0.03 | 2.4 0.4 | 0.15 0.03 | 1.7 0.4 | 0.32 0.01 | 2.8 0.1 |
| NGC 7213 | 0.23 0.03 | 1.7 0.3 | 0.15 0.04 | 2 1 | 0.15 0.01 | 1.1 0.2 |
| NGC 7412 | 0.16 0.03 | 2.0 0.4 | 0.05 0.1 | 1 1.5 | 0.15 0.02 | 2.0 0.2 |
| NGC 7637 | 0.24 0.03 | 2.2 0.3 | 0.15 0.03 | 1.5 0.5 | 0.253 0.005 | 2.9 0.1 |
7 Individual Galaxies
In this section, we comment on the radial line-strength profiles for each galaxy individually.
7.1 NGC 5968 - SAB(r)bc
This galaxy has a small bright nucleus, a short bar, thin knotty arms, and the lowest mean surface brightness of the galaxies in our sample (see Table 2). The same overall features are seen in both the Mg2 and Fe5270 profiles (Fig. 3), however the Mg2 gradient is steeper than that of Fe5270, giving NGC 5968 the highest ratio of Mg2/Fe5270 in our sample.
7.2 NGC 6221 - SB(s)bc pec
This galaxy exhibits peculiar morphology and asymmetric arms due to interaction with its neighbour NGC 6215 and several smaller dwarf galaxies (Koribalski & Dickey, 2004). A thick bar is evident and most of the current star formation is offset from the nucleus. Cid Fernandes et al. (1998) measured the Mg I+Mg H EW out to a radius of 12 arcsec in NGC 6221. Their EW peaked at about 5 arcsec before becoming diluted by about 50% toward the nucleus (see their fig. 43). Our Mg2 profile peaks at a similar radius, but shows only moderate diminishment towards the nucleus. This disagreement may be due to the different methods used for continuum determination. The cause of the dilution of this absorption feature is likely to be the presence of an active galactic nucleus (AGN). NGC 6221, NGC 6814 and NGC 7213 are all classified as Seyfert galaxies and therefore produce non-thermal continuum radiation and broad emission lines in the nucleus. The superposition of an AGN continuum on top of the stellar spectrum can act to decrease the measured strength of the absorption features in the galaxy’s core.
Curiously, the Fe5270 feature dips between about 5 10 arcsec and rises toward the centre. The Mg2 line-strength shows no radial variation in the disk, while the Fe5270 feature decreases fairly steeply, such that NGC 6221 has the lowest ratio of Mg2/Fe5270 of the galaxies in our sample.
7.3 NGC 6753 - (R’)SA(r)b
NGC 6753 has a nuclear ring-lens surrounded by a pseudoring, an intermediate spiral region, and finally an outer pseudoring (Crocker, Baugus & Buta, 1996). The arms are thin and have only small to moderate current star formation rate (Sandage & Bedke, 1994). We find that Mg2 increases steeply for this early-type galaxy in the inner 10 arcsec. Eskridge et al. (2003) found a similar rise in the (NUV – ) colour over this radial range. We find evidence for a bump in Mg2 at about 45 arcsec that seems to correspond to an outer ring of ongoing star formation, which contains many H ii regions. Neither the Mg2 bump at 45 arcsec, nor the change in slope at 10 arcsec, is reflected in the Fe5270 profile.
7.4 NGC 6814 - SAB(rs)bc
This galaxy has a thick bar and a grand design spiral structure (Márquez et al. 1999), whose spiral arms contain many H ii regions (Gonzalez Delgado et al. 1997). NGC 6814 is another Seyfert galaxy observed by Cid Fernandes et al. (1998). They found that the Mg I+Mg H feature was diluted by 22% in the nuclei, in agreement with a 20% decrease in the Mg2 EW we observe between 5 and 0 arcsec. The Fe5270 line-strength also appears significantly diluted in the nuclear region. The line strengths of both spectral features show moderate declines with radius.
7.5 NGC 6935 - (R)SA(r)a
This galaxy is highly circular with a boxy inner H ring, tightly wound spiral arms, and a small bright nucleus (Crocker, Baugus & Buta 1996). It is separated from NGC 6937 by 246 arcsec (Sandage & Bedke 1994) but the pair do not appear to be interacting. As mentioned above, there is good agreement between our central Fe5270 value and that from Idiart et al. (1996), whereas we obtain a slightly higher value for Mg2. The strengths of both indices show clear radial declines in the galactic disk and maxima at around 10 arcsec. Both indices decrease in the inner 10 arcsec, while Fe5270 drops significantly at a radius of few arcsec.
7.6 NGC 7213 - SA(s)0 LINER
This well-studied LINER/Seyfert galaxy has the highest surface brightness and earliest Hubble-type in our sample. NGC 7213 is also unique among our galaxies in having positive Mg2 and Fe5270 gradients in the disk.
Interestingly, Cid Fernandes et al. (1998) found no dilution of the Mg I+Mg H EW in the heart of NGC 7213, but strong dilution of features at shorter wavelengths. The EW of their Mg feature increases by about 50% from 25 arcsec to the nucleus. We found that our Mg2 ebbs at a radius of 15 arcsec before increasing by 35% (in EW) toward the core. Fe5270 shows much less pronounced enhancement toward the core but a comparable steep positive gradient in the outer disk. The positive gradients may be associated with a ring of H ii regions located at 20 40 arcsec in radius (Evans et al. 1996).
Corsini et al. (2003) note that the gaseous and stellar disks of NGC 7213 are decoupled within 40 arcsec. They point out that the H ii circumnuclear ring is not coincident with the stellar disk identified by Mulchaey, Regan & Kundu (1997). H i and H measurements reveal that NGC 7213 is a disturbed system undergoing a merger process that has warped its disk (Hameed et al. 2001) and may be responsible for the gaseous/stellar decoupling.
7.7 NGC 7412 - SAB(s)c
The radial line-strength gradients for NGC 7412 are fairly flat and featureless: possible evidence of smoothing due to the presence of the bar with length 30 arcsec (Saraiva Schroeder et al. 1994) . Photometry results from these authors show that the and colours are almost constant along the bar. Unfortunately, our estimated gradients are particularly uncertain for this galaxy due to large uncertainties in the background sky level.
7.8 NGC 7637 - SA(r)bc
This late-type galaxy (Corwin, de Vaucouleurs & de Vaucouleurs 1985) shows considerable radial variation in Mg2 and Fe5270. It is interacting with a companion at a distance of about 2.4 arcmin (evident in the corner of the image in Fig. 10) that is likely responsible for asymmetrical spiral arms and tidal features. We observe dips in both spectral indices at the galaxy core as expected for an AGN host, despite NGC 7637 not having a Seyfert classification. We note that Pastoriza, Donzelli & Bonatto (1999) have also postulated that this galaxy has an active nucleus, based on their analysis of its emission spectrum. Our results support this proposition.
The Mg2 and Fe5270 features do not trace each other perfectly. For instance, Mg2 declines sharply from 5 to 15 arcsec in radius followed by a bump at about 20 arcsec, whereas Fe5270 continues to fall from 5 to 20 arcsec with a possible bump around 25 30 arcsec. Further investigation is required to interpret the apparent offsets in the Mg2 and Fe5270 behaviour as a function of radius.
(a) (c)

(b) (d)

(a) (c)

(b) (d)

(a) (c)

(b) (d)

(a) (c)

(b) (d)

(a) (c)

(b) (d)

(a) (c)

(b) (d)

(a) (c)

(b) (d)

(a) (c)

(b) (d)

8 Summary
We have calibrated the technique of absorption line imaging with the Anglo-Australian Telescope’s Taurus Tunable Filter using Lick standard stars and have demonstrated the sensitivity of this method to the behaviour of Mg2 and Fe5270 absorption features across the face of disk galaxies. The variation of Mg2 and Fe5270 line-strengths as a function of radius is presented for a sample of eight galaxies. The greatest source of uncertainty in our derived line-strength gradients is associated with background sky subtraction. As well as yielding overall line-strength gradients, the detailed shapes of the profiles may reveal phenomena including merger-induced star formation (NGC 7213), H ii rings (NGC 6753 and NGC 7213) and galactic bars (NGC 7412). There is also evidence that NGC 7637 hosts an active galactic nucleus. Conversion of the line-strengths presented in this paper into absolute abundances involves stellar population synthesis modelling, which will be the subject of the second paper in this series. Ultimately, the inferred relative abundances of Mg and Fe can be used to piece together star formation histories and galactic chemical evolution.
Future generations of tunable filters on larger telescopes will be more sensitive to stellar absorption features, enabling this type of study to be extended to lower surface brightness galaxies. Moreover, greater sensitivity will minimise the importance of azimuthal averaging in order to achieve acceptable signal-to-noise. This will facilitate comparisons between arm and interarm regions, thus providing insight into the mechanism of spiral arm triggered star formation.
Acknowledgements
We wish to acknowledge our gratitude to Joss Bland-Hawthorn, for first suggesting this avenue of research. We are grateful to the staff of the Anglo-Australian Observatory for maintaining this unique facility, to the Isaac Newton Group of Telescopes (La Palma) for the use of their f126 blocking filter, and to the Australian Time Assignment Committee (ATAC) for awarding us the time to prove this technique. Financial support from the Australian Research Council (ARC) is gratefully acknowledged. This research has made use of NASA’s Astrophysics Data System Bibliographic Services (ADS), the HyperLeda database (http://leda.univ-lyon1.fr), as well as the NASA/IPAC Extragalactic Database (NED) which is operated by the Jet Propulsion Laboratory, California Institute of Technology, under contract with the National Aeronautics and Space Administration. YF thanks the Australian Federation of University Women (SA) for their support through the Daphne Elliot Bursary.
References
- Beauchamp & Hardy (1997) Beauchamp D., Hardy E., 1997, AJ, 113, 1666
- Bland-Hawthorn & Jones (1998) Bland-Hawthorn J., Jones D. H., 1998, PASA, 15, 44
- Bland-Hawthorn & Kedziora-Chudczer (2003) Bland-Hawthorn J., Kedziora-Chudczer L., 2003, PASA, 20, 242
- Cid Fernandes et al. (1998) Cid Fernandes R. J., Storchi-Bergmann T., Schmitt H. R., 1998, MNRAS, 297, 579
- Cohen, Blakeslee & Côté (2003) Cohen J. G., Blakeslee J. P., Côté P., 2003, ApJ, 592, 866
- Corsini et al. (2003) Corsini E. M., Pizzella A., Coccato L., Bertola F., 2003, A&A, 408, 873
- Corwin, de Vaucouleurs & de Vaucouleurs (1985) Corwin H.G., de Vaucouleurs A., de Vaucouleurs G., 1985, Southern Galaxy Catalogue. Univ. Texas, Austin
- Crocker, Baugus & Buta (1996) Crocker D. A.,, Baugus P. D., Buta R., 1996, ApJS, 105, 353
- de Vaucouleurs et al. (1991) de Vaucouleurs G., de Vaucouleurs A., Corwin H. G., Buta R. J., Paturel G., Fouqué P., 1991, Third Reference Catalogue of Bright Galaxies. Springer-Verlag, New York
- Eskridge et al. (2003) Eskridge P. B. et al., 2003, ApJ, 586, 923
- Evans et al. (1996) Evans I. N., Koratkar A. P., Storchi-Bergmann T., Kirkpatrick H., Heckman T. M., Wilson A. S., 1996, ApJS, 105, 93
- Faber et al. (1985) Faber S. M., Friel E. D., Burstein D., Gaskell C. M., 1985, ApJS, 57, 711
- Fisher, Franx & Illingworth (1996) Fisher D., Franx M., Illingworth G., 1996, ApJ, 459, 110
- Friel & Janes (1993) Friel E. D., Janes K. A., 1993, A&A, 267, 75
- Gilmore et al. (1995) Gilmore G., Wyse R. F. G., Jones B. J., 1995, AJ, 109, 1095
- Gonzalez Delgado et al. (1997) Gonzalez Delgado R. M., Perez E., Tadhunter C., Vilchez J. M., Rodriguez-Espinosa J. M., 1997, ApJS, 108, 155
- Hameed et al. (2001) Hameed S., Blank D. L., Young L. M., Devereux N., 2001, ApJ, 546, L97
- Hamuy et al. (1992) Hamuy M., Walker A. R., Suntzeff N. B., Gigoux P., Heathcote S. R., Phillips M. M., 1992, PASP, 104, 533
- Henry & Worthey (1999) Henry R. B. C., Worthey G., 1999, PASP, 111, 919
- Huchra et al. (1996) Huchra J. P., Brodie J. P., Caldwell N., Christian C., Schommer R., 1996, ApJS, 102, 29
- Idiart, de Freitas Pacheco & Costa (1996) Idiart T. P., de Freitas Pacheco J. A., Costa R. D. D., 1996, AJ, 112, 2541
- Jablonka, Gorgas, & Goudfrooij (2002) Jablonka P., Gorgas J., Goudfrooij P., 2002, Ap&SS, 281, 367
- Jones et al. (2002) Jones D. H., Shopbell P. L., Bland-Hawthorn J., 2002, MNRAS, 329, 759
- Koribalski & Dickey (2004) Koribalski B., Dickey J. M., 2004, MNRAS, 348, 1255
- Maloney & Bland-Hawthorn (2001) Maloney P. R., Bland-Hawthorn J., 2001, ApJ, 553, L129
- Márquez et al. (1999) Márquez I. et al., 1999, A&AS, 140, 1
- Martin (1998) Martin P., 1998, in Friedli D., Edmunds M. G., Robert C., Drissen L., eds, ASP Conf. Ser. Vol. 147, Abundance Profiles: Diagnotic Tools for Galaxy History. Astron. Soc. Pac., San Francsico, p.68
- Mollá et al. (1999) Mollá M., Hardy E., Beauchamp D., 1999, ApJ, 513, 695
- Mulchaey, Regan & Kundu (1997) Mulchaey J. S., Regan M. W., Kundu A., 1997, ApJS, 110, 299
- Pastoriza, Donzelli & Bonatto (1999) Pastoriza M. G., Donzelli C. J., Bonatto C., 1999, A&A, 347, 55
- Proctor & Sansom (2002) Proctor R. N., Sansom A. E., 2002, MNRAS, 333, 517
- Raimann et al. (2001) Raimann D., Storchi-Bergmann T., Bica E., Alloin D., 2001, MNRAS, 324, 1087
- Ryder (1995) Ryder S. D., 1995, ApJ, 444, 610
- Sandage & Bedke (1994) Sandage A., Bedke J., 1994, The Carnegie Atlas of Galaxies (Washington: Carnegie Inst.)
- Saraiva Schroeder et al. (1994) Saraiva Schroeder M. F., Pastoriza M. G., Kepler S. O., Puerari I., 1994, A&AS, 108, 41
- Shaver et al. (1983) Shaver P. A., McGee R. X., Newton L. M., Danks A. C., Pottasch S. R., 1983, MNRAS, 204, 5
- Trager et al. (1998) Trager S. C., Worthey G., Faber S. M., Burstein D., González J. J., 1998, ApJS, 116, 1
- Tripicco & Bell (1995) Tripicco M. J., Bell R. A., 1995, AJ, 110, 3035
- Vila-Costas & Edmunds (1992) Vila-Costas M. B., Edmunds M. G., 1992, MNRAS, 259, 121
- Worthey et al. (1994) Worthey G., Faber S. M., Gonzalez J. J., Burstein D., 1994, ApJS, 94, 687
- Worthey (2004) Worthey G., 2004, AJ, 128, 2826
- Zaritsky et al. (1994) Zaritsky D., Kennicutt R. C., Huchra J. P., 1994, ApJ, 420, 87
Appendix A Mg2 and Fe5270 radial profiles for eight galaxies
| Radius | Mg2 | Fe5270 |
|---|---|---|
| (arcsec) | (mag) | () |
| 0.0 | 0.223 0.031 | 3.22 0.38 |
| 3.3 | 0.229 0.031 | 3.40 0.41 |
| 7.59 | 0.253 0.033 | 3.52 0.45 |
| 11.88 | 0.234 0.035 | 3.04 0.47 |
| 16.17 | 0.229 0.037 | 2.82 0.49 |
| 20.46 | 0.225 0.039 | 2.83 0.52 |
| 24.75 | 0.177 0.042 | 2.29 0.58 |
| 29.04 | 0.184 0.044 | 2.71 0.64 |
| 33.33 | 0.189 0.050 | 2.42 0.73 |
| 37.62 | 0.167 0.055 | 2.43 0.85 |
| 41.91 | 0.157 0.061 | 2.49 0.92 |
| 46.20 | 0.141 0.069 | 2.61 1.03 |
| 50.49 | 0.192 0.083 | 3.33 1.25 |
| 54.78 | 0.198 0.105 | 2.60 1.59 |
| 59.07 | 0.223 0.129 | 3.33 1.99 |
| Radius | Mg2 | Fe5270 |
|---|---|---|
| (arcsec) | (mag) | () |
| 0.0 | 0.168 0.033 | 1.95 0.31 |
| 3.3 | 0.164 0.034 | 1.70 0.32 |
| 7.59 | 0.187 0.035 | 1.15 0.32 |
| 11.88 | 0.183 0.037 | 1.61 0.36 |
| 16.17 | 0.176 0.039 | 1.59 0.38 |
| 20.46 | 0.176 0.041 | 1.30 0.40 |
| 24.75 | 0.149 0.043 | 1.46 0.46 |
| 29.04 | 0.141 0.045 | 1.35 0.49 |
| 33.33 | 0.178 0.048 | 0.98 0.51 |
| 37.62 | 0.166 0.051 | 1.32 0.56 |
| 41.91 | 0.159 0.053 | 0.90 0.57 |
| 46.20 | 0.166 0.054 | 0.80 0.62 |
| 50.49 | 0.173 0.057 | 0.54 0.64 |
| 54.78 | 0.169 0.057 | 1.19 0.64 |
| 59.07 | 0.162 0.063 | 1.09 0.69 |
| Radius | Mg2 | Fe5270 |
|---|---|---|
| (arcsec) | (mag) | () |
| 0.0 | 0.396 0.032 | 2.58 0.37 |
| 3.3 | 0.320 0.032 | 2.82 0.38 |
| 7.59 | 0.265 0.032 | 2.59 0.38 |
| 11.88 | 0.240 0.033 | 2.91 0.41 |
| 16.17 | 0.243 0.033 | 2.62 0.42 |
| 20.46 | 0.235 0.035 | 2.28 0.45 |
| 24.75 | 0.236 0.036 | 2.36 0.49 |
| 29.04 | 0.233 0.037 | 2.05 0.53 |
| 33.33 | 0.228 0.040 | 2.27 0.63 |
| 37.62 | 0.238 0.045 | 2.40 0.76 |
| 41.91 | 0.266 0.051 | 2.37 0.92 |
| 46.20 | 0.271 0.055 | 2.14 1.05 |
| 50.49 | 0.250 0.058 | 2.57 1.11 |
| 54.78 | 0.213 0.061 | 1.87 1.22 |
| 59.07 | 0.218 0.068 | 1.99 1.39 |
| Radius | Mg2 | Fe5270 |
|---|---|---|
| (arcsec) | (mag) | () |
| 0.0 | 0.226 0.031 | 1.00 0.27 |
| 3.3 | 0.283 0.032 | 2.01 0.33 |
| 7.59 | 0.273 0.034 | 2.11 0.37 |
| 11.88 | 0.239 0.036 | 1.83 0.42 |
| 16.17 | 0.254 0.039 | 2.37 0.49 |
| 20.46 | 0.241 0.039 | 2.13 0.50 |
| 24.75 | 0.236 0.040 | 1.70 0.52 |
| 29.04 | 0.208 0.043 | 1.51 0.59 |
| 33.33 | 0.233 0.046 | 1.52 0.65 |
| 37.62 | 0.241 0.052 | 0.81 0.79 |
| 41.91 | 0.248 0.062 | 1.69 0.98 |
| 46.20 | 0.282 0.071 | 0.87 1.19 |
| 50.49 | 0.207 0.080 | 1.43 1.35 |
| 54.78 | 0.249 0.089 | 1.34 1.48 |
| 59.07 | 0.208 0.098 | 1.60 1.68 |
| Radius | Mg2 | Fe5270 |
|---|---|---|
| (arcsec) | (mag) | () |
| 0.0 | 0.294 0.031 | 2.42 0.36 |
| 2.31 | 0.283 0.032 | 1.83 0.35 |
| 4.62 | 0.297 0.032 | 2.37 0.38 |
| 6.93 | 0.302 0.033 | 2.60 0.40 |
| 9.24 | 0.322 0.033 | 2.54 0.41 |
| 11.55 | 0.311 0.034 | 2.62 0.42 |
| 13.86 | 0.298 0.034 | 2.69 0.43 |
| 16.17 | 0.269 0.035 | 2.15 0.42 |
| 18.48 | 0.250 0.035 | 2.50 0.44 |
| 20.79 | 0.246 0.036 | 2.19 0.44 |
| 23.10 | 0.268 0.038 | 1.96 0.47 |
| 25.41 | 0.260 0.041 | 2.25 0.53 |
| 27.72 | 0.268 0.045 | 2.28 0.57 |
| 30.03 | 0.264 0.049 | 1.89 0.63 |
| 32.34 | 0.241 0.052 | 1.76 0.69 |
| 34.65 | 0.258 0.058 | 1.67 0.77 |
| 36.96 | 0.288 0.065 | 2.01 0.86 |
| 39.27 | 0.271 0.073 | 2.32 0.97 |
| 41.58 | 0.296 0.087 | 1.66 1.14 |
| 43.89 | 0.333 0.105 | 1.71 1.41 |
| 46.20 | 0.285 0.120 | 2.26 1.60 |
| 48.51 | 0.346 0.141 | 1.77 1.85 |
| 50.82 | 0.370 0.160 | 0.51 2.13 |
| 53.13 | 0.304 0.179 | 1.10 2.38 |
| 55.44 | 0.340 0.208 | 1.88 2.73 |
| 57.75 | 0.361 0.241 | 2.32 2.84 |
| Radius | Mg2 | Fe5270 |
|---|---|---|
| (arcsec) | (mag) | () |
| 0.0 | 0.231 0.031 | 1.67 0.30 |
| 3.3 | 0.232 0.031 | 1.71 0.30 |
| 7.59 | 0.202 0.031 | 1.64 0.31 |
| 11.88 | 0.177 0.031 | 1.37 0.30 |
| 16.17 | 0.175 0.032 | 1.48 0.34 |
| 20.46 | 0.187 0.034 | 1.61 0.39 |
| 24.75 | 0.187 0.036 | 1.33 0.46 |
| 29.04 | 0.200 0.040 | 1.51 0.57 |
| 33.33 | 0.210 0.044 | 1.78 0.67 |
| 37.62 | 0.204 0.049 | 2.00 0.78 |
| 41.91 | 0.235 0.055 | 1.69 0.91 |
| 46.20 | 0.243 0.061 | 2.20 1.05 |
| 50.49 | 0.246 0.070 | 2.39 1.20 |
| 54.78 | 0.278 0.079 | 2.82 1.37 |
| 59.07 | 0.307 0.090 | 2.95 1.57 |
| Radius | Mg2 | Fe5270 |
|---|---|---|
| (arcsec) | (mag) | () |
| 0.0 | 0.158 0.034 | 1.99 0.35 |
| 3.3 | 0.154 0.037 | 2.03 0.40 |
| 7.59 | 0.145 0.043 | 1.93 0.51 |
| 11.88 | 0.149 0.048 | 1.96 0.61 |
| 16.17 | 0.136 0.054 | 2.04 0.70 |
| 20.46 | 0.152 0.060 | 1.90 0.80 |
| 24.75 | 0.136 0.063 | 2.00 0.86 |
| 29.04 | 0.147 0.066 | 1.80 0.90 |
| 33.33 | 0.163 0.067 | 1.70 0.91 |
| 37.62 | 0.138 0.071 | 1.55 0.96 |
| 41.91 | 0.140 0.082 | 2.23 1.12 |
| 46.20 | 0.118 0.100 | 1.46 1.43 |
| 50.49 | 0.133 0.128 | 1.66 1.84 |
| 54.78 | 0.157 0.173 | 1.87 2.41 |
| 59.07 | 0.137 0.230 | 1.06 3.28 |
| Radius | Mg2 | Fe5270 |
|---|---|---|
| (arcsec) | (mag) | () |
| 0.0 | 0.237 0.031 | 2.20 0.33 |
| 3.3 | 0.253 0.032 | 2.94 0.37 |
| 7.59 | 0.233 0.033 | 2.65 0.39 |
| 11.88 | 0.193 0.034 | 2.50 0.42 |
| 16.17 | 0.196 0.036 | 1.93 0.43 |
| 20.46 | 0.219 0.038 | 1.79 0.49 |
| 24.75 | 0.210 0.041 | 2.52 0.56 |
| 29.04 | 0.187 0.044 | 2.41 0.63 |
| 33.33 | 0.178 0.051 | 2.25 0.80 |
| 37.62 | 0.232 0.064 | 3.39 1.00 |
| 41.91 | 0.225 0.071 | 2.43 1.18 |
| 46.20 | 0.200 0.090 | 2.73 1.52 |
| 50.49 | 0.205 0.101 | 3.47 1.75 |
| 54.78 | 0.209 0.112 | 2.91 1.95 |
| 59.07 | 0.203 0.141 | 4.42 2.38 |