STRONG SPATIAL CLUSTERING OF UV-SELECTED GALAXIES WITH MAGNITUDE AND REDSHIFT 11affiliation: Based, in part, on data obtained at the W.M. Keck Observatory, which is operated as a scientific partnership between the California Institute of Technology, the University of California, and NASA, and was made possible by the generous financial support of the W.M. Keck Foundation.
Abstract
We obtained deep near-infrared images within four high-redshift survey fields, measured the magnitudes of 300 optically selected galaxies with spectroscopic redshift , and compared the spatial clustering strength of galaxies with and . We found at greater than % confidence that the brighter galaxies cluster more strongly. The best-fit correlation lengths for the bright and faint samples are and comoving Mpc, respectively (), although the unusual density of bright QSOs in one of our survey fields may imply that the result is not representative of the universe as a whole. Neglecting this possibility, the correlation length for the optically selected sample with agrees well with that reported for comparably bright near-IR-selected samples. The differences in correlation length between optically selected and near-IR-selected samples have been presented as evidence that the two techniques find orthogonal populations of high-redshift galaxies. Our results favor a more nuanced view.
Subject headings:
galaxies: high-redshift — cosmology: large-scale structure of the universe1. INTRODUCTION
Near-infrared (IR) surveys of the high-redshift universe (Cimatti et al. 2002, Franx et al. 2003, Abraham et al. 2004) were designed to find passively evolving galaxies that had been missed by optical surveys, but they also uncovered an intriguing population of galaxies whose star-formation rates yr-1 and stellar masses dwarfed those of optically-selected galaxies. Since these star-forming galaxies have the properties expected for the progenitors of giant elliptical galaxies, many researchers have begun to assume that near-IR surveys find the progenitors of ellipticals, that optical surveys find the progenitors of less massive local galaxies, and (by extension) that the high-redshift universe is divided into two distinct star-forming populations with divergent evolutionary paths.
Although some of the near-IR-selected galaxies clearly do not satisfy common optical selection criteria (see, e.g., Daddi et al. 2004; Forster-Schreiber et al. 2004; van Dokkum et al. 2004), the evidence for two distinct star-forming populations still leaves room for doubt. First, the differences in mean stellar masses and star-formation rates might simply reflect the fact that near-IR surveys tend to be shallower than optical surveys, detecting only the brightest tip of the luminosity distribution. Since the near-IR-selected star-forming galaxies are less numerous than optically selected galaxies, a significant fraction of them could be present in optical surveys without changing the mean properties of optical sources in an appreciable way. The unusual measured properties of bright near-IR galaxies do not imply that they are absent from optical surveys any more than the high mean income of Luxembourgers implies that they are a previously undiscovered population in the E. U. Second, sub-millimeter surveys show that the majority of the most rapidly star-forming galaxies at high redshift are bright enough and blue enough to be included in existing optical surveys (e.g., Chapman et al. 2005; see their Figure 6). Finally, there are physical reasons to believe that at least some of the elliptical galaxies in the local universe descended from the objects detected in optical surveys. Ellipticals are the only local galaxies that have the spatial distribution expected for the descendants of optically selected star-forming galaxies at , for example (see Adelberger et al. 2005).
Partly in order to help clarify the connection between optical and near-IR populations, our group has obtained images throughout the course of its optical surveys at . Recent analyses of the images (Erb et al. 2005, in preparation) reveal that many optically-selected high-redshift galaxies have the magnitudes characteristic of the supposedly distinct bright near-IR-selected populations. Shapley et al. (2004) showed that these optically-selected galaxies with have star-formation rates, stellar masses, and metallicities similar to those of star-forming galaxies in near-IR-selected surveys to . This suggested that there might be substantial overlap between near-IR and optical populations at high redshift, a conclusion reinforced by their estimate that the number density of high-redshift galaxies with in optically-selected surveys is at least half as large as the number density reported by near-IR surveys. Daddi et al. (2004, 2005) reached a similar conclusion from a different starting point.
The present paper extends the work of Shapley et al. (2004) in a small way by showing that optically-selected galaxies at with bright magnitudes cluster as strongly as their near-IR-selected counterparts. This suggests that the -bright star-forming galaxies detected in optical surveys may not be enormously different from the -bright star-forming galaxies that are missed. We will discuss the implications further in § 5, after first describing our data in § 2, our method for measuring in § 3, and our raw results in § 4.
2. DATA
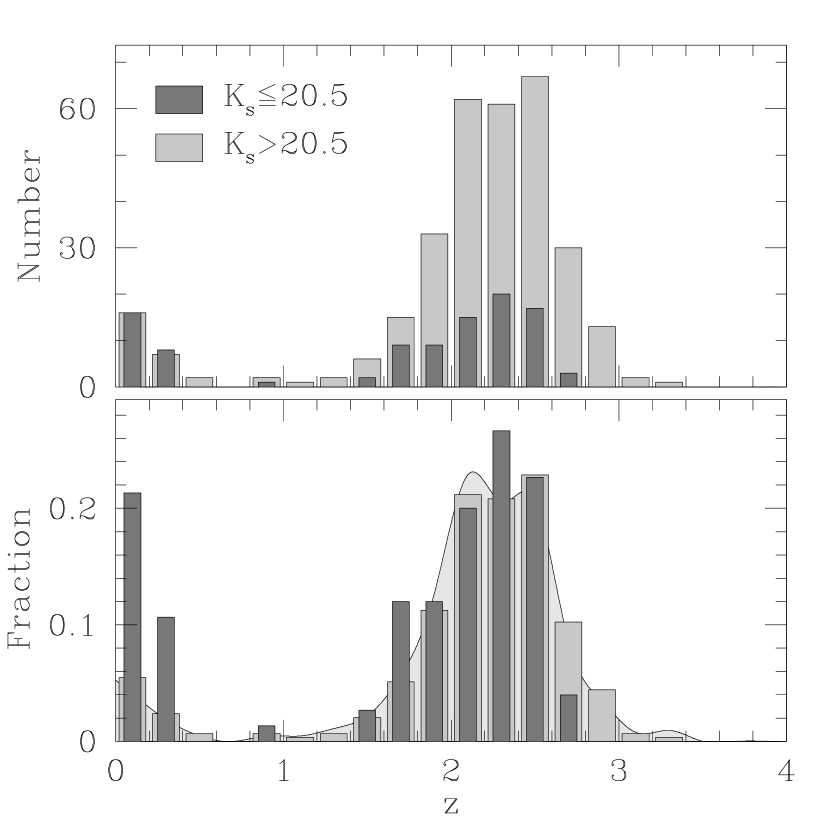
The galaxies we studied lie within the fields GOODS-N, Q1623, Q1700, and Q2343 of the spectroscopic survey of Steidel et al. (2004). Steidel et al. (2004) obtained images of these fields, constructed a catalog of objects with AB-magnitude whose colors satisfied the “BX” selection criteria of Adelberger et al. (2004), measured spectroscopic redshifts for several hundred of the objects in this catalog, and, after excluding objects with , found that the mean redshift and r.m.s. dispersion agreed well with the range targeted by the photometric selection criteria. To measure the near-IR magnitudes of some of the galaxies in the catalog, we (Erb et al. 2005, in preparation) subsequently used the Wide-Field Infrared Camera (WIRC; Wilson et al. 2003) on the Hale 5m telescope to obtain a deep image (hr integration time, point-source detection threshold of in the Vega system) of a roughly region within the larger optically-observed area in each of the four fields. A total of 1598 objects in the photometric BX catalogs of Steidel et al. (2004) fell within the areas observed with WIRC. We restrict our analysis to the 368 of these sources that have measured redshifts. Most (300) of the sources with redshifts were detected in at significance or better, and 75 were brighter than the threshold that we use below to divide our sample into bright and faint subsamples. See table 1; all near-IR magnitudes here and elsewhere are in the Vega system, and all optical magnitudes are AB. was chosen because it was the brightest threshold that left us with enough objects in the bright subsample; only 20 objects satisfy the threshold . The redshift distributions for the bright and faint subsamples are shown in figure 1.
| Name | aaArea imaged in and observed spectroscopically, square arcmin | bbArea imaged in and observed spectroscopically, square arcmin | ccNumber of sources in the BX catalog that fall within the image and have spectroscopic redshifts . | ddNumber of sources in the BX catalog that are detected in the image at confidence and have spectroscopic redshifts . | eeNumber of sources in the BX catalog with (Vega system) and spectroscopic redshifts . |
|---|---|---|---|---|---|
| GOODS-N | 84 | 60 | 10 | ||
| Q1623 | 121 | 98 | 30 | ||
| Q1700 | 62 | 57 | 13 | ||
| Q2343 | 101 | 85 | 22 | ||
| total | 368 | 300 | 75 |
The total number of galaxies in our subsamples would be significantly higher if our spectroscopy were 100% complete. Since the fraction of spectroscopically observed BX candidates that have is roughly , , for , , , we estimate from the apparent magnitude distribution of all BX candidates that the total number of BX candidates in our fields with is 1000, 200, 80 for the same three magnitude ranges. Although our spectroscopy is far from complete, our spectroscopic catalog of galaxies with is already about an order of magnitude larger than any near-IR selected catalog in the same redshift range.
3. METHODS
We estimated the correlation lengths of the samples with two approaches. Both were based on counting the observed number of galaxy pairs with comoving radial separation and comparing to the number expected for a reduced correlation function of the form . Letting denote the comoving distance to redshift and adopting the shorthand , we counted the observed number of pairs in the each field with radial separation and summed over fields to get , the total number of pairs with .
If the selection function is accurately known, the expected number of pairs with can be estimated for any assumed value of . Suppose we know that the th galaxy in a field has redshift and that the th galaxy lies at an angular separation of . Then the probability that the unknown redshift will satisfy is (Adelberger 2005)
| (1) |
where is the change in comoving distance with redshift, is the change in comoving distance with angle, is the angular diameter distance, , is the beta function in the convention of Press et al. (1992), and is related to the incomplete beta function of Press et al. (1992) through with . The expected number of pairs with is equal to the sum of the probabilities for each unique pair,
| (2) |
where the sum includes only pairs in which both galaxies lie in the same field.
Our first approach towards estimating is to find the value that makes the expected number of pairs equal the observed number . By summing over the pair counts in all fields when calculating and , we are implicitly assuming that the selection function does not vary appreciably from one field to the next. The estimated values of will be incorrect if this is not the case, but the analysis is otherwise insensitive to variations in data quality from field to field.
Even if the selection function is reasonably constant among the fields, as it probably is, the inferred value of will still depend sensitively on its assumed shape (Adelberger 2005). This is the major weakness of equation 2. An alternative is to remove the sensitivity to the selection function by dividing the number of pairs with by the number with . As shown by Adelberger et al. (2005), the expectation value of this quotient is
| (3) |
where and , regardless of the selection function, as long as the angular diameter distance changes slowly with redshift, is significantly larger than the comoving uncertainty in a galaxy’s radial position, is significantly smaller than the selection function’s width, and is large enough that . Our second approach to estimating is to find the value that makes the right-hand side of equation 3 equal the observed quantity . The estimate of from this approach is barely affected by even major changes in data quality from one field to the next.
Although this insensitivity is a significant advantage, the disadvantage of the second approach is that it can be noisy. We adopt both approaches because one is less susceptible to systematic errors and the other is less susceptible to random. See Adelberger (2005) for further discussion.
In both approaches we adopt Mpc, considerably larger than the biggest plausible peculiar velocity or redshift measurement error, and assume that the correlation function has the slope of measured from a larger sample of similar galaxies by Adelberger et al. (2005). Adopting instead would lower our derived correlation lengths by less than 10%. Eliminating pairs with (e.g., Adelberger 2005) does not significantly alter the results.
4. RESULTS
Equations 2 and 3 lead to the estimates , comoving Mpc for the subsample with and and , comoving Mpc for the subsample with . To calculate the significance of the observed difference between the two samples’ correlation lengths, we split our full 368-object sample into two parts at random, rather than according to magnitude, measured the difference in between the two parts, then repeated the process over and over, with a different random splitting each time, to estimate the distribution of under the null hypothesis that is unrelated to magnitude. Each random splitting placed 75 of our 368 objects in one subsample and 293 in another, mimicking the 75/293 division of the actual splitting at . We observed a difference in as large as the observed difference in fewer than % of the randomized catalogs, implying that the observed difference is significant at better than 95% confidence.
We used two approaches to estimate the size of the uncertainties in the correlation lengths for the two samples. First, we measured the dispersion in the the best-fit value of from each individual field. Although in principle this empirical approach should work well, in practice is poorly determined in individual fields and the field-to-field dispersion in is poorly determined since there are only four fields.
Second, we broke our observed bright and faint catalogs into many smaller sub-catalogs by rejecting a random fraction – of the sources, observed how the dispersion in the best-fit value among the sub-catalogs depended on the number of objects in the catalog, and extrapolated to the full catalog sizes.
We adopt compromise values for the standard deviation in our final estimates for the confidence intervals for the two analyses (eq. 2 and 3) of the two catalogs, , comoving Mpc for and , comoving Mpc for . The consistency of the answers for the two approaches suggests that systematic problems are minimal. We will adopt the the results from eq. 2 for the remainder of the paper, since that equation is subject to smaller random uncertainties.
To verify that the high value of for the bright sample reflected genuine large-scale clustering, rather than (say) the presence of merging sub-units within individual halos, we repeated the analysis after excluding all pairs with (i.e., projected separation comoving Mpc) from the calculation in equations 2 and 3. The best-fit values of were not significantly altered.
5. DISCUSSION
Our analysis of the largest existing spectroscopic sample of galaxies with at redshift confirms previous reports (Daddi et al. 2004) that these galaxies are strongly clustered. Their estimated correlation length of Mpc significantly exceeds that of normal galaxies at high or low redshift (e.g., Adelberger et al. 2005, Budavari et al. 2003). The exact value of the correlation length at may be more uncertain than this number implies, since the Daddi et al. (2004) sample is so small (see Adelberger 2005) and since much of our signal comes from a field (Q1623; see figure 2) which contains an unusual concentration of bright QSOs at 111These QSOs are not in the BX sample. The sample analyzed here contains only 3 QSOs, and their clustering does not significantly affect the results. The point is that our surveyed volume may not be a fair sample of the universe, since one of our fields contains one of the richest known concentrations of bright QSOs., but the increase of clustering strength with luminosity has been established with high significance (%; see § 4).
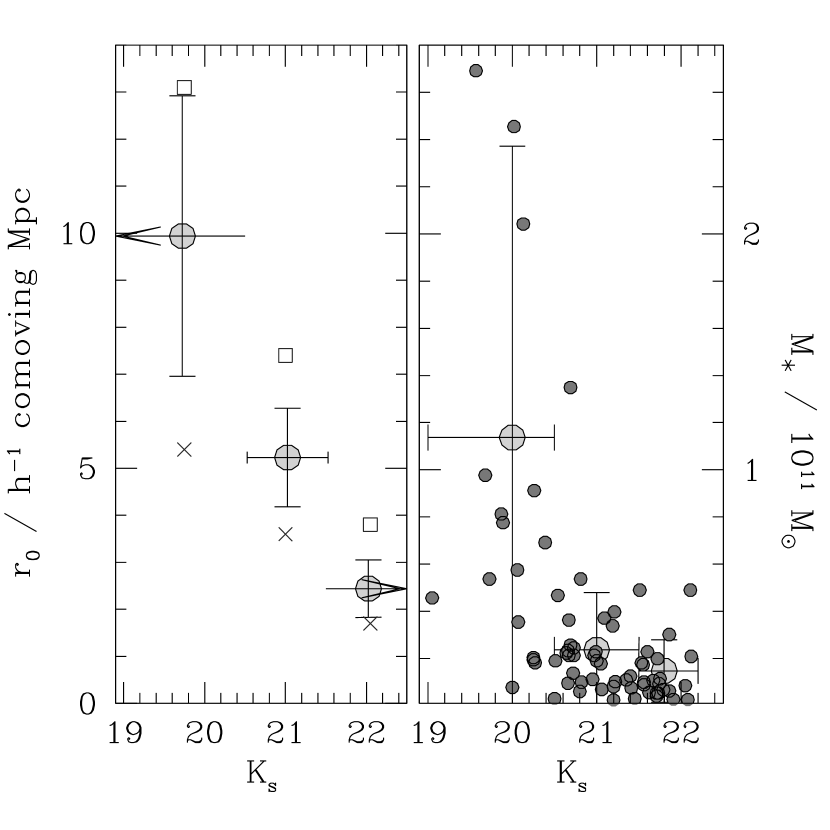
The results of this paper, coupled with those of Shapley et al. (2004), suggest that star-forming galaxies in optically-selected and near-IR-selected high-redshift surveys have similar properties when the surveys are restricted to a common magnitude limit . Galaxies with undoubtedly make up a larger fraction of the sources in the near-IR surveys, but they do not seem to be a fundamentally different population. The left panel of figure 2 shows, for example, that their large correlation lengths reflect the culmination of a trend that is apparent among the fainter galaxies that dominate optical surveys. Although existing optical surveys do not detect every star-forming galaxy with , the fraction they find appears to be reasonably representative of the whole.
Since and are correlated in our sample, the relationship between and implies relationship between and . We find that increases from Mpc at to Mpc at . A correlation of with both and could result from an underlying correlation between and stellar mass , since and are both correlated with (Shapley et al. 2005, in preparation). An underlying correlation with could also explain why varies so strongly with . Spitzer Space Telescope observations analyzed by Shapley et al. (2005, in preparation) show that mass-to-light ratios in our sample increase significantly with luminosity, which implies that is a strong function of (see the right panel of figure 2). The very high stellar masses associated with can only be produced in unusually massive potential wells that formed unusually early, and these are exactly the potential wells that ought to be most strongly clustered. The increase of with -luminosity may simply reflect the fact that galaxies in proto-cluster environments formed earlier and were consequently able to convert more of their baryons into stars by . Steidel et al. (2005, in preparation) discuss the point in more detail.
The strong dependence of galaxy properties on magnitude can be viewed in two ways. On the one hand, since galaxies with are not representative of the high-redshift population as a whole, conclusions from bright near-IR-selected surveys probably apply to only a limited subset of galaxies. These galaxies are not irrelevant, since they are plausible progenitors for the rarest and most massive ellipticals in the local universe, but their properties should not be ascribed to the dominant fainter population. On the other hand, the extreme properties of galaxies with may help reveal trends that are difficult to discern in fainter samples, and these trends could provide useful insight into the physics of galaxy formation. Exploring the second possibility will require extensive catalogs of high redshift galaxies with . The ability of optical surveys to find them in large numbers is surely good news.
We thank the referee, A. Cimatti, for two detailed reports. KLA and AES were supported by fellowships from the Carnegie Institute of Washington and the Miller Foundation. DKE, NAR, and CCS were supported by grant AST 03-07263 from the National Science Foundation and by a grant from the Packard Foundation. Section 3 was written in Port of Spain’s Normandie Hotel, which KLA thanks for remarkable hospitality.
References
- (1) Adelberger, K.L., Steidel, C.C., Shapley, A.E., Hunt, M.P., Erb, D.K., Reddy, N.A., & Pettini, M. 2004, ApJ, 607, 226
- (2) Adelberger, K.L., Steidel, C.C., Pettini, M., Shapley, A.E., Reddy, N.A., & Erb, D.K. 2005, ApJ, in press
- (3) Adelberger, K.L. 2005, ApJ, in press
- (4) Budavári, T. et al. 2003, ApJ, 595, 59
- (5) Chapman, S.C., Blain, A.W., Smail, I., & Ivison, R.J. 2005, ApJ, in press
- (6) Cimatti, G. et al. 2002, A&A, 392, 395
- (7) Daddi, E., Röttgering, H.J.A., Labbé, I., Rudnick, G., Franx, M., Moorwood, A.F.M., Rix, H.W., van den Werf, P.P., & van Dokkum, P.G. 2003, ApJ, 588, 50
- (8) Daddi, E., Cimatti, A., Renzini, A., Fontana, A., Mignoli, M., Pozzetti, L., Tozzi, P., & Zamorani, G. 2004, ApJ, 617, 746
- (9) Forster-Schreiber, N.M. et al. 2004, ApJ, 616, 40
- (10) Franx, M. et al. 2003, ApJ, 587, L79
- (11) Press, W. H., Flannery, B. P., Teukolsky, S. A., & Vetterling, W. T. 1992, “Numerical Recipes in C”, (Cambridge: Cambridge University Press)
- (12) Shapley, A.E., Erb, D.K., Pettini, M., Steidel, C.C., & Adelberger, K.L. 2004, ApJ, 612, 108
- (13) Steidel, C.C., Adelberger, K.L., Shapley, A.E., Pettini, M., Dickinson, M., & Giavalisco, M. 2003, ApJ, 592, 728
- (14) Steidel, C.C., Shapley, A.E., Pettini, M., Adelberger, K.L., Erb, D.K., Reddy, N.A., & Hunt, M.P. 2004, ApJ, 604, 534
- (15) van Dokkum, P.G. et al. 2004, ApJ, 611, 703
- (16) Wilson, J.C. et al. 2003, SPIE, 4841, 451