Six months of mass outflow and inclined rings in the ejecta of V1494 Aql
Abstract
V1494 Aql was a very fast nova which reached a visual maximum of m4.0 by the end of 1999 December 3. We report observations from 4 to 284 days after discovery, including sub–mm– and cm–band fluxes, a single MERLIN image, and optical spectroscopy in the 410 to 700 nm range. The extent of the radio continuum emission is consistent with a recent lower distance estimate of 1.6 kpc. We conclude that the optical and radio emission arises from the same expanding ejecta. We show that these observations are not consistent with simple kinematical spherical shell models used in the past to explain the rise and fall of the radio flux density in these objects. The resolved remnant structure is consistent with an inclined ring of enhanced density within the ejecta. Optical spectroscopy indicates likely continued mass ejection for over 195 days, with the material becoming optically thin in the visible sometime between 195 and 285 days after outburst.
keywords:
stars: individual: V1494 Aql – novae, cataclysmic variables – stars: winds, outflows – radio continuum: stars1 Introduction
When a classical nova undergoes an eruption, the initial visual brightening is accompanied by the ejection of perhaps 10-5 to 10-4 M⊙ of matter. This expands away from the central binary, and as the visual light starts to decline the increasing solid angle of the ionised ejecta leads to steadily rising, optically thick, thermal radio emission. As the remnant expands the emission becomes optically thin at ever longer wavelengths, and fades below detectability. This process is understood in general terms, but the development of structure in the remnant observed a few months after outburst is still unclear. Asymmetric ejection, intra–ejecta interaction and the influence of the binary companion all have a role to play.
Much still needs to be done observationally to constrain these models. Examining the very early development of the remnant is one means by which this is currently taking place. Radio observations hold out the possibility of imaging the remnant structure at very early times, particularly with MERLIN providing 50 mas resolution. Observations to date (Eyres et al., 1996, 2000) demonstrate that the clumpy, non–spheroidal structures seen at late times (e.g. Gill & O’Brien, 1998, 2000) appear very early, and also develop rapidly. For V1974 Cyg, in which the shell structure was resolved by MERLIN only eighty days after outburst (Pavelin et al., 1993; Eyres et al., 1996), Ivison et al. (1993) found the sub–mm to mm data early in the outburst were inconsistent with kinematical models used to fit radio data at later times. In many novae optical spectroscopy is consistent with axisymmetric structures, with features due to density enhancements in polar caps, tropical rings and equatorial bands evident to different degrees in different novae (e.g. Gill & O’Brien, 1999). In V705 Cas the radio images show the structures developing asymmetrically while the optical spectra are consistent with an axisymmetric density distribution (Eyres et al., 2000). V723 Cas showed a similar development to V1974 Cyg (Heywood et al., 2004). Observing further novae over a range of speed classes (see Payne-Gaposchkin, 1964, for a definition of these classes) and hence ejecta velocities is important in constraining revised models over the physical parameter space.
V1494 Aql was first detected at m6.0 on 1999 December 1 (Pereira et al., 1999), reaching visual maximum of m4.0 by the end of 1999 December 3 (Rao et al., 1999; Liller, Frasca & Messina, 1999). It dropped to fainter than m6.0 by 1999 December 10 (Pontefract et al., 1999) and m7.0 by 1999 December 19 (Keen et al., 1999). Kiss & Thomson (2000) find t2 = 6.60.5 days and t3 = 160.5 days, making it a very fast nova. Optical spectroscopy has identified velocity components at up to 1700 km s-1 (Fujii, Ayani and Liller, 1999) while IR spectroscopy shows velocities up to 2900 km s-1 (Rudy et al., 2001), consistent with this classification. Iijima & Esenoglu (2003) concluded that mass ejection continued for over 150 days, contradicting a more general conclusion that ejection in novae ceases after a few days (e.g. Hjellming, 1996). In this work we present the results of observations of V1494 Aql starting on 1999 December 7, within 5 days of its discovery in outburst and interpret them in the context of standard models of mm-cm radio emission from novae.
2 Observations
We report observations in the radio, sub–mm and optical bands using the Multi–Element Radio–Linked Interferometer Network (MERLIN), the Very Large Array (VLA), the James Clerk Maxwell Telescope (JCMT), and the 1–m Zeiss telescope at the Special Astrophysical Observatory (SAO) of the Russian Academy of Science. Observing dates range from 4 to 288 days after visual maximum (1999 December 3, taken as day 0 hereafter).
2.1 JCMT
Initial observations were made with the JCMT on 1999 December 7 and 8 (days 4 and 5), at 450m and 850 m using SCUBA in photometry mode (Ivison et al., 1998; Holland et al., 1999) in good weather (optical depth at 225 GHz). Calibration was made against the JCMT primary calibrator Uranus, with skydips to measure opacity at both observing wavelengths.
2.2 Radio observations
MERLIN Target of Opportunity observations were triggered and took place on 1999 December 30 (day 27) at 18 cm. The observations were made in phase–referenced mode, using 1919+063 as the phase–reference source. The flux density scale was set by comparison of the unresolved source OQ208 with the resolved flux density calibrator 3C286. On the shortest MERLIN spacings at 1658 MHz 3C286 has a flux density of 13.639 Jy. OQ208 by comparison has a flux density 1.125 Jy, giving the calibrated flux density of 1919+063 to be 0.164 Jy. The data were mapped in wide–field mode to deal with a bright confusing source in the side–lobes of the primary beams of the antennas. A later MERLIN observation was made on 2000 April 17 (day 136) at 6 cm, using 1929+050 as a phase–reference source with a calibrated flux density of 0.27 Jy. The data for V1494 Aql were phase calibrated using the solutions for the phase–reference source.
Ad Hoc VLA data were obtained on 2000 June 7 (day 187) in C–array. Observations were made at 20, 6.1 and 3.5 cm, with a bandwidth of 50 MHz in each case. The primary calibrator was 1331+305 (= 3C286), which was used to calibrate the secondary calibrator 1922+155, for which flux densities of 0.610.04, 0.6320.007 and 0.630.01 Jy were determined in each band respectively. This was used to flux– and phase–calibrate the observations of V1494 Aql.
2.3 Optical spectroscopy
Observations were made with the Universal Astronomical Grating Spectrograph (UAGS) on the 1–m Zeiss telescope at the SAO on 2000 June 14 & 15 (days 194 & 195) and September 9 & 14 (day 281 & 286). The wavelength calibration was carried out using a neon arc with bespoke software for the reduction of data from this instrument (Vlasyuk, 1993). The observations were made with two different gratings, yielding spectral resolutions of around 1000 (June) and 2000 (September), giving a velocity resolution of 300 and 150 km s-1 respectively. The data are not flux calibrated.
These observations were made when V1494 Aql was still bright. We see no evidence for contamination of the spectra by features from the nearby G–type star, as seen at later times by Kiss, Csák & Derekas (2004).
3 Results
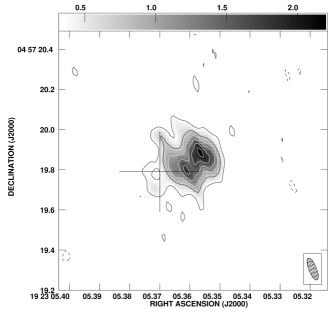
On December 7 & 8 (days 4 & 5 after maximum), the flux densities, taking an integration time weighted average over both nights, were 22.51.6 mJy at 850 m and 11428 mJy at 450 m, with marginal evidence of an increase between the two nights at 850 m (rise of 5.9 mJy compared with a combined uncertainty in the difference of 5.5 mJy). By the time of the MERLIN observations on day 27, the total flux density was 0.500.07 mJy at 18 cm. The emission was unresolved at this time, as expected. By day 136 the remnant was partially resolved with MERLIN at 6 cm , and the total detected flux density was found to be 25.01.2 mJy (see Fig. 1). The emission detected with MERLIN is consistent with the optical position from Kiss, Csák & Derekas (2004) of 19 23 5.37 +4 56 19.79 (quoted uncertainty 0.2 ″).
On day 187, the VLA detected the nova at 3.5 and 6.1 cm, with peak fluxes and total flux density as given in Table 1. At 20 cm confusing sources make the results difficult to assess, but estimated upper limits on the peak flux and total flux density are also given in Table 1. The emission was unresolved and peak positions in Table 1 were determined from Gaussian fits. These are consistent with both the MERLIN and Kiss, Csák & Derekas (2004) positions, allowing for the relatively low resolution of the VLA in C–array.
| Wavelength | Peak | Total | RA∗ | Dec∗ |
|---|---|---|---|---|
| (cm) | (mJy beam-1) | (mJy) | (s) | (arcsec) |
| 20 | 192∗∗ | 202∗∗ | 5.390 | 20.19 |
| 6.1 | 33.60.2 | 35.40.2 | 5.322 | 19.71 |
| 3.5 | 564 | 594 | 5.337 | 19.59 |
Optical spectra were taken on days 194 and 195, and again on days 281 and 286. Fig. 2 shows these spectra, which clearly exhibit emission from H, H, H, He I, [O III] and [N II].

In addition the blended lines possibly include He II, [Fe III], [Fe VI], [Fe VII], [Ca V], C IV and Si II, although many of these are tentative identifications due to the breadth of the features. In all cases where individual species are reasonably distinct or dominant, the line profiles are consistent with a complex velocity structure in the ejecta. This type of profile has been seen in previous classical novae (Gill & O’Brien, 1999), but it is apparent that the width of the lines in V1494 Aql means that adjacent species are blended in most cases. In particular the [N II] 6583.6Å profile will have a blue peak merged with the H profile. Only H is sufficiently distinct to draw further conclusions. In general the profiles on the two dates show very similar peak wavelengths for each component, symmetric around the rest wavelength. In 2000 June the blue–shifted component appears to be suffering absorption with respect to the red–shifted component; by 2000 September the two peaks are of comparable strength consistent with a reduction in the optical depth at this wavelength.
We have carried out 5–component Gaussian fits to the H profiles in order to find the wavelengths of outlying peaks. These values, along with estimated Full Width Half Maximum (FWHM) and Full Width Zero Intensity (FWZI) for each date, are given in Table 2. There is evidence for acceleration in the early decline (Iijima & Esenoglu, 2003) but none here for broadening of the profiles with time. The FWHM of the lines are consistent with values around 2700 km s-1 in 2000 June and September presented by Iijima & Esenoglu (2003). However there is no evidence for the variable high-velocity components that they found in their spectra of 2000 March.
| Date | Peak separation | Full Width Half Maximum | Full Width Zero Intensity | |||
|---|---|---|---|---|---|---|
| Å | km s-1 | Å | km s-1 | Å | km s-1 | |
| 2000 June | 35.72.4 | 2200150 | 45.36.0 | 2790370 | 614 | 3760250 |
| 2000 September | 37.71.0 | 232060 | 44.83.1 | 2760190 | 664 | 4070250 |
4 Discussion
4.1 Model fitting
Models for radio emission from novae have generally assumed it originates in free–free emission from an expanding isothermal shell. Initially the shell is optically thick so that the flux density is proportional to frequency squared () at any instant and rises as time squared () as the shell expands. Eventually the shell becomes optically thin and the flux density becomes proportional to at any given instant. The flux density then declines as the shell becomes more dilute (see Hjellming, 1996, for further discussion).
It is worth considering how the cm and sub–mm fluxes seen in the outburst of V1494 Aql compare to the predictions of such models. At the earliest epoch (4–5 d after outburst) the sub–mm observations give a spectral index =2.50.5 (), which is consistent with an optically thick shell. With =2 we estimate that the flux density at 6.1 cm at the same time would be mJy. We do not have an observation at 6.1 cm at this time. However, we can use the prediction of the simple models to extrapolate the estimate at 5 d and predict a 6.1–cm flux density of mJy by day 187. This falls well below the observed value of 35.4 mJy. The spectral index at this time between 6.1 cm and 3.5 cm is 1, suggesting that the shell was beginning to become optically thin. If that was the case, the extrapolated flux density of 6.2 mJy would represent an upper limit. Similarly extrapolating from day 5 to day 27, assuming the emission remains optically thick, leads to a prediction for the flux density at 18 cm of around 0.02 mJy, a factor 25 lower than that detected by MERLIN. The conclusion is that a single simple isothermal model cannot be used to simultaneously fit the early sub–mm observations and the later cm observations. This is in agreement with the findings of Ivison et al. (1993) for the case of V1974 Cyg.
Finally the flux density at 6 cm on day 137, from MERLIN observations, compared with the VLA flux density at 6.1 cm on day 188, suggests a rise at . This is consistent with the simple model at turn over between the optically thin and optically thick regimes. However by this stage MERLIN may well be resolving out some of the structure at 6 cm and hence this flux density must be considered as a lower limit. We note that changes to the H profiles between 2000 June and 2000 September (days 195 and 282; see Fig. 2) are consistent with the gas becoming optically thinner at optical wavelengths over that period.
We have attempted to fit the data with the two standard models for cm-wave radio emission from novae, the Hubble–flow model (Hjellming, 1996) and the variable–wind model (Kwok, 1983). As our analysis above indicates it is impossible to obtain a satisfactory fit to the whole submm–cm dataset. Of the two models, the Hubble–flow option provides the results most consistent with the data, considering that the VLA 20 cm flux is an upper–limit. The results of our best fit to the VLA data and the MERLIN data are given in Fig. 3. From this we find ejection velocities of km s-1 and a total shell mass of 2.810-4 M⊙. While the velocity is high even for a nova as fast as this one, the mass is typical of those determined from this kind of observation (Hjellming, 1996). See Heywood et al. (2004) for a discussion of these models and our application of them to classical novae.

4.2 Oxygen line ratios
In 2000 September we observed the three [O III] lines at 4363.5, 4958.9 and 5006.8Å. Following Iijima & Esenoglu (2003) and using their equation 1 for the intensity ratio between the sum of the intensities of the two lines around 5000Å to that of the line at 4363Å we can determine the electron density ne, using a nebula temperature of 10,700 K (Iijima & Esenoglu, 2003). From Fig. 2(b) we find a ratio of . This gives a global average n m-3. Taking a rough ratio of the summed profiles around 5000Å to the profile at 4363Å shows that this ratio is fairly constant across the range of velocities, suggesting little variation in density across the velocity structure (and hence presumably across the spatial structure). This value is comparable to but significantly smaller than the value of 5.2 m-3 from Iijima & Esenoglu (2003) around the same date.
4.3 Remnant structure
In Fig. 1 we can see that the remnant consists of a partial shell, with two areas of extended emission approximately to the east and west of the central binary system. The structure is consistent with that apparent in observations of previous classical novae (Eyres et al., 1996, 2000; Heywood et al., 2004). Note that the registration between the optical and radio positions is not accurate enough to allow us to place the star precisely with respect to the radio structure. We assume that the star lies between the two radio peaks, i.e. at the centre of the partial shell.
The spectra in Fig. 2 are predominantly double–peaked, consistent with emission from a shell of material. Gill & O’Brien (1999) have demonstrated that multiply–peaked spectra are consistent with sub–structure in the shell. However, in the case of V1494 Aql the lines are so broad that adjacent features merge, so that it is impossible to distinguish sub–structure in one line from the overall structure in an adjacent line. Indeed where lines are most likely isolated (e.g. in the case of H) the profile has little consistent sub–structure, and is essentially symmetric between the two wings. Table 2 gives the calculated corresponding expansion velocities for a simple shell model.
Anupama, Sahu & Mayya (2001) present spectra taken between days 3 and 22. They show dramatic changes in the H profile, from a P Cygni profile on day 3, to a broad, structureless form on day 5 (also seen by Kiss & Thomson, 2000), followed by the development of structure similar to that seen in Fig. 2 by day 22. It is interesting that our JCMT observations coincide with the featureless stage of the H profile, suggesting that the ejecta were in transition from optically thick to optically thin. It is also of note that the overall structure of the H line profile remains similar from day 15 right through to day 195, before the blue–shifted component brightens by day 285. Hjellming (1996) attributed this switch from a flat, broad spectrum to the form seen in Fig. 2(d) to a transition from continuous mass outflow to a detached shell. This would indicate a chronology in which continuous mass outflow ceases prior to day 15, followed by the expansion of the optically thick detached shell. However we are not convinced that the changes in the profile require the end of mass outflow. For example a equatorial ring of enhanced density would give a double–peaked profile even while mass outflow continued. We note that Iijima & Esenoglu (2003) claim evidence for continued mass ejection more than 150 days after outburst. In either case, the ejecta becomes optically thin in the visible wavelength range between days 195 and 285. This places some time constraints on future modelling of nova ejecta.
A simple Gaussian fit to the radio emission structure indicates that on day 137 the major axis is 26516 mas at position angle (east of north) 110.74.2 degrees, minor axis 1559 mas. This agrees well with the extent of the emission on the image (Fig. 1). In addition the separation of the peaks of the two radio components is 1205 mas. The position angle differs from that of 140 degrees found around optical maximum by Kawabata et al. (2001) using spectropolarimetry. However given the breadth of the radio features in Fig. 1 the image seems consistent with extension in the general south–east to north–west direction, as seen at early times by Kawabata et al. (2001).
Kiss & Thomson (2000) use a number of Maximum–Magnitude–Rate–of–Decline relationships to find a distance of 3.60.3 kpc. Iijima & Esenoglu (2003) find reddening amounting to AV = 1.8, and consequently a modified distance of 1.60.2 kpc. Using this latter distance estimate we can use the observed extent of the radio emission to estimate an ejection velocity. This leads to values ranging from 98080 km s-1 to 2500200 km s-1 depending on whether the major or minor axes or the peak to peak separation are used in the calculation. This velocity range is entirely consistent with that derived from the spectra and presented in Table 2 and confirms that the radio continuum arises from the same material as the optical lines. Thus it may be that at this stage of the development of the radio emission (whilst the remnant is still largely optically thick at these wavelengths) it is valid to compare the extent of the remnant on the sky (Fig. 1) with velocities derived from hydrogen spectra to derive a distance to classical novae.
It has been suggested (Kiss & Thomson, 2000) that the spectral line profiles are consistent with a nearly edge–on equatorial ring of the sort modelled by Gill & O’Brien (1999). We feel given the width of the individual components this conclusion cannot be directly supported; we do not rule out such a structure but the spectra do not require it. Nonetheless we can examine the possibility that our MERLIN image (Fig. 1) represents emission from a tilted ring. Assuming that the major axis of the brightness distribution on the sky represents the diameter of an equatorial ring, we take foreshortening due to the tilt to lead to the ellipticity. Consequently the minor axis can be compared with the major axis to give an angle of inclination to the line–of–sight of , which cannot be considered edge–on. However it does agree well with the findings of Iijima & Esenoglu (2003) who reconcile high radial velocities of absorption lines in the early decline with lower emission line widths in the later nebular stage. They suggest the ejecta take the form of a ring with an angle to the line of sight of 30∘, also in agreement with our angle above. In this case the intrinsic velocities are twice as large as those observed and may at least partly explain why the high velocities derived from the spherically symmetric model for the radio emission presented in section 4.1 are inconsistent with the velocities derived from the optical spectroscopy.
We note Iijima & Esenoglu (2003) also suggest the presence of high–velocity jets in V1494 Aql. These could also be a source of the elongation in the radio emission, and the velocities of the jets are consistent with emission of the angular extent seen. However it is difficult to see how the radio emission could be reconciled with both fast jets and an inclined ring of material; either one or the other must have caused the observed structure. Given that our MERLIN observations are contemporaneous with the Nebular stage as defined by Iijima & Esenoglu (2003) it seems simplest to associate the observed structure in the radio with an inclined ring; the size scale also agrees with this interpretation. This does not mean jets were not present also, only that they were not visible to MERLIN.
4.4 Remnant mass
We can use some very simple assumptions to gain a model–independent estimate of the mass of the ejecta. Assuming ejecta formed of pure, ionised hydrogen, the mass might be estimated as
| (1) |
for an electron density , hydrogen atom mass and ejecta volume . We estimate by assuming that the major and minor axes of the emission on the sky are the major and minor axes of the ellipsoidal ejecta, and that the intermediate axis is the mean of these two. Taking into account continous mass ejection, we find the volume of the shell occupied by the ejecta on day 136 to be m3 at a distance of 1.6 kpc. This gives M⊙. This is comparable with the total mass estimate of Iijima & Esenoglu (2003), but significantly less than our estimate from model fitting. If mass ejection had ended on day 15, the ejecta would only occupy around 30% of this volume, with a corresponding M⊙.
5 Conclusions
We present a number of observations of the remnant of the classical nova V1494 Aql. These begin 4 d after visual maximum with sub–mm data from the JCMT, followed by cm–band data after 136 d (MERLIN) and 187 d (VLA) and finally optical spectroscopy on 194 d and 284 d (UAGS). Together these observations probe the ejecta over a period of 20 weeks, from the early “fireball” stage to the final optically thin phase as the radio emission begins to fade away. Comparison between the radio image and spectroscopy is consistent with a distance of 1.6 kpc.
Both the optical spectra and the radio imaging demonstrate the early clumpy structure of the ejecta around classical novae. Most importantly it conclusively shows that simple spherical models of the ejecta development are insufficient to predict the behaviour over the time and wavelength domain sampled here (183 days, 450m to 20 cm). Clearly new models for radio emission from novae must be developed which address departures from spherical symmetry and the clumpy nature of the ejecta. Furthermore it is essential to investigate in detail how the predicted brightness distributions from such models would be seen by radio interferometers such as MERLIN if we are to confidently reconcile features in the radio images with structures in the ejecta. We find that the emission is consistent with either an inclined ring or jets of ejecta (as suggested by Iijima & Esenoglu, 2003) but not both; we are inclined to associate it with the former rather than the latter. We also find data consistent with mass ejection continuing for six months after the outburst right up to the ejecta starting to become optically thin in the visible regime after day 195. This continuous mass ejection needs to be tested in other novae, in particular looking for correlations with speed class.
Acknowledgments
VE and IH acknowledge the support of PPARC. The JCMT is operated by the Joint Astronomy Centre in Hilo, Hawaii on behalf of the parent organizations Particle Physics and Astronomy Research Council in the United Kingdom, the National Research Council of Canada and the Netherlands Organization for Scientific Research. MERLIN is a National Facility operated by the University of Manchester at Jodrell Bank Observatory on behalf of PPARC. The National Radio Astronomy Observatory is a facility of the National Science Foundation operated under cooperative agreement by Associated Universities, Inc. This work used the on–line service of VSNET.
References
- Anupama, Sahu & Mayya (2001) Anupama, G. C., Sahu, D. K., Mayya, Y. D., 2001, BASI, 29, 375
- Eyres et al. (2000) Eyres, S. P. S., Bode, M. F., O’Brien, T. J., Watson, S. K., Davis, R. J., 2000, MNRAS, 318, 1086
- Eyres et al. (1996) Eyres, S. P. S., Davis, R. J., Bode, M. F., 1996, MNRAS, 279, 249
- Fujii, Ayani and Liller (1999) Fujii, M., Ayani, K., Liller, W., 1999, IAU Circular 7324
- Gill & O’Brien (1998) Gill, C. D., O’Brien, T. J., 1998, MNRAS, 300, 221
- Gill & O’Brien (1999) Gill, C. D.; O’Brien, T. J., 1999, MNRAS, 307, 677
- Gill & O’Brien (2000) Gill, C. D., O’Brien, T. J., 2000, MNRAS, 314, 175
- Heywood et al. (2004) Heywood, I., O’Brien T. J., Eyres, S. P. S., Bode, M. F., Davis, R. J., 2004, MNRAS, submitted
- Hjellming (1996) Hjellming, R. M., 1996, in: Taylor, A. R., Paredes, J. M.(eds) Radio Emission from the Stars and the Sun, ASP Conf. Ser. 93, p174
- Holland et al. (1999) Holland, W. S., Robson, E. I., Gear, W. K., Cunningham, C. R., Lightfoot, J. F., Jenness, T., Ivison, R. J., Stevens, J. A., Ade, P. A. R., Griffin, M. J., Duncan, W. D., Murphy, J. A., Naylor, D. A., 1999, MNRAS, 303, 659
- Iijima & Esenoglu (2003) Iijima, T, Esenoglu, H. H., 2003, A&A, 404, 957
- Ivison et al. (1993) Ivison, R. J., Hughes, D. H., Lloyd, H. M., Bang, M. K., Bode, M. F., 1993, MNRAS, 263, 43
- Ivison et al. (1998) Ivison, R. J., Dunlop, J. S., Hughes, D. H., Archibald, E. N., Stevens, J. A., Holland, W. S., Robson, E. I., Eales, S. A., Rawlings, S., Dey, A., Gear, W. K., 1998, ApJ, 494, 211
- Kawabata et al. (2001) Kawabata, K. S. et al., 2001, ApJ, 552, 782
- Keen et al. (1999) Keen, R., Baroni, S., Lourencon, R., Granslo, B. H., Carvajal, J., Foglia, S., Hornoch, K., 1999, IAU Circular 7337
- Kiss, Csák & Derekas (2004) Kiss, L. L., Csák, B., Derekas, A., 2004, A&A, 416, 319-322
- Kiss & Thomson (2000) Kiss, L. L., Thomson, J. R., 2000, A&A, 355, L9
- Kwok (1983) Kwok, S., 1983, MNRAS, 202, 1149
- Liller, Frasca & Messina (1999) Liller, W., Frasca, A., Messina, S., 1999, IAU Circular 7327
- Pavelin et al. (1993) Pavelin, P. E., Davis, R. J., Morrison, L. V., Bode, M. F., Ivison, R. J., 1993, Nature, 363, 424
- Payne-Gaposchkin (1964) Payne-Gaposchkin, C. H., 1964, The Galactic Novae, (Dover Publications: New York)
- Pereira et al. (1999) Pereira, A., di Cicco, D., Vitorino, C., Green, D. W. E., 1999, IAU Circular 7323
- Pontefract et al. (1999) Pontefract, M., Ivison, R. J., Reuland, M., Tilanus, R. P. J., 1999, IAU Circular 7330
- Rao et al. (1999) Rao, J., Giovanardi, S., Tao, H.-l., Song, W.-f., Hornoch, K., Kiss, L., 1999, IAU Circular 7326
- Rudy et al. (2001) Rudy, R. J., Mazuk, S., Venturini, C., Lynch, D. K., Puetter, R. C., Mortfield, P., 2001, IAU Circular 7674
- Vlasyuk (1993) Vlasyuk, V., 1993, Bulletin of SAO, 36, 107