Properties of High Redshift Quasars-I: Evolution of the super-massive black-hole to halo mass ratio
Abstract
In the local universe, the masses of Super-Massive Black-Holes (SMBH) appear to correlate with the physical properties of their hosts, including the mass of the dark-matter halos. At higher redshifts, we observe the growth of SMBHs indirectly through the identification of high redshift quasars. However information on their hosts is more difficult to obtain. In this paper we determine the masses of the halos that host the high redshift quasars (at ) by comparing the rate of growth of quasar density with that predicted by the Press-Schechter mass function. The host mass determined depends on how the ratio between SMBH and host halo mass evolves with redshift. Under the assumption that the ratio between SMBH and halo mass does not evolve with redshift, we find a host halo mass of . Even if the quasars shine at their Eddington limit, this host mass is significantly smaller than that seen at lower redshifts in the local universe. Indeed we find that the null-hypothesis, of a constant ratio between SMBH and halo mass at all redshifts, can be ruled out at greater than a 5-sigma level. SMBHs must therefore have contributed a larger fraction to the host mass in the past. This finding is consistent with expectations from models of self limiting SMBH growth. When we include the redshift evolution of the ratio between SMBH and halo mass, we find larger halo masses of , in combination with a ratio between SMBH and host halo mass that increases with redshift in proportion to are required to be consistent with both local and high redshift observations. We also investigate the restrictions placed on the critical linear overdensity of quasar hosts at their epoch of virialisation and find that it cannot exceed the traditional value of by more than a factor of two. Finally, we find that the high redshift quasars are hosted by fluctuations on scales that have a variance of , corresponding to -sigma fluctuations in the density field.
keywords:
cosmology: theory - galaxies: formation1 Introduction
The Sloan Digital Sky Survey has discovered luminous quasars at redshifts as high as , i.e., when the universe was only a billion years old. The super-massive black-holes (SMBH) powering these quasars have been estimated to have a mass of about solar masses. However questions regarding the galaxies that host these high redshift quasars have remained largely unanswered. To understand the formation and evolution of quasars and the super-massive black-holes that power them, one needs to determine several important physical parameters (such as the quasar lifetime, the ratio of black-hole mass to halo mass, and the efficiency and rate of accretion during the luminous phase), as well as the evolution of these parameters with time. Attempts to answer these questions generally consider the quasar luminosity function, as it provides a tracer of the density of quasars with different luminosities as function of cosmic epoch (e.g. Haehnelt, Natarajan & Rees 1998; Haiman & Loeb 1998; Kauffmann & Haehnelt 2000; Volonteri, Haardt & Madau 2003; Wyithe & Loeb 2003). However, all these analyses are model dependent and implicitly assume either (a) the quasar lifetime and its evolution with redshift, and/or (b) the form, normalisation and evolution of a relation between SMBH mass and the characteristic velocity of the host galaxy. The exceptions are studies at low redshift that utilise the quasar two-point correlation function (Martini & Weinberg 2001; Haiman & Hui 2001; Croom et al. 2004). At high redshift dynamical estimates have been made in a few individual cases (Barkana & Loeb 2003; Bertoldi et al. 2003).
Locally, direct estimates of SMBH and host mass can be made through observations of galaxy dynamics. These observations reveal a correlation between SMBH mass and the characteristic velocity of the surrounding stellar spheroid (e.g. Merritt & Ferrarese 2001; Tremaine et al. 2002), and by extension of the host dark matter halo (Ferrarese 2003). These characteristic velocities determine the dynamical mass, so that there are also corresponding correlations between SMBH and host mass. Any proposed scenario for SMBH evolution must reproduce this behaviour and hence the correlations provide important clues regarding the physics of formation of SMBHs.
However at higher redshift, objects collapse out of a denser back-ground. The characteristic velocity of a virialised object of a given halo mass is therefore larger if it formed at higher redshift. This begs the question of whether the fundamental correlation is between SMBH mass and the hosts characteristic velocity, or between SMBH mass and dynamical host mass. Obviously knowledge of which correlation is fundamental is critical for our understanding of the astrophysics of SMBH evolution. Unfortunately since these dynamical observations can only be made for relatively nearby galaxies, this question cannot be resolved via direct observation.
Here, within the paradigm of standard concordance cosmology, we show that by associating halo mass to quasar luminosity, the formation rate of luminous quasars in the high redshift universe can be used to constrain the mass of the dark matter halos that host them. We thus provide a framework within which one can attempt to answer the question of whether host mass or velocity is the determining factor in the evolution of a SMBH. We believe this procedure holds significant promise for the future when the observations improve.
In § 2 we begin with the null-hypothesis that the ratio between the masses of SMBH and the halo does not evolve with redshift. Under this assumption, we find the host mass to be about . Estimates for SMBH mass powering the luminous SDSS quasars yield assuming output at the Eddington limit (the Eddington limit provides a lower limit on SMBH mass, and hence a lower limit on the mass ratio). The resulting SMBH to halo mass ratio is therefore much larger for the SDSS quasars than for local galaxies. Indeed, the null hypothesis can be rejected at a significance greater 5-sigma, i.e. SMBHs in the past contributed a larger fraction of galaxy mass than those today. This is one main conclusion of the paper. Next, we allow for the SMBH to halo mass ratio to evolve with redshift (§ 2.6). In this more general case we estimate a halo mass for high redshift quasar hosts, , and find that the ratio between SMBH and host halo mass should increase with redshift as in order to be consistent with extrapolation from local observations. Estimates for the high redshift quasar lifetime are discussed in § 3. We also investigate variance of the linear power-spectrum on the scale of density fluctuations corresponding to the high redshift quasar hosts in § 4. Finally, we discuss the the implications of the rate of high redshift quasar density evolution for the value of the critical linear overdensity at host virialisation in § 5. Some concluding discussion is given in § 6.
Throughout the paper we adopt the set of cosmological parameters determined by the Wilkinson Microwave Anisotropy Probe (WMAP, Spergel et al. 2003), namely mass density parameters of in matter, in baryons, in a cosmological constant, and a Hubble constant of . For the primordial power-spectrum of density fluctuations, we adopt a power-law slope , and the fitting formula to the exact transfer function of Bardeen et al. (1986). It turns out that our results are most sensitive to the cosmological parameter , which is the amplitude of the linearly extrapolated power-spectrum on scales of Mpc. We present results for different wherever appropriate to illustrate the range of this dependence.
2 Evolution in Quasar Density
The Press-Schechter (1974) mass function (with the modification of Sheth & Tormen (2002) that will be adopted throughout our discussion) yields the number density of dark matter halos above some mass at redshift . If luminous quasars reside in a fraction of such dark-matter halos, then the observed number density of quasars is given by the product of two factors: and where is the (unknown) quasar lifetime and is the Hubble time (see e.g., Estathiou & Rees 1998). As a measure of the rate at which luminous quasars appear, we use the logarithmic derivative of , defined as
| (1) |
Here we have assumed that the halo mass varies as at fixed luminosity . This choice is convenient for our discussion because observations do reveal an exponential decline in the quasar population with redshift suggesting approximate constancy of . Our analysis, of course, relies on the applicability of the Press-Schechter mass function (as modified by Sheth and Torman 2002). It has been shown that this analytic formalism provides an excellent description of the halo mass function found from numerical simulations (Jenkins et al. 2001). In particular, if the numerical mass function is expressed in the appropriate variables then it is independent of epoch, which is a defining feature of the Press-Schechter formalism. Evaluation of using the Press-Schechter mass function therefore provides an accurate description of the redshift evolution of massive dark-matter halos in a cosmology.
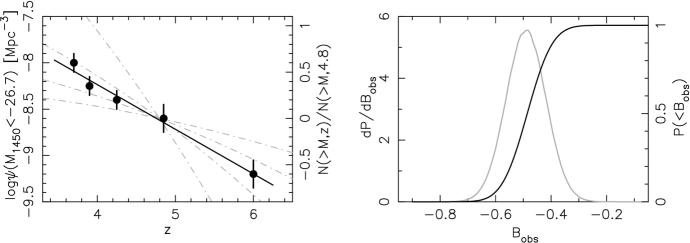
The mass function leads to a steeper slope as is increased. This is illustrated by the grey dot-dashed lines in the left panel of figure 1 which show the evolution of (arbitrarily normalised at ) for masses of , , and . These curves should be compared to the observed evolution in the density of luminous ( quasars between redshifts of and from the Sloan Digital Sky Survey (Fan et al. 2001;2003;2004), which is also summarised in the same panel. Here we are assuming that the identification of luminosity with halo mass does not vary (that is, ). This forms the null hypothesis in this work. The effects of relaxing this assumption are discussed later in § 2.6.
The curves corresponding to and have logarithmic slopes that lie at the extremes of the range allowed by the data. It is therefore clear that if we can measure the exponential slope in the formation of high redshift quasars, then we can determine the mass of their host dark-matter halos. By using only the logarithmic slope , we have removed the dependence on the absolute value of quasar lifetime. However, does depend on the form of the redshift evolution of (and on ). While could also change with due to various effects (dust obscuration, beaming angle etc.), we expect the dominant additional contribution to to come from . The dependence of can be handled by using two physically motivated forms for the evolution — which bracket the reasonable range of possibilities — and can be parameterised by with . First, if the quasar lifetime is determined by the mass e-fold timescale of the SMBHs, then is independent of redshift, and . Second, if the quasar lifetime is determined by the dynamical timescale at , then making independent of redshift and . (This is also true if .)
2.1 Evolution constraints
The evolution shown in figure 1 is well fitted by an exponential decline (Fan et al. 2001) of the form
| (2) |
The right hand panel of figure 1 shows the a-posteriori differential (grey curves) and cumulative (black curves) probability distributions for the observed exponential slope . These distributions were computed as follows. For each value of , we find the normalisation which maximises the product of probabilities from each redshift bin (assuming Gaussian error bars). This product represents the likelihood for . A flat prior probability for was then assumed, allowing calculation of a-posteriori distributions for . Distributions were estimated using the whole data set and two subsets of the data; data with , and data with . We find that , and describe the evolution within the full data set and two subsets respectively showing internal consistency. The best fit is also plotted in the top left panel to guide the eye.
2.2 Mass constraints
From equation (1) there is a one-to-one monotonic correspondence between halo mass and exponential slope . The a-posteriori probability distributions for host halo mass may therefore be found by noting that
| (3) |
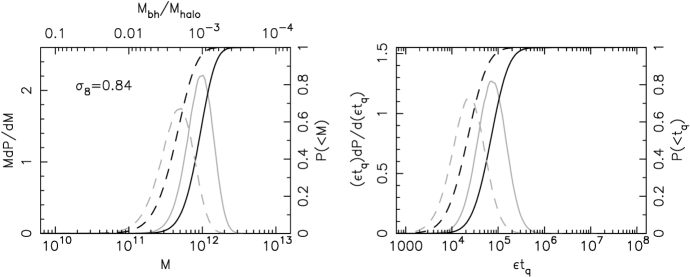
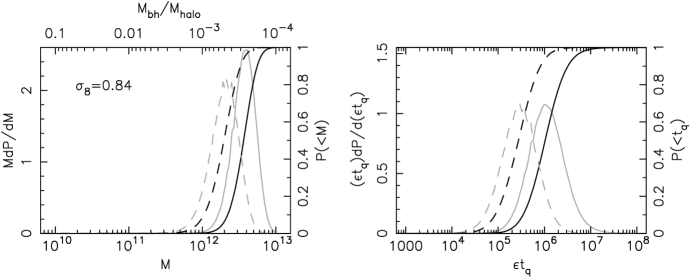
where was computed using equation (1) at the central redshift within the luminosity function data. The differential (grey lines) and cumulative (dark lines) a-posteriori distributions for are plotted in the left hand panel of figure 2. If (solid lines), the observed evolution in the density of bright quasars implies host halos with masses of . If (dashed lines), then the halo mass estimates and their upper bounds are about a factor of smaller; we get . Thus under the null-hypothesis of a fixed , the exponential slope of the high redshift quasar luminosity function leads to the determination of masses of halos that host high redshift quasars to within a factor of a few. In particular, we stress that the result does not rely on any a-priori assumptions about the relation between quasar luminosity and SMBH mass, about the relation between SMBH and halo mass, or about the halo density profile.
As an aside, we note that an alternative approach to equations (3) [and (5)] for calculation of [and ] would be to choose prior probabilities for and that are flat in the logarithm, and likelihoods for and based on the comparison of the corresponding slope with the data. We find that this approach gives nearly identical results to those presented in this paper.
2.3 SMBH to halo mass ratio
We now explore several further consequences. For the estimation of SMBH mass, it is usually assumed that quasar emission is isotropic, and that emission is at the Eddington rate, resulting in SMBHs powering the highest redshift quasars having inferred masses (Fan et al. 2001) of . These estimates are consistent with dynamical estimates based on emission line profiles (Willott, McLure & Jarvis 2003). We have therefore labeled the upper axis of the left panel in figure 2 with the fraction of halo mass contributed by a black-hole, allowing the curves in this panel to represent the a-posteriori probability distributions for this fraction as well as . We find that the full data set implies SMBHs contribute a fraction of about and of the halo mass for and respectively. These fractions are larger than those found by Ferrarese (2003) for local galaxies, which are , and respectively under the assumptions of singular isothermal halos, Navarro, Frenk & White (1997) (NFW) halos, and halo masses derived from galaxy-galaxy lensing (Seljak 2002).
This result has two possible interpretations. First, the SMBHs are accreting at well above their Eddington rate and/or with high efficiency so that the black-hole mass has been overestimated (this disagrees with dynamical studies, Willott et al. 2003). A second, more agreeable, interpretation is that SMBHs may contribute a larger fraction of the halo mass at higher redshifts. Indeed this latter scenario is independently supported by observations of quasar host galaxies at which suggest black-hole masses that are significantly larger with respect to their hosts than in the case of local galaxies (Croom et al. 2004).
2.4 Sensitivity to
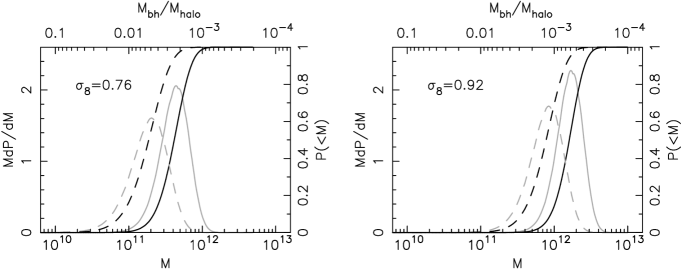
Of the observable cosmological parameters, the relationship between and is most sensitive to . To illustrate the extent of this dependence we have repeated our analysis using values of and =0.92. (These values bound the 2- range of the best fit constraints derived from WMAP plus large-scale structure and Ly forest data Spergel et al 2003.) We find that the constraints on the quasar host halo mass vary by a factor of within the range for (see figure 3).
2.5 Marginalised distributions
One can also marginalise over systematic uncertainty in due to and ;
| (4) |
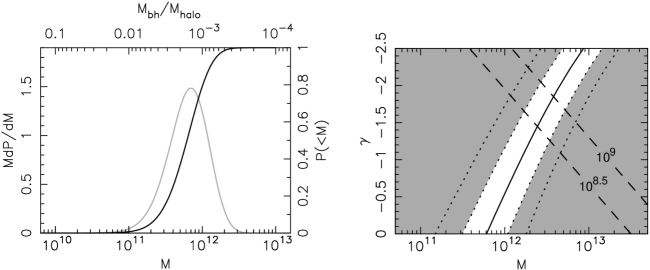
where was determined using equation (3), and we have used a flat prior probability for in the range combined with a Gaussian probability distribution for . We find (left hand panel of figure 4) a value of , which is our best estimate for the halo mass of the high redshift galaxies that host the quasars under the null hypothesis of . Assuming a central black-hole, corresponding to accretion at the Eddington limit (Willott, McLure & Jarvis 2003), this corresponds to a black-hole to halo mass ratio of , which is inconsistent with local estimates (Ferrarese 2003; assuming an NFW profile) at greater than . If luminous quasars shine near their Eddington rate over a range of redshifts, we therefore conclude that the SMBH to halo mass ratio must increase with redshift.
2.6 Mass estimates assuming an evolving SMBH to halo mass ratio
In evaluating the derivative , we have thus far assumed a luminosity to be associated with a fixed halo mass (). However if the halo mass housing quasars of luminosity varies with redshift, then the evaluation of must include the extra term in equation (1) of the form (where we have assumed that the halo mass varies as at fixed luminosity .) In the right hand panel of figure 4 we show the 2.5, 16, 50, 84 and 97.5 percentiles of the cumulative marginalised distribution (equation 4) for halo mass as a function of . The grey regions represent the masses outside the 1- range for each . Smaller values of lead to larger estimates of the mass (Note that the y-axis is reversed with decreasing from bottom to top). If the evolution of halo mass housing a fixed black-hole mass follows between the local and high redshift universe then we can estimate at high redshift as a function of , by extrapolating the local relation (Ferrarese 2003) between halo and black-hole mass. The resulting curves (taking the case of an NFW profile) are plotted for black-hole masses of and (dashed lines from left to right). By comparing the two constraints we find , leading to estimates of halo mass that are times larger than our evolution-free () estimate. Note that these larger masses do not weaken our result that SMBHs comprised a larger fraction of galaxy mass at high redshift, as this behaviour is explicit when . Interestingly, values of follow naturally from models where SMBH growth is self limiting through feedback on galactic gas (e.g. Haehnelt, Natarajan & Rees 1998; Wyithe & Loeb 2003).
We see from Figure 4 that if the evolution of the ratio between SMBH and halo mass (or more correctly, the ratio between quasar luminosity and halo mass) can be described as a powerlaw in redshift, then an extrapolation from local observations combined with our evolution analysis implies a value of . In the left panel of Figure 5 we plot the differential and cumulative probability distributions for assuming . As mentioned in the previous paragraph we find larger masses than were derived in Figure 2 under the assumption of non-evolving ratio; we get () and ().
3 quasar lifetime
If a fraction of dark matter halos contain SMBHs, then the total lifetime of the quasar can be estimated (Martini & Weinberg 2001; Haiman & Hui 2001) by dividing the quasar number density by times the number density of halos larger than , and then multiplying by the Hubble time (for ). The a-posteriori probability for the product is
| (5) |
where is the observed Gaussian probability for . Under the assumption of a SMBH to halo mass ratio that does not evolve with redshift (see Figure 2, right hand panel), we find lifetimes of and years (respectively) for and , in a cosmology where . In addition (not shown) we have computed distributions for corresponding to and =0.92. We find constraints that vary by a factor of 2 relative to the case of . These results imply that if all dark matter halos contained SMBHs at high redshift () then the preferred quasar lifetime of years is significantly shorter than both the Salpeter time [about years] for accretion at the maximal rate () with efficiency of conversion from mass to energy, as well as estimates of the quasar lifetime at lower redshifts [() years, see Martini (2003) for a summary]. The small value of might therefore indicate that not all dark-matter halos at high redshift contain supermassive black-holes, in contrast to the situation locally (Kormendy & Richstone 1995). Indeed, if the high redshift quasar lifetime were years, as seems to be the case (Yu & Tremaine 2002) at , this would imply that only 1 in dark matter halos at contained a SMBH. Alternatively, there could be a larger number of obscured quasars at high redshift, giving the impression of a smaller quasar lifetime.
On the other hand, we have suggested that a situation where the SMBH to halo mass ratio does not evolve with redshift will be inconsistent with local observations. As a result it should not be surprising that the lifetime derived when is inconsistent with other observations. In § 2.6 we derived results for the halo mass under the assumption that the SMBH to halo mass ratio evolve as a power-law in redshift and found that larger masses of are obtained for . We have also derived the a-posteriori probability distribution for quasar lifetime in this case (right panel of Figure 5), and found that the larger halo mass leads to a longer inferred lifetime. We find years () and years (). For occupation fractions of unity () these lifetimes are marginally consistent with, though still smaller than the lifetime of years inferred at lower redshift.
4 The variance of density fluctuations corresponding to high redshift quasar hosts
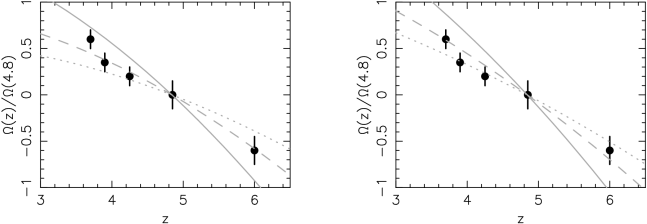
An alternative way of studying the hosts of the high redshift quasars is to compare the evolution of their density with the evolution of the density of halos that correspond to scales with a fixed variance in the linearly extrapolated power-spectrum. In Figure 6 we show curves of density [] against redshift for values of variance , 2.5 and 3. Since we are interested in the deviation of the observed results from the theoretical curves for a constant , we have normalised both the theoretical curves (from Press-Schechter) and the data to unity at an intermediate redshift , and thus express the evolution in terms of a dimensionless density parameter []. The left and right panels correspond to values of and respectively. We find that the values of bracket the range of evolution, implying that for a linearly extrapolated critical overdensity of , the high redshift quasar dark-matter host galaxies formed from -sigma to -sigma density fluctuations. The rareness of these fluctuations is consistent with the large masses (well in excess of the non-linear mass-scale) which were inferred in § 2.6.
5 the linear overdensity for quasar hosts
When calculating the Press-Schechter mass function, we have so far adopted the conventional value for the linear overdensity at halo virialisation of , which is appropriate for a spherical collapse at the time when shells evolve to zero radius. This value of , which corresponds to a non-linear overdensity of about , agrees with results from N-body simulations (Jenkins et al 2001). However, in general, non-spherical top-hat models virialise at a time when the linear overdensity reaches a value greater (Engineer, Kanekar & Padmanabhan 2000) than .
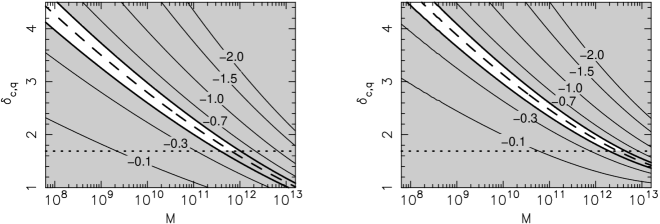
As we showed in § 4, luminous quasars are rare systems forming from greater than 3-sigma fluctuations. It is therefore possible that they form only in hosts of unusual overdensity. In figure 7 we have plotted contours of as a function of and . [for the case of and , and assuming (left panel) and (right panel).] The shaded grey regions show the excluded values of , and (68% range). The most likely value of the variance is plotted as a thick dashed line. We see that cannot be too different from 1.69, or else the host dark matter halos would be unacceptably small. This indicates that collapse to an unusually overdense halo is not taking place in halos that host SMBH formation and quasar activity. An absolute upper limit on can be obtained by noting that if the mass of the SMBH is , then host masses must be larger than about . In this case, values of are not allowed. If the SMBH were restricted to contain less than 10% of the gas component, then .
6 Discussion
In this paper we have estimated the mass of high redshift quasar host dark matter halos by comparing the rate of quasar evolution with the Press-Schechter mass function. We have found that in the case of the null hypothesis where the SMBH to halo mass ratio does not change with redshift, that the implied halo mass is . This mass is significantly smaller than the mass of local halos that house a SMBH, the mass believed to be powering the SDSS quasars. Indeed our results rule out the null-hypothesis at a significance greater than 5. We therefore conclude that the SMBH to halo mass ratio must increase towards higher redshift, i.e. SMBHs contained a larger fraction of the host galaxy mass at earlier times.
Having demonstrated that SMBHs at high redshift must have contained a larger fraction of the host mass than SMBHs observed today, we allowed the SMBH to halo mass ratio to vary with redshift. In this case it is possible to achieve consistency between observations of high redshift quasars and local SMBH masses. We find that these combined constraints imply high redshift quasar host halo masses of , with a SMBH to halo mass ratio that varies with redshift approximately as .
A scenario where SMBHs formed at high redshift contain a greater fraction of the host galaxies mass is consistent with models of SMBH evolution in which SMBH growth is limited by feedback during the quasar phase (e.g. Silk & Rees 1998; Haehnelt, Natarajan & Rees 1998; Wyithe & Loeb 2003). These models predict a relation between SMBH mass and the characteristic velocity of the host which is redshift independent. As a result feedback regulated growth of SMBHs leads naturally to a ratio of SMBH to halo mass that increases with redshift. Our results therefore support feedback regulated schemes where SMBH growth is dominated by accretion during the luminous quasar phase.
Upon completion, the Sloan Digital Sky Survey will have identified much larger numbers of high redshift quasars than are currently published . The more accurate luminosity functions which will be available should then allow a similar and more precise analysis using the model-independent technique introduced in this work. Such an analysis may allow the variation of host mass with redshift to be determined directly for the high redshift quasars.
Acknowledgements
The work of JSBW was supported by the Australian Research Council. This work was initiated when one of the authors (TP) was visiting the School of Physics, University of Melbourne, under the Miegunah Distinguished Fellowship.
References
- [] Bardeen, J.M., Bond, J.R., Kaiser, N., Szalay, A.S., 1986, Astrophys. J., 304, 15
- [] Barkana, R., Loeb, A., 2003, Nature, 421, 341
- [] Bertoldi, F., et al., 2003, Astron. Astrophys., 409, 47 (2003)
- [] Croom, S.M., et al., 2004, astro-ph/0409314
- [] Croom, S.M., Schade, D., Boyle, B.J., Shanks, T., Miller, L., Smith, R,J., 2004, Astrophys. J., 606, 126
- [] [] Efstathiou, G., Rees, M. J., 1998, M.N.R.A.S, 230, 5
- [] Engineer, S., Kanekar, N., Padmanabhan, T., 2000, M.N.R.A.S, 314, 279
- [] Fan, X., et al., 2001, Astron. J., 122, 2833
- [] Fan, X., et al., 2001, Astron. J., 121, 54
- [] Fan, X., et al., 2004, astro-ph/0405138
- [] Ferrarese, L., 2001, Astrophys. J., 587, 90
- [] Haehnelt, M.G., Natarajan, P., Rees, M.J., 1998, M.N.R.A.S., 300, 817
- [] Haiman, Z., Hui, L., 2001, Astrophys. J., 547, 27
- [] Haiman, Z., Loeb, A., 1998, ApJ, 503, 505
- [] Jenkins, A., Frenk, C.S., White, S.D.M., Colberg, J.M., Cole, S., Evrard, A.E., Couchman, H.M.P., Yoshida, N., M.N.R.A.S, 321, 372
- [] Kauffmann, G., Haehnelt, M.G., 2000, M.N.R.A.S., 311, 576
- [] Kormendy, J., Richstone, D., 1995, Ann. Rev. Astron. Astrophys., 33, 581
- [] Martini, P., 2003, astro-ph/0304009
- [] Martini, P., Weinberg, D.H., 2001, Astrophys. J., 547, 12
- [] Merritt, D. & Ferrarese, L., 2001, ApJ, 547, 140
- [] Navarro, J.F., Frenk, C.S., White, S.D.M., 1997, Astrophys. J., 490, 493
- [] Press, W. H., Schechter, P., 1974, Astrophys. J., 187, 425
- [] Seljak, U., 2002, M.N.R.A.S., 334, 797
- [] Sheth, R., Torman, G., 2002, M.N.R.A.S., 321, 61
- [] Spergel, D. N, et al., 2003, Astron. J. Supp., 148, 175
- [] Tremaine, S., et al. 2002, ApJ, 574, 740
- [] Volonteri, M., Haardt, F., Madau, P., 2003, Astrophys. J., 582, 559
- [] Willott, C. J., McLure, R. J., Jarvis, M. J., 2003, Astrophys. J., 587, L15
- [] Wyithe, J.S.B., Loeb, A., 2003, Astrophys. J., 595, 614
- [] Yu, Q.; Tremaine, S., 2002, M.N.R.A.S, 335, 965