The SNAP Strong Lens Survey
Abstract
Basic considerations of lens detection and identification indicate that a wide field survey of the types planned for weak lensing and Type Ia SNe with SNAP are close to optimal for the optical detection of strong lenses. Such a “piggy-back” survey might be expected even pessimistically to provide a catalogue of a few thousand new strong lenses, with the numbers dominated by systems of faint blue galaxies lensed by foreground ellipticals. After sketching out our strategy for detecting and measuring these galaxy lenses using the SNAP images, we discuss some of the scientific applications of such a large sample of gravitational lenses: in particular we comment on the partition of information between lens structure, the source population properties and cosmology. Understanding this partitioning is key to assessing strong lens cosmography’s value as a cosmological probe.
1 Introduction
The proposed SNAP satellite, whilst designed for measuring the luminosity distance of Type Ia Supernovae as a function of their redshift [1, 2] and probing the large-scale structure in the Universe through weak gravitational lensing [3], will be an observatory offering high angular resolution optical imaging (PSF FWHM arcsec) over a wide survey field (1000 square degrees) in many (9) filters [4]. This potent combination satisfies the basic requirements of an optical strong gravitational lensing survey. Experience with radio surveys such as CLASS [5] suggests that around one in 1000 high redshift objects may be strongly lensed, whilst the lensing rate for the less visible but far more numerous faint optical galaxies in the optical appears to be significantly lower. These numbers prompt for the examination of very large areas of sky. However, the majority of the multiple-imaging events occur on arcsecond angular scales, requiring sub-arcsecond resolution for their discovery. Finally, the identification of a strong lens system hinges on the achromatic nature of lensing: multi-colour imaging is of enormous value in the initial identification of a lens.
The lensing cross-section in the Universe is dominated by the many massive elliptical galaxies lying at redshifts of 1 or less [6]; galaxy clusters provide more cross-section per object but are rarer. The following strategy suggests itself: search in the vicinity of (easily classified) elliptical galaxies, with (well-understood) photometric redshifts, for characteristic patterns of similarly-coloured images. Similar algorithms have been applied to spectroscopic data [7] and, principally visually, to HST image data [8, 9]. Many lens systems may be expected from simply filtering the 9 filter photometric catalogue from the weak lensing analysis; others will be found by digging deeper into the wings of the lens galaxy light. We begin to quantify the success of SNAP in this regard below. Cluster gravitational lenses are perhaps best discovered by a similarly targeted search for elongated images around congregations of red sequence galaxies [10, 11], followed by an iterative search for more multiple images. Whilst forming part of the ongoing SNAP strong lensing survey project, these lens systems are not discussed here. Instead, we focus on the elliptical galaxy lenses and some of the science they enable.
2 Predicting elliptical lens numbers
| Survey | / sq. degrees | AB magnitude limit | ||
|---|---|---|---|---|
| Deep (SNIa) | 15 | 30.6 | 5000 | few–few tens |
| Wide (WL) | 1000 | 28.3 | 50000 | 100–1000 |
The leftmost columns of Table 1 give the vital statistics of the two baseline surveys planned for SNAP’s initial 4-year observing period. In this work we investigate the capabilities of a “piggy-back” survey, just using the images taken for the two primary experiments and placing no extra demands on the mission.
The expected numbers of lenses are given by the following equations:
| (1) | |||
| (2) |
We follow Mitchell et al. [12] and use the SDSS elliptical galaxy velocity function for the deflector population ; for the faint galaxy sources () we extrapolate somewhat conservatively the HDF galaxy counts from Casertano et al. [13] and apply the model redshift distribution of Massey et al. [14]. For the quasar sources we use the 2dF luminosity functions from Boyle et al. (2000) and Croom et al. (2004) [15, 16], noting that these analyses give different faint end slopes. The final piece of equation 1 is the cross-section for producing an observable multiple image system. This quantity is an integral over the source plane, and is dependent on the lens properties (assumed for simplicity to be singular isothermal spheres [17]), but also the details of the detection process. A multiple image system was taken as having been detected if three pixels of the surface brightness peaks were three times higher than the noise level in the filter 1 image, provided the images were separated by twice the PSF FWHM.
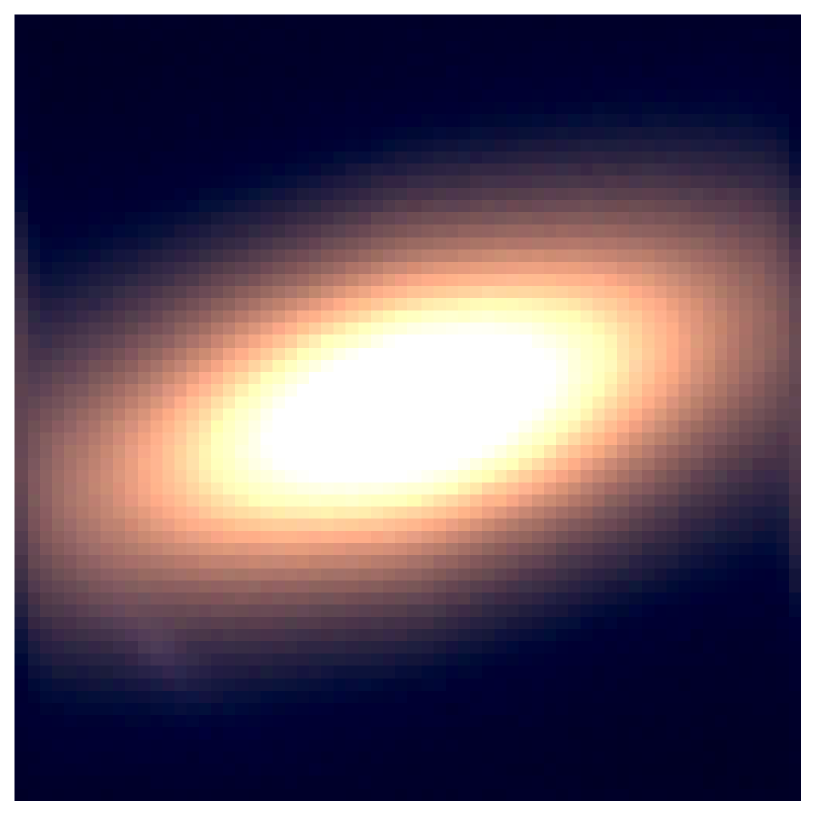
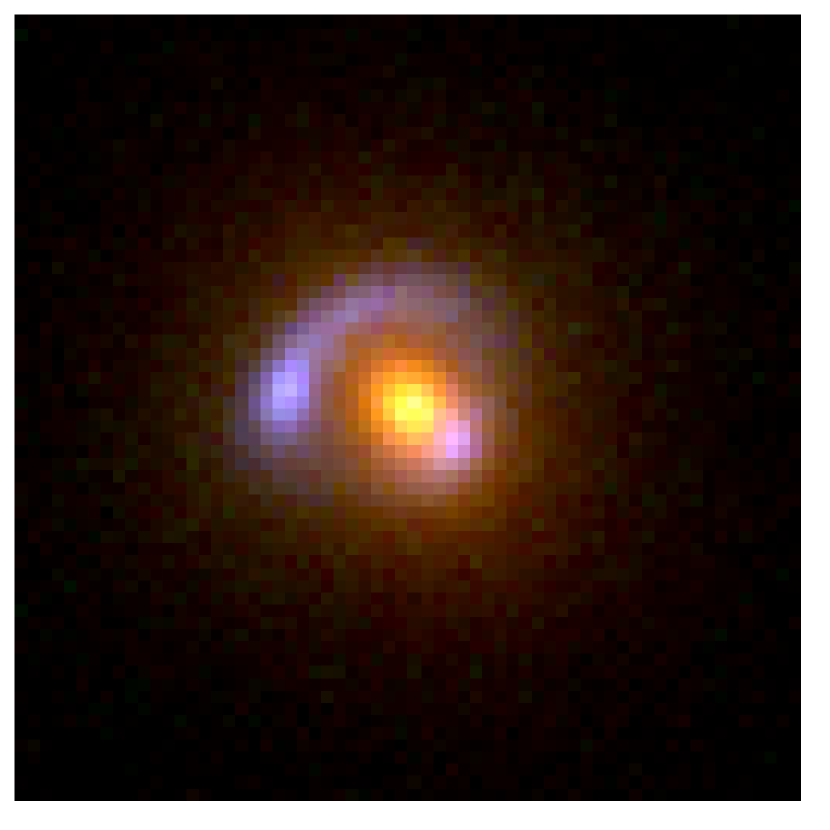
The results of this simple calculation are shown in the righthand columns of Table 1: they suggest that around 1-2% of elliptical galaxies have a multiple image system associated with them. The lensed quasar numbers are most sensitive to the (as yet somewhat poorly measured) faint-end slope of the luminosity function. The galaxy-galaxy lens count prediction is quite sensitive to our ability to separate the lens galaxy light from the source image: the above selection function made no allowance for the lens galaxy. An approximate actual success rate was obtained by visual inspection of a small sample of lenses drawn from the probability distribution defined by the integrand in equation 1. Figure 1 gives an example of a lens system measurable with SNAP, and a system that may well have escaped detection by eye; in these images, the 9 filters have been crudely grouped in threes for the colourisation, and a square root stretch applied. Our preliminary estimate is that as many as 1 in 5 galaxy-galaxy strong lens systems expected from the “invisible lens” selection function will actually be detectable and measurable in the SNAP images; the quasar lenses will be much easier to detect, but their numbers ae still uncertain by an order of magnitude or so. We may hope to improve the galaxy-galaxy lens detection rate with sophisticated 9-filter lens finding algorithms, but for now we anticipate a catalogue of some 10000 strong lenses, dominated by galaxy-galaxy lenses detected in the weak lensing survey.
3 Science from the elliptical lens sample
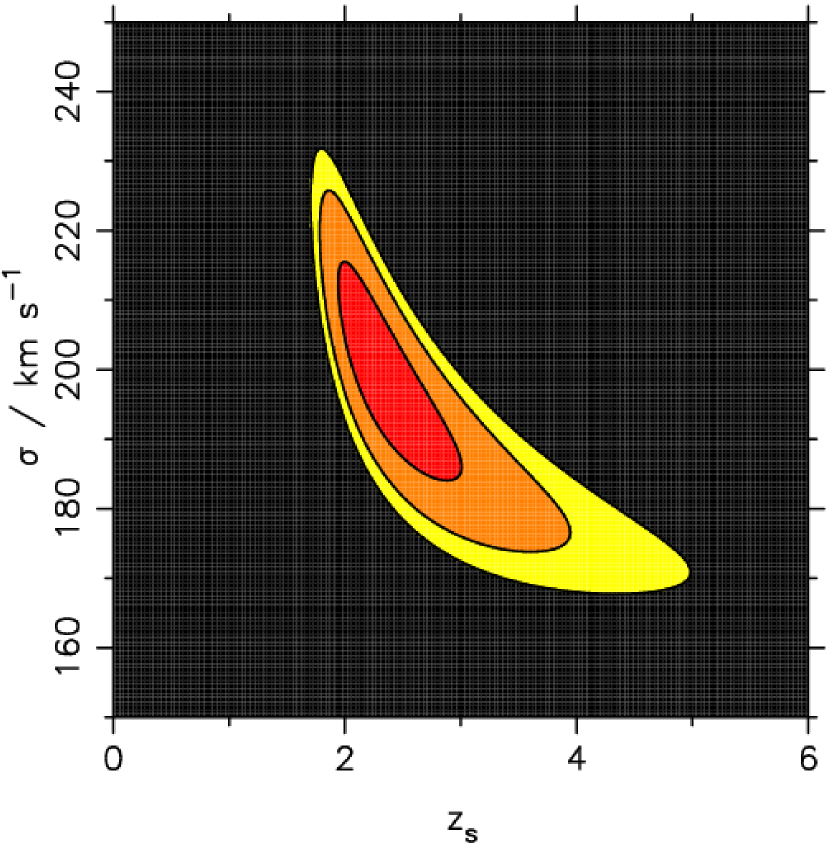
The expected SNAP lens sample would contain much information on the elliptical galaxy mass distributions, the source redshifts and cosmology. How is the information partitioned? An approximate answer to this can be found by qualitatively identifying the subsets of the lens catalogue with discriminating power in each field. In the lefthand panel of Figure 2 we show how the redshift distribution of galaxies too faint for spectroscopy can begin to be investigated using a snapshot spectroscopic follow up campaign on the candidate lens galaxies (providing knowledge of the lens mass and lens redshift). Those systems where the lens and source planes are closely separated give the tightest constraint on the source redshift. Conversely, a subsample of the SNAP strong lens catalogue possessing well-understood source redshifts would open up the possibility of a cosmographic study [18, 19]. The image separation is dependent on cosmology, being proportional to the ratio of angular diameter distances .
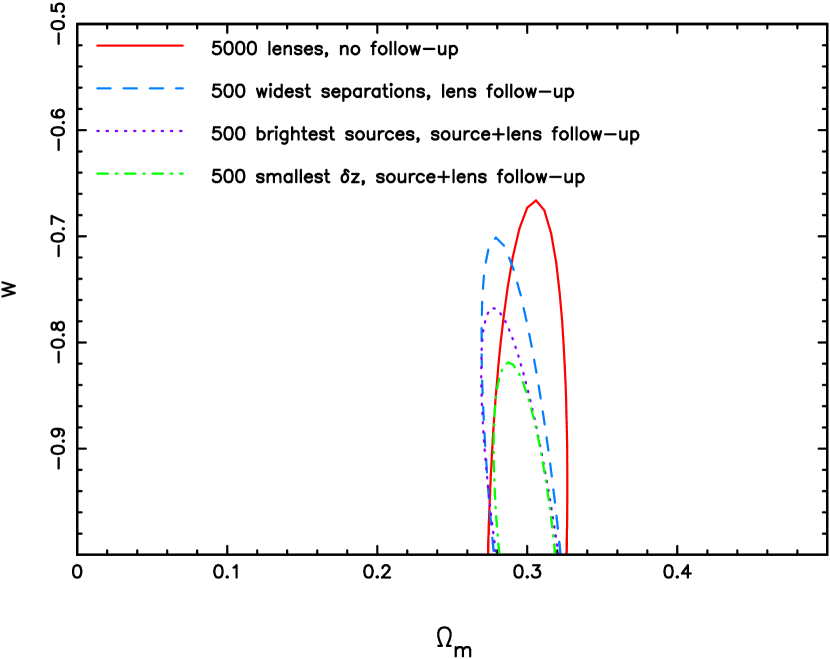
The righthand panel of Figure 2 shows the constraints available in the plane (assuming a flat Universe) from various cosmographic experiments. A conservative estimate of 5000 suitable lenses (with image separations detected and measured to 1/3 of a pixel precision), with photometric redshift uncertainties of 0.02 (lens) and 0.2 (source) and the lens mass just estimated from the SDSS Faber Jackson relation [20] yields interesting, but not competitive, precision. Tighter constraints are gained by focussing on sub-samples of the catalogue and targeting them for spectroscopic follow-up observation. Constraining the mass with spectral velocity dispersion measurements has the biggest effect, suggesting that the SNAP data alone are best used to investigate the mass distribution of elliptical galaxies within an assumed cosmological model. The next step is the assessment of the effect of the lens modelling on the dark energy parameter accuracy.
As seen above, SNAP will detect a significant number of lensed quasars and provide HST-quality optical imaging data for these objects, promising to greatly improve the strong lensing measurment of . What will be needed are complementary time delay measurements: the deep SN survey (with its 4-day observing cadence) could provide time delays for some tens of lensed quasar systems, but the much larger weak lensing survey will only provide single epoch images. There will be a number of survey telescopes operational at the same time as SNAP that could provide time delays for these latter objects; these, together with the SNAP imaging data, should provide excellent constraints on the Hubble constant and allow its scatter (which is sensitive to small-scale mass fluctuations along the line-of-sight) to be investigated.
4 Conclusions
The width and depth of the proposed SNAP observing programmes, their multi-colour nature, and the excellent image quality are all well-suited to a strong lens search. Targeting the elliptical galaxies, we believe that the achromatic excesses in the images can be extracted; the resulting catalogue, containing an unprecedented number of multiple image systems, may then be used for many astrophysical and cosmological experiments, with just a few touched upon here. We anticipate that complementary observations in the spectral and temporal domains will be very important for getting the most out of the SNAP data.
5 Acknowledgments
We thank Dragan Huterer and Charlie Baltay for useful discussions. This work was supported by the Department of Energy contract DE-AC3-76SF00515 to SLAC.
References
- [1] Perlmutter, S. et al. 1999, ApJ, 517, 565
- [2] Riess, A.G. et al. 2004, ApJ, 607, 665
- [3] Rhodes, J., Refregier, A., and Groth, E.J. 2001, ApJL, 552, 85
- [4] Aldering, S.C.G. and The SNAP Collaboration, 2004, PASP submitted, astro-ph/0405232
- [5] Myers, S.T. et al. 2003, MNRAS, 341, 1
- [6] Turner, E.L., Ostriker, J.P. and Gott, J.R., 1984. ApJ, 284, 1
- [7] Bolton, A.S., Burles, S., Schlegel, D.J., Eisenstein, D.J. and Brinkmann, J., 2004, AJ, 127, 1860
- [8] Ratnatunga, K.U., Griffiths, R.E. and Ostrander, E.J. 1999, AJ, 117, 2010
- [9] Fassnacht, C.D., Moustakas, L.A., Casertano, S., Ferguson, H.C., Lucas, R.A. and Park, Y. 2004, ApJL, 600, 155
- [10] Lenzen, F., Schindler, S. and Scherzer, O., 2004, A&A, 416, 391
- [11] Gladders, M.D., Hoekstra, H., Yee, H.K.C., Hall, P.B. and Barrientos, L.F. 2003, ApJ, 593, 48
- [12] Mitchell, J.L., Keeton, C.R., Frieman, J.A. and Sheth, R.K. 2004, astro-ph/0401138
- [13] Casertano, S. et al. 2000, AJ, 120, 2747
- [14] Massey, R. et al. 2004, AJ, 127, 3089
- [15] Boyle, B. et al. 2000, MNRAS, 317, 1014
- [16] Croom, S.M. et al. 2004, MNRAS, 349, 1397
- [17] Koopmans, L. V. E. et al. 2003, ApJ, 599, 70-85
- [18] Paczynski, B. and Gorski, K. 1981, ApJL, 248, L101
- [19] Im, M., Griffiths, R.E. and Ratnatunga, K.U. 1997, ApJ, 475, 457
- [20] Bernardi, M. et al. 2003, AJ, 125, 1849