Multiple Outbursts of a Cataclysmic Variable in the Globular Cluster M22
Abstract
We present a 4 year light curve of a cataclysmic variable in M22, based on an analysis of accumulated data from the MOA microlensing survey. The position of the star coincides with that of a transient event observed by HST in 1999, originally attributed to microlensing but later suspected to be a dwarf nova outburst. Two outburst episodes, one in 2002 and one in 2003, with are seen in the MOA data thus confirming that the HST event was a dwarf nova outburst. The MOA and HST data show that this dwarf nova underwent at least three outburst episodes during 1999–2004. Further close monitoring of this event is encouraged as future outburst episodes are expected.
1 Introduction
Eruptions of cataclysmic variables (CVs) and microlensing are two types of astronomical transient phenomena that are of considerable interest if they are associated with globular clusters. Through their identification with compact binaries, CVs play an important role in the dynamical evolution due to their large binding energy relative to that of the cluster as a whole (Hut et al, 1992). The frequency of outbursts of CVs may play an additional role through the energy releases involved. However, while dozens of CVs in quiescence have now been identified in globular clusters (Pooley et al, 2002), very few have been observed in outburst. On the other hand, in microlensing events, globular clusters can provide source stars for foreground lenses or lenses for background source stars. Such events provide probes of dark matter either as Massive Compact Halo Objects (MACHOS) or as dark objects bound within the clusters themselves (Jetzer, Strassle, & Wandeler, 1998).
In 1999, observations of M22 were carried out by the HST in a program designed to search for microlensing events towards this globular cluster. In an analysis of these data, Sahu et al (2001) reported one event characterized by a brightening and fading of a star by about 3 magnitudes over a 20 day timescale. Having noted that the light curve of the star at baseline featured a 30 day modulation of amplitude 0.1 mag, they interpreted this event to be microlensing of a variable field star in the Galactic Bulge by an unseen foreground lensing object in the cluster. However, in an examination of additional archival HST data, Anderson, Cool, & King (2003) argued that the photometry in the , , , and passbands, together with the derived X-ray luminosity measured in ROSAT/HRI images, all point to the star in question having the same optical and X-ray signatures of a CV in quiescence. They also found that the proper motion of the star matched the mean proper motion of other stars in the cluster and thus argued that the star associated with the event is also in M22. They then inferred that the episode reported by Sahu et al (2001) was probably an outburst of a dwarf nova cataclysmic variable located in M22.
Since 2000, the MOA (Microlensing Observations in Astrophysics) collaboration has been regularly monitoring a number of fields in the Galactic Bulge as part of its microlensing survey program. In mid-2001, a new survey field centred on M22 was added to the program. The accumulated data set therefore provides a useful opportunity to check for possible repeat outbursts and to settle the matter regarding its nature. In this letter we present an analysis of this dataset and extract a 3.5 year light curve where we indeed see two outburst episodes.
2 Observations and Data
The MOA program is carried out using a 60 cm telescope at the Mt John Observatory in New Zealand. Observations of fields towards the Galactic Bulge, including M22, run from February to November in each year. The camera comprises three 2K4K CCD chips giving a total field of view of (1.4°0.9°). The observation images are mainly 180 s exposures through a broadband filter. The images are reduced in real-time using difference imaging to optimise the effectiveness of detecting microlensing and other transient events (Bond et al, 2001). In this process, no transient events were detected near the position of the reported outburst event in M22. This is not unexpected as this star is located in a very dense region crowded with saturated stars and any outburst could have easily been missed by the real-time detection system. We therefore decided to carry out a careful follow-up analysis of ”cameo” images derived by extracting 801801 pixel sub-rasters (corresponding to a field-of-view of 11′), centred approximately on the event. Observations where the seeing was worse than 2.7 were rejected since the effects of saturated stars would wash out any signal from the star of interest. This left us with 440 good quality cameo images spanning the period from June 2001 to November 2004. All observation images were treated with the usual bias subtraction and flat-fielding techniques before extracting cameo images.
3 Analysis and Results
The analysis of these data takes the practice of crowded field photometry to its extreme limit. We do not expect to be able to resolve the source star at baseline, but with a careful application of difference imaging photometry, we can expect to be able to detect the star during any suitably bright outburst episodes. Our difference imaging procedure, described in detail by Bond et al (2001), is as follows. Given a set of time series images of a particular field in the sky, one first chooses a ”reference” image amongst those with the best seeing and signal to noise ratio. The reference is then subtracted from each of the remaining images after applying a convolution operation to the reference image to match the seeing of the other image. The convolution operator is modelled directly using the techniques of Alard & Lupton (1998) and Alard (2000). Our set of cameo images was put this pipeline to produce a set of 439 difference images.
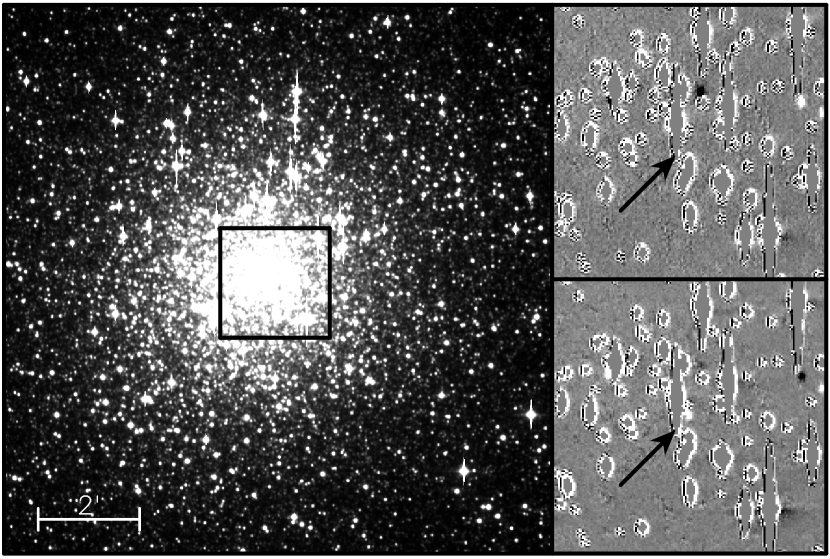
In Fig. 1, we show the reference image together with two difference images—one of which shows a stellar-like image at the position reported by Sahu et al (2001). In difference imaging analysis, these profiles indicate variability associated with a resolved or unresolved star. Although the object indicated in Fig. 1 is partly affected by the nearby saturated star, we are confident that this feature is not some artifact that was somehow introduced into the analysis. The shape of its profile matches that of similar profiles elsewhere on the difference images that are more clearly identified as being associated with stellar variability. We thus identify the feature shown in Fig. 1, as a brightening episode associted with a star that is unresolved in the individual observation images.
We measured the centroid position of the object shown in Fig. 1, by fitting a Gaussian profile to a set of one dimensional profiles in the two axes. We used this measurement to fix the position of the object in the coordinate frame of the reference image. To extract flux measurements from all difference images we first constructed a reference empirical PSF from isolated stars in the reference image. For a given difference image we then placed the empirical PSF, convolved with the convolution operator for that image, at the object centroid. The flux is then the slope of a linear fit to the pixel-to-pixel cross plot of the PSF image and difference image. The contaminating effects of the nearby saturated stars made it necessary to use robust linear fitting techniques that remove outliers as shown in the example in Fig. 2. The resulting light curve is shown in Fig. 3. The outburst shown in Fig. 1 occurred at JD2452570 (2002 Oct 23). This was right at the end of the Galactic Bulge viewing season for 2002 and as such, only one sampling point in the outburst profile was obtained. A second outburst at the event position was detected during JD2452850–2890 (2003 Jul 29–Sep 7). Although the amplitude was not as great as that in the first outburst, these measurements were time resolved.
The light curve is presented as ”delta flux” measurements with respect to the flux of the star on the reference image. The quiescent or baseline flux of the star is well below the MOA detection threshold, so the measurements shown in Fig 3 are effectively total fluxes. Outside the two outburst epeisodes, the delta flux measurements are scattered around the zero point, indicating that the reference image samples the event during baseline or quiescence, or another outburst event with an amplitude below the detection threshold. It is important to note that outside the outbursts, the measurements shown in Fig. 3 are essentially background. Also the light curve only samples the outbursts during those periods when the outburst luminosity is above the MOA threshold. It is also possible that other smaller amplitude outbursts, peaking below the threshold, occurred during 2001–2004.
The flux measurements shown in Fig. 3 are in integrated ADU counts, all photometrically scaled to stellar fluxes on the reference image. To determine standardized magnitudes, we applied the calibration procedure described in Bond et al (2001) using the Johnson-Cousins BVI observations of Monaco et al (2004) as calibration data. In Table 1, we present the corresponding magnitudes from measurements during the two outbursts, where the signal to noise was better than 4. From the scatter in the ADU counts in the lightcurve outside the outburst events, and our calibration information, we estimate the limiting magnitude at the position of this event on the image to be 17.5 (observations within less dense regions of the field would go deeper).
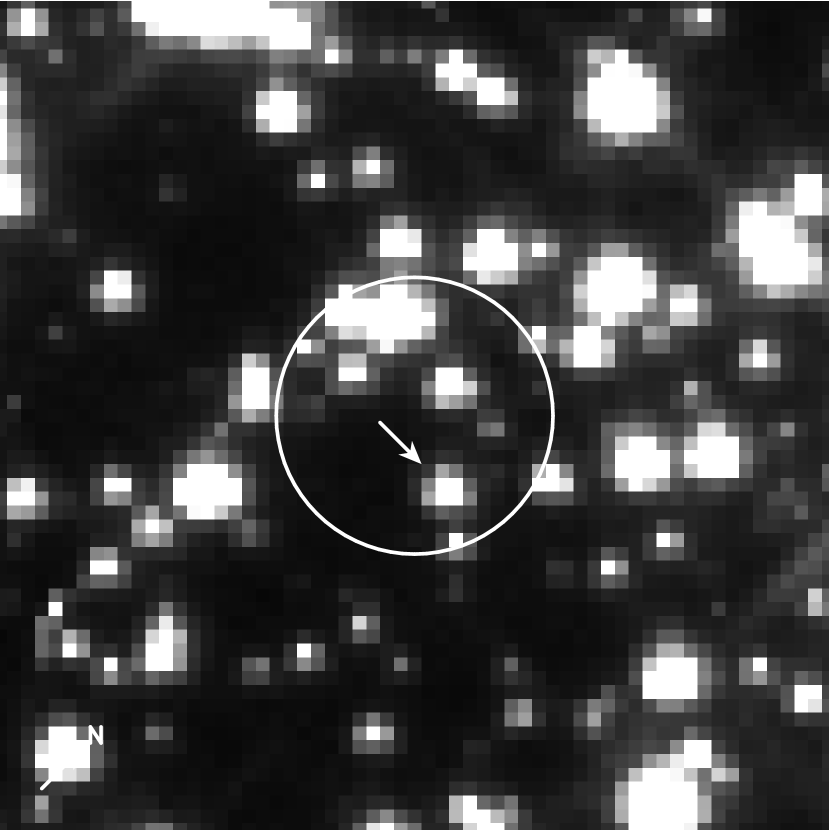
It is clear that the lightcurve shown in Fig. 3 is not microlensing, and is characteristic of multiple outbursts of a cataclysmic variable. We now examine whether or not this is the same event reported by Sahu et al (2001). The object is in one of the standard MOA survey fields for which position calibration information has been obtained (Bond et al, 2001). Our measurement of the centroid position of the object then corresponds to a position in the sky of and with an associated error circle of radius 1″. The uncertainty corresponds to the one standard deviation width of the model Gaussian profile. In Fig 4, we have superimposed this error circle on an image from the HST program that observed M22 in 1999. The resolved star that underwent the brightening episode observed by Sahu et al (2001) is well within the error circle. It is conceivable, that the source star for the outburst events shown in Fig. 3 was some other star within the error circle. However, we consider this very unlikely given that the same star identified by Sahu et al (2001) was also identified as a candidate cataclysmic variable by Anderson, Cool, & King (2003). We therefore conclude that the observed outbursts presented here and the episode reported by Sahu et al (2001) correspond to the same source star that was studied in detail by Anderson, Cool, & King (2003), and that this star is a dwarf nova system.
4 Discussion
Our observations, combined with those of Sahu et al (2001), exhibit a dwarf nova system that underwent at least three outburst episodes during 1999–2004. This is the highest number of outbursts observed for a CV in a globular cluster. The only other cases of multiple outbursts in such systems was that of V2 in 47 Tuc where two outbursts separated by 18 months were seen in a set of HST observations (Paresce & De Marchi, 1994; Shara et al, 1996), and an eruption during June 1985 lasting for more than 10 days of V101 in M5 (Shara, Potter, & Moffat, 1987) followed by another outburst observed in June 1988 (Naylor et al, 1989).
Our observations, together with those of Sahu et al (2001) show that this CV in M22 has outburst episodes of varying amplitudes. The first episode, reported by Sahu et al (2001) attained a peak magnitude of . In the second outburst in 2002, reported here, only one sampling point was possible and so that measurement corresponds to a lower limit on the peak luminosity of . This episode was therefore at least as bright as the first. The third outburst episode, also reported here, was of relatively low amplitude peaking at . Here, we measured a FWHM of 14 days similar that of the episode reported by Sahu et al (2001). The quiescent state magnitude of this object obtained by Sahu et al (2001) from HST observations is . The outburst amplitudes were then infered by subtracting this value from the calibrated magnitudes of the peak luminosities. In all cases the outburst amplitude in the range 2–3 are of the order expected for dwarf novae of stars in the field. Given the quiescent state absolute magnitude of (Anderson, Cool, & King, 2003), this object therefore attains absolute magnitudes brighter than during outburst. The outburst episodes appear semi-regular with a recurrence rate of once every 1–2 years—consistent with the frequency of ”superoutbursts” among dwarf novae in the field (Warner, 1987).
In observations using XMM-Newton, Webb et al (2004) observed an absorption feature at around 1 keV in an X-ray source with an associated 5″ radius error circle that encloses the position of the optical position of this dwarf nova. If this is interpreted as cyclotron resonance, this would place this object in the ”intermediate polar’ subclass of dwarf nova in which matter is accreted from a secondary onto a moderately magnetized compact object Warner (1983). Amongst dwarf novae the compact objects are commonly white dwarfs. However, there exists the interesting possibility that this dwarf nova system harbours an accreting neutron star primary. Webb et al (2004) note that the outburst profile observed by Sahu et al (2001) resembles that of the optical light curve of some X-ray transients. However, counting against this hypothesis is the fact that the outburst amplitudes of X-ray transients of mag are considerably higher than observed here and they recur on much longer timescales of several years. Identifying the nature of the compact object in this system would be of significant interest as this would impact on our understanding of the formation and evolution of binary systems in globular clusters.
In this letter, we have confirmed that an event in M22 originally thought to be microlensing and later suspected of being a cataclysmic variable, is in fact a cataclysmic variable. Having also confirmed that outburst episodes repeat, further close monitoring of this event for future outburst episodes is important. Time resolved X-ray and optical spectroscopy of the source during both quiescent and outburst states are encouraged.
References
- Alard (2000) Alard, C, 2000, A&A, 114, 363.
- Alard & Lupton (1998) Alard, C. & Lupton, R.H., 1998, ApJ, 503, 325.
- Anderson, Cool, & King (2003) Anderson, J., Cool, A.M., & King, I.R., 2003, ApJ, 597, L137.
- Bond et al (2001) Bond, I.A., et al., 2001, MNRAS, 327, 868.
- Hut et al (1992) Hut, P., McMillan, S., Goodman, J., Mateo, M., Phinney, E.S., Pryor, C., Richer, H.B., Verbunt, F., & Weinberg, M., 1992, PASP, 104, 981.
- Jetzer, Strassle, & Wandeler (1998) Jetzer, P., Strassle, M., & Wandeler, U., 1998, A&A, 336, 411.
- Paresce & De Marchi (1994) Paresce, F., & De Marchi, G., 1994, ApJ, 427, L33.
- Monaco et al (2004) Monaco, L., Pancino, E., Ferraro, F.R., & Bellazzini, M., 2004, MNRAS, 349, 1278.
- Naylor et al (1989) Naylor, T., Allington-Smith, J., Callanan, P.J., Hassall, B.J.M., Machin, G., Charles, P.A, Mason, K.O., Smale, A.P., & van Paradijs, J., 1989, MNRAS, 241, 25p.
- Pooley et al (2002) Pooley, D., et al., 2002, ApJ, 569, 405.
- Sahu et al (2001) Sahu, K.C., Casertano, S., Livio, M., Gilliland, R.L., Panagia, N., Albrow, M.D., & Potter, M., 2001, Nature, 411, 1022.
- Shara, Potter, & Moffat (1987) Shara, M.M., Potter, M., & Moffat, A.F.J., 1987, AJ, 94, 357.
- Shara et al (1996) Shara, M.M., Bergeron, L.E., Gilliland, R.L., Saha, A., & Petro, L., 1996, ApJ, 471, 804.
- Warner (1983) Warner, B., in Cataclysmic Variables and related Objects, eds. M. livio & G. Shaviv, Reidel, Dordrecht, p155.
- Warner (1987) Warner, B., 1987, MNRAS, 227, 23.
- Webb et al (2004) Webb, N.A., Serre, D., Gendre, B., Barret, D., Lasota, J.-P., & Rizzi, L., 2004, A&A, 424, 133.


| JD | I |
|---|---|
| 2570.933062 | 15.120.02 |
| 2861.868189 | 16.660.14 |
| 2861.940330 | 16.480.24 |
| 2868.941626 | 15.940.07 |
| 2869.008351 | 15.700.07 |
| 2869.861221 | 15.750.05 |
| 2869.933721 | 15.840.09 |
| 2874.862240 | 16.480.12 |
| 2875.904480 | 16.300.12 |
| 2876.028102 | 16.160.15 |