The merging cluster Abell 85 caught between meals by XMM-Newton
Abstract
Our XMM-Newton observations of Abell 85 confirm the extended 4 Mpc filament first detected with ROSAT, which has an X-ray temperature of about keV and is probably made of groups falling on to the cluster. A comparison of the temperature map with numerical simulations show that Abell 85 had intense merging activity in the past and is not fully relaxed, even in the central region. Finally, a deprojected temperature profile has been calculated and used, together with the suface brightness, to estimate the entropy and pressure profiles. Abell 85 only presents a mild flattening of the entropy profile in the center, showing no evidence of an “entropy floor”.
keywords:
Clusters of galaxies , Abell 85 , X-rays1 Introduction
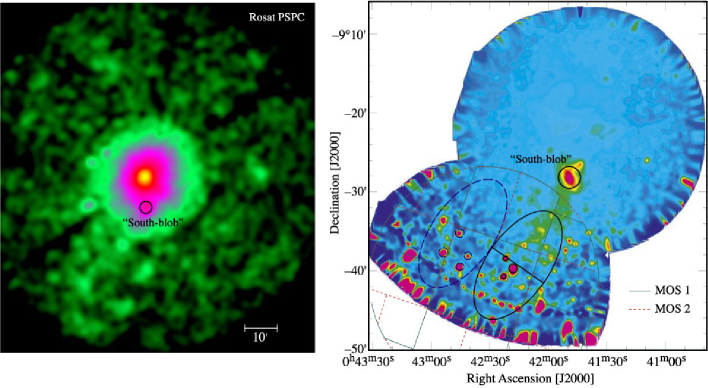
Abell 85 is a very well studied structure both at X-ray [with ROSAT (Pislar et al. 1997, Lima Neto et al. 1997), and with BeppoSAX (Lima Neto et al. 2001)], and optical wavelengths, with extensive redshift and imaging catalogues (Durret et al. 1998a, Slezak et al. 1998); the mean galaxy redshift of Abell 85 is (Durret et al. 1998b) (at , 1 arcmin kpc, assuming , ). It comprises a main cluster, a south blob (a group at the same redshift), a brighter zone south-west of the cluster center coinciding with a Very Steep Spectrum Radio Source relic (hereafter the VSSRS) and an extended filament at least 4 Mpc long. This filament was first discovered with ROSAT by Durret et al. (1998b) and confirmed by XMM-Newton (Durret et al. 2003); it is likely to be a chain of several groups of galaxies, falling on to the main cluster. A comparison of the images of this filament obtained with both satellites is displayed in Fig. 1. The spectral analysis of the filament gives an X-ray temperature between 1.5 and 2.8 keV, implying that it is probably made of groups falling on to the cluster. This interpretation is strengthened by the fact that the gas in the impact region, located between the cluster center and the south blob is indeed hotter, as expected if it was shocked by the infall of groups on to the cluster.
Detailed results on the XMM-Newton analysis of the overall cluster can be found in Durret et al. (2005); they are complementary to those of Kempner et al. (2002) who analyzed Chandra data with higher spatial resolution but in a smaller field. We present here several new results that complete our study of Abell 85 in X-rays.
A full description of the observations and data reduction can be found in Durret et al. (2005) and will not be repeated here.
2 Global properties of the X-ray gas
A general map of Abell 85 in X-rays showing in particular the VSSRS, the impact region and the South Blob can be found in Durret et al. (2005).
We have derived overall temperature and metallicity maps in a grid, where each pixel is XMM EPIC physical pixels, i.e., each cell grid is . In each of these large pixels we make a spectral fit to determine simultaneously the temperature and metallicity.
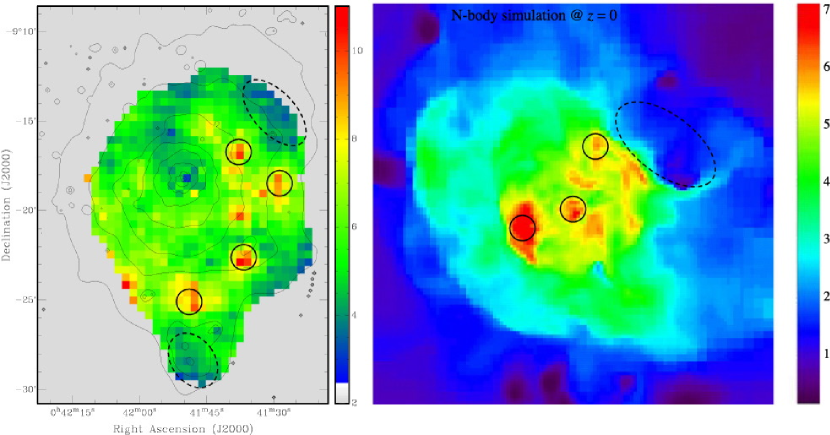
The temperature map is shown in Fig. 2. It shows several interesting features: 1) it is colder near the center; 2) two zones, located at the northwest and southeast of the cluster center, are respectively cooler and hotter than the average cluster; 3) the “impact” region where the groups forming the filament are thought to hit the cluster (just north of the south blob) is hotter, as expected if there is a shock; 4) the VSSRS is somewhat cooler; 5) several hotter patches are observed on the west half of the cluster. Except in the northeast region where the metallicity is higher but the temperature shows no variation relative to the average cluster temperature, the metallicity is anti-correlated with the X-ray gas temperature (see metallicity map in Durret et al. 2005). The right part of Fig. 2 shows a temperature map resulting from the numerical simulation of a cluster merger by Bourdin et al. (2004); this simulation assumes that a seconday cluster falls from the north-west on to the main cluster. The resemblance between both temperature maps is striking: several zones of higher temperature are clearly seen in the simulation, comparable to those observed in the temperature map.
The combination of the temperature and metallicity maps, and the comparison with the temperature map derived from the numerical simulation of Bourdin et al. (2004) strongly suggest that Abell 85 has undergone several mergers. As mentioned above, the “filament” southeast of the cluster is probably made of groups falling on to the main cluster and hitting it in the Impact region. Besides, there has probably been at least one other rather old merger (older than 4 Gyr), from the NW towards the SE. The absence of an intensity enhancement in any of the hotter or more metal rich regions suggests that there is no gas density discontinuity.
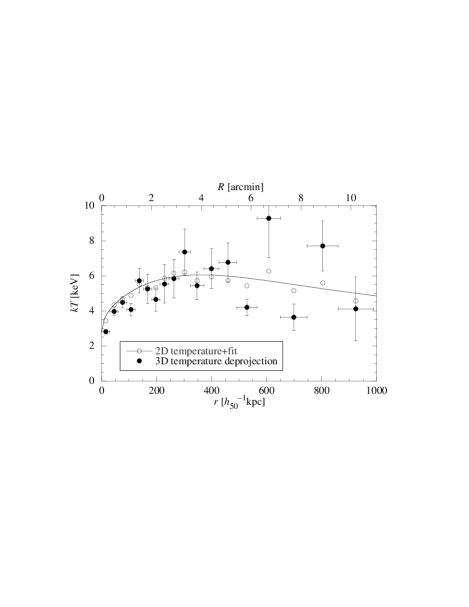
The gas temperature profile was derived as well as the deprojected temperature profile. The 3D temperature profile was obtained following the method described by Churazov et al. (2003), a non-parametric method (assuming spherical symmetry) formulated as a least-squares minimization problem.
As seen from Fig. 3, the projected gas temperature profile shows an obvious decrease towards the center for radii below about 2.5 arcmin (250 kpc), a roughly constant value between radii of 250 and 450 kpc. Beyond 450 kpc, the best fit temperature values show a slow decrease, but the uncertainties are large and the profile is also consistent with a constant value. A decreasing profile agrees with that found e.g. by Markevitch et al. (1999). These variations were taken into account when deriving the dynamical mass. The deprojected temperature profile shows a comparable behaviour, but with much larger error bars.
3 Gas entropy and pressure
Figure 4, left panel, shows the gas pressure profile. Even at our external limiting radius of Mpc, we note that the pressure is at least an order of magnitude higher than in gas rich galaxies. The gas rich galaxies that fall onto Abell 85 should not be able to keep their gas and may lose it before arriving at the core. Thus, in the centre, the metal enrichement would be predominantly due to SN Ia from old stellar generations.


The gas “entropy” profile is shown in Fig. 4, right panel. We call “entropy”, following the trend in cluster litterature, , which is related to the true measure of the gas specific entropy, e.g., Metzler & Evrard (1994). The entropy profile shown here was derived from the surface brightness and temperature analytical fits, cf. Durret et al. (2005).
The bulk of the cluster shows a power-law entropy profile, with , close to the relation found by Piffaretti et al. (2005) for a sample of 13 “cool-core” clusters. The profile slightly flattens near the centre; however, down to the limiting resolution (arcsec) there is no indication of an entropy floor, as seen in some groups and clusters (e.g., Lloyd-Davies et al. 2000; McCarthy et al. 2003), reaching a value as low as keV cm2 at kpc. Nevertheless, the entropy value estimated at (Mpc for Abell 85, cf. Durret et al. 2005) is keV cm2, comparable to the values derived by, e.g., Lloyd-Davis et al. (2000).
The low entropy observed in the core may indicate that the ICM has only a mild heating source in the centre, as expected from the fact that its temperature profile decreases towards the centre but not below keV. This implies that no recent merger has strongly affected the gas temperature at the center, and therefore that mergers have not had any strong effect on the entropy profile in the central regions.
4 Conclusions
The interpretation of the temperature and metallicity maps derived for the X-ray gas in Abell 85 based on numerical simulations by Fujita et al. (1999) and Bourdin et al. (2004) leads us to suggest that Abell 85 has undergone at least two mergers. First, the “filament” southeast of the cluster is probably made of groups falling on to the main cluster and hitting it in the Impact region (Durret et al. 2003). There has most probably also been a rather old merger (older than 4 Gyr), from the NW towards the SE. However, the absence of an intensity enhancement in any of the hotter or more metal rich regions suggests that there is no gas density discontinuity. We intend to achieve more detailed modeling through optical imaging shortly.
References
- [1] Bourdin H., Sauvageot J.-L., Slezak E., Bijaoui A. & Teyssier R., 2004, A&A 414, 429-443, “Temperature map computation for X-ray clusters of galaxies”
- [2] Churazov E., Forman W., Jones C., Böhringer H., 2003, ApJ 590, 225-237, “XMM-Newton Observations of the Perseus Cluster. I. The Temperature and Surface Brightness Structure”
- [3] Durret F., Felenbok P., Lobo C. & Slezak E. 1998a, A&A Suppl. 129, 281-288, “A catalogue of velocities in the cluster of galaxies Abell 85”
- [4] Durret F., Forman W., Gerbal D., Jones C. & Vikhlinin A. 1998b, A&A 335, 41-48, “The rich cluster of galaxies ABCG 85. III. Analyzing the ABCG 85/87/89 complex”
- [5] Durret F., Lima Neto G.B., Forman W. & Churazov E. 2003, A&A 403, L29-L32, “An XMM-Newton view of the extended “filament” near the cluster of galaxies Abell 85”
- [6] Durret F., Lima Neto G.B. & Forman W. 2005, A&A in press, “An XMM-Newton view of the cluster of galaxies Abell 85”, astro-ph/0411527
- [7] Fujita Y., Takizawa M., Nagashima M. & Enoki M., 1999, PASJ 51, L1-L5, “Is Galactic Star-Formation Activity Increased during Cluster Mergers?”
- [8] Kempner J.C., Sarazin C.L. & Ricker P.M. 2002, ApJ 579, 236-246, “Chandra Observations of A85: Merger of the South Subcluster”
- [9] Lima Neto G.B., Pislar V., Durret F., Gerbal D. & Slezak E. 1997, A&A 327, 81-89, “The rich cluster of galaxies ABCG85. II. X-ray analysis using the ROSAT HRI”
- [10] Lima Neto G.B., Pislar V. & Bagchi J., 2001, A&A 368, 440-450, “BeppoSAX observation of the rich cluster of galaxies Abell 85”
- [11] Lloyd-Davies E.J., Ponman T.J. & Cannon D.B., 2000, MNRAS 315, 689-702, “The entropy and energy of intergalactic gas in galaxy clusters”
- [12] Markevitch M., Vikhlinin A., Forman W.R. & Sarazin C.L., 1999 ApJ, 527, 545-553, “Mass Profiles of the Typical Relaxed Galaxy Clusters A2199 and A496”
- [13] Metzler C.A. & Evrard A.E., 1994, ApJ, 437, 564-583, “A simulation of the intracluster medium with feedback from cluster galaxies”
- [14] McCarthy I.G., Holder G.P., Babul A. & Balogh M.L., 2003, ApJ, 591, 526-539, “The Sunyaev-Zeldovich Effect Signature of Excess Entropy in Distant, Massive Clusters”
- [15] Piffaretti R., Jetzer P., Kaastra J.S. & Tamura T. 2005, A&A in press, astro-ph/0412233
- [16] Pislar V., Durret F., Gerbal D., Lima Neto G.B. & Slezak E. 1997, A&A 322, 53-65, “The rich cluster of galaxies ABCG 85. I. X-ray analysis”
- [17] Slezak E., Durret F., Guibert J. & Lobo C., 1998, A&A Suppl. 128, 67-73, “A photometric catalogue of galaxies in the cluster Abell 85”