Search for pulsating pre-main sequence stars in NGC 6383 ††thanks: based on observations with the 0.9m telescope at Cerro Tololo Interamerican Observatory (CTIO), La Serena, Chile.
Abstract
A search for pulsating pre-main sequence (PMS) stars was performed in the young open cluster NGC 6383 using CCD time series photometry in Johnson B & V filters. With an age of only 1.7 million years all cluster members later than spectral type A0 have not reached the ZAMS yet, hence being ideal candidates for investigating PMS pulsation among A and F type stars. In total 286 stars have been analyzed using classical Fourier techniques. From about a dozen of stars within the boundaries of the classical instability strip, two stars were found to pulsate: NGC 6383 #170, with five frequencies simultaneously, and NGC 6383 #198, with a single frequency. In addition, NGC 6383 #152 is a suspected PMS variable star, but our data remain inconclusive.
Linear, non-adiabatic models assuming PMS evolutionary phase and purely radial pulsation were calculated for the two new PMS pulsators. NGC 6383 #170 appears to pulsate radially in third and fifth overtones, while the other three frequencies seem to be of non-radial nature. NGC 6383 #198 pulsates monoperiodically, most probably in the third radial overtone.
Magnitudes and colours were available in the literature for only one third of all stars and we used them for calibrating the remaining.
keywords:
techniques: photometric, stars: pre-main sequence, stars: variables: Scuti, galaxy: open clusters and associations: NGC 63831 Introduction
The study of the first stages in the formation of stars is one of the currently most active research fields in stellar astronomy. Pre-main sequence (PMS) stars lie between the birthline and the zero-age main sequence (ZAMS) in the Hertzsprung-Russell (HR) diagram. They are often characterized by a high degree of activity, strong near- or far-IR excesses and – in most cases – emission lines. They show photometric and spectroscopic variability on time scales of minutes to years, indicating that stellar activity begins in the earliest phases of stellar evolution. During the contraction towards the main sequence intermediate mass PMS stars possess temperatures and luminosities similar to evolved stars in the classical instability strip. This fact suggests that at least part of their activity is due to stellar pulsation.
The existence of pulsating PMS stars was first suggested by Breger (1972), who discovered in the young open cluster NGC 2264 Scuti-like pulsation in two PMS stars. Subsequent observations revealed similar oscillations in several Herbig Ae/Be field stars, e.g. HR 5999 (Kurtz & Marang 1995), as well as in PMS members of the young open cluster NGC 6823 (Pigulski, Kolackowski & Kopacki 2000). All known PMS pulsators populate the spectral range between A2 and F5, their periods lie between 18 minutes (Amado et al. 2004) and several hours, and their amplitudes are at millimagnitude level.
The evolutionary tracks for pre- and post main sequence stars intersect such that stars of fundamentally different evolutionary state have the same effective temperature and luminosity (Breger & Pamyatnykh 1998). Hence, the determination of the evolutionary state of a field star may be ambiguous. Therefore, young open clusters are most suitable to search for pulsating PMS stars.
2 The young open cluster NGC 6383
The open cluster NGC 6383 () is only 1.7Myr old and belongs to the Sgr OB1 association (together with NGC 6611, NGC 6530 and NGC 6531). It has a diameter of 20 arcminutes and is centered around the bright spectroscopic binary HD 159176.
Eggen (1961) studied the stars in NGC 6383 using photoelectric photometry and found that all stars later than A0 lie above the ZAMS. Thé (1965) performed a photographic study in a circular area of 12 arcminutes radius and could confirm Eggen’s results. The core of the cluster was investigated by Fitzgerald et al. (1978) using photoelectric photometry to derive an average colour excess , a cluster distance of 1.5 0.2 kpc, an apparent distance modulus = 11.90 0.25 corresponding to = 10.9 (adopted for our analysis) and a cluster age of 1.7 0.4 Myr. The spectral energy distributions of stars in the central part of NGC 6383 were studied by Thé et al. (1985) with photoelectric photometry in the Walraven WULBV, Cousins VRI and Near-IR JHKLM photometric systems. Their derived colour excess and distance of 1.4 0.15 kpc agree well with the values by Fitzgerald et al. (1978). Van den Ancker, Thé & de Winter (2000) investigated the central part of this cluster using low-resolution CCD spectroscopy and confirmed that all stars later than A0 lie above the ZAMS. They also report that several cluster members show an infrared excess, indicative of the presence of circumstellar dust, heated by the central star. They found Hα in emission only for their star #4 and identified it as a new Herbig Ae star.
All these characteristics make NGC 6383 an ideal target for the search of PMS pulsating stars.
3 Observations & data reduction
CCD photometric time series in Johnson B & V filters were obtained with the 0.9m telescope at the Cerro Tololo Interamerican Observatory (CTIO), Chile, from Aug 11 to Aug 24, 2001, using the 2084 x 2046 SITe CCD chip, which provides a field of view (fov) of 13 x 13 arcminutes. In total, 53.25 hours photometry could be acquired within 8 clear nights.
The basic reductions (bias subtraction, flat-fielding) were performed using standard IRAF routines. The Multi Object Multi Frame (MOMF) software developed by Kjeldsen & Frandsen (1992) was used to extract the photometric signal. MOMF is optimized to analyze photometric time series (i.e. a large number of CCD frames per night) of semi-crowded fields by combining point-spread function fitting and aperture photometry. MOMF determines absolute and relative magnitudes of each star identified on the frames and their corresponding standard deviations. The absolute values are raw, uncorrected, instrumental magnitudes, whereas the relative light curves are determined by subtracting a weighted mean of all stars on the frame. Variable and non-variable, extremely red or blue stars are used to determine the weighted mean, requiring colour-dependent extinction corrections (see Sect. 3.1).
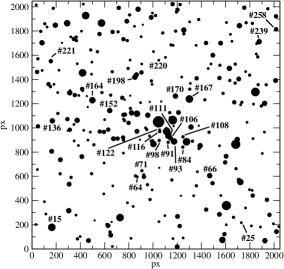
286 stars have been identified (see Fig. 1) for which light curves using the optimum aperture producing minimal point-to-point scatter were generated. Nightly means were subtracted to correct for zero-point changes and long-term irregular light variations which probably are due to variable extinction by circumstellar dust.
For all 286 stars, a detailed frequency analysis was performed in both filters using the Fourier Analysis program Period98 (Sperl 1998) which is based on the Discrete Fourier Transformation (DFT, Deeming 1975) and provides a multi-sine fit option. A signal was considered to be significant if it exceeds four times the noise level in the amplitude spectrum. (Kuschnig et al. 1997).
Our own star numbers are used, cross references with the literature are given according to the publications by Fitzgerald et al. (1978), e.g. NGC 6383 #F4, by Thé (1965), e.g. NGC 6383 #T47, and Evans (1978), e.g. NGC 6383 #EV281.
3.1 Colour-dependent extinction
A systematic effect was encountered for differential light curves of some stars. Towards the end of the nights some stars became continuously brighter, but others fainter. The corresponding Bouguer plots (i.e. magnitude vs. airmass) showed that different colours were the explanation. Hence, the extinction correction had to include also the colour-dependent coefficient (Sterken & Manfroid 1992) in:
| (1) |
where is the uncorrected magnitude, is the airmass and the principal extinction coefficient. In our case, the colour index was taken as .
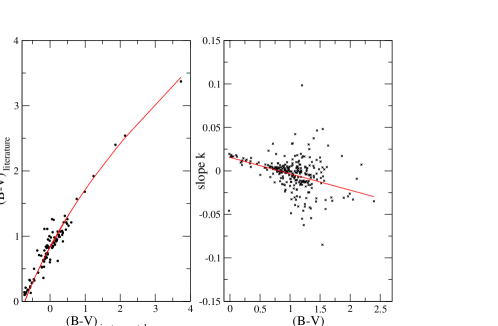
The values available in the literature for 97 stars show a clear correlation with the slope, k, of the Bouguer plots (see Fig. 2). The relation between the 97 stars with from the literature and the instrumental values from our observations is modelled by an inverse second-order polynomial (solid line in Fig. 2). The three polynomial coefficients evaluate to , and . values for all stars could then be transformed to the standard system according to:
| (2) |
where are the transformed indices and are our instrumental values (see Fig. 2).
.
4 Variable Stars
About a dozen PMS cluster members have been selected as prime candidates to search for pulsation in NGC 6383 due to their spectral type and/or position in the HR-diagram. The major criterion has been the location of the stars in the region of the classical instability strip. But only two stars clearly show Scuti-like pulsation within our data, NGC 6383 #170 (, ) and NGC 6383 #198 (, ), and for NGC 6383 #152 pulsation can only be suspected.
The other PMS candidates for pulsation remain inconclusive in our data (e.g. they show variability only in one filter or the data quality is not good enough) and therefore need further investigation.
4.1 Pulsating PMS stars
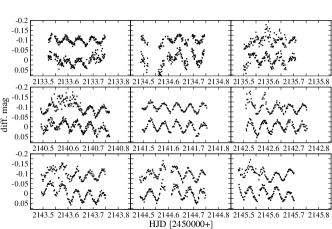
4.1.1 NGC 6383 #170 (#F4)
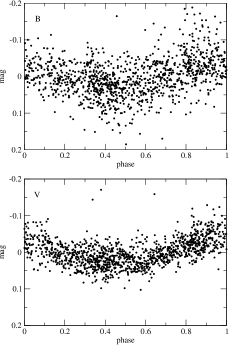
For NGC 6383 #170 (V = 12.61 mag), Thé, Hageman & Westerlund (1985) found Hα in emission and a large amount of excess radiation in the NIR, typical for Herbig Ae/Be stars. With a spectral type of A5 IIIp, a confirmed membership to NGC 6383, and a position above the ZAMS #170 is a newly discovered PMS pulsator (see Fig. 3). Five frequencies spanning a period range between 1.24 and 2.89 hours have been detected. These frequencies, Johnson B & V amplitudes and phase shifts are listed in Table 1. All amplitude and phase errors were computed using the software package epsim (Reegen 2003).
| star | no | frequency | V amp. | B amp. | phase |
|---|---|---|---|---|---|
| [d-1] | [mmag] | [mmag] | |||
| #170 | f1 | 14.376 | 12.5(8) | 16.0(6) | -0.243(8) |
| f2 | 19.436 | 11.3(3) | 14.9(5) | -0.092(7) | |
| f3 | 13.766 | 9.8(4) | 12.3(7) | 0.474(8) | |
| f4 | 8.295 | 8.6(7) | 11.1(7) | 0.035(6) | |
| f5 | 17.653 | 7.6(9) | 9.8(5) | -0.050(9) | |
| #198 | f1 | 19.024 | 20.8(9) | 26.4(6) | 0.114(3) |
| #15 | f1 | 14.587 | 8.5(3) | 8.4(3) | 0.389(4) |
| f2 | 16.972 | 4.0(3) | 6.2(2) | -0.605(4) |
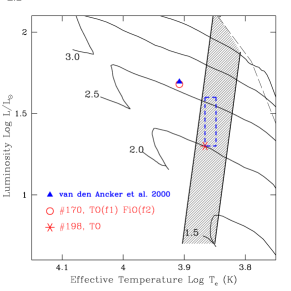
Linear, non adiabatic pulsation was calculated for radial modes of PMS models resulting in three possible solutions. No model reproduces all five frequencies simultaneously, but given the probable coexistence of radial and nonradial modes in these stars this could simply mean that not all frequencies correspond to radial pulsation. The model fitting the observed frequencies best, gives a stellar mass of , , , and pulsation in third (f1) and fifth overtones (f2). The solution seems to be optimal, because it is closest to the parameters derived spectroscopically by van den Ancker, Thé & de Winter (2000): and (filled symbol in Fig. 4).
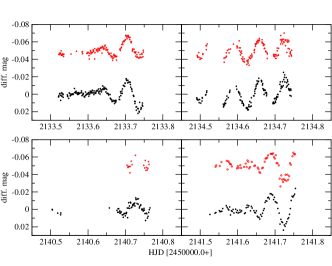
4.1.2 NGC 6383 #198 (#T55)
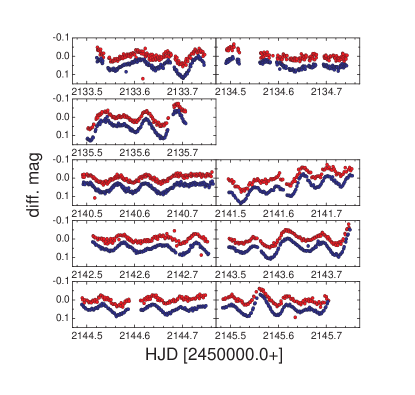
Only one frequency of 19.024 d-1, corresponding to a period of 1.26 hours, is significant in both filters (see Table 1), but the light curve shown in Fig. 5 indicates multi-periodicity.
Calculations of linear, non-adiabatic, radial pulsation models were performed (see Fig. 4). As no spectral classification is available for this star, the and values were used to derive empirical ranges of luminosity and effective temperature based on the transformations given by Kenyon & Hartmann (1995). These ranges are indicated by the dashed box in Fig. 4. Only for pulsation in the third overtone (TO) the theoretical models have temperatures and luminosities close to the observations. Such a high overtone mode is rather difficult to explain in case of monoperiodic pulsation, other modes may be buried in the noise.
Relying on the cluster membership of NGC 6383 #198, it seems reasonable that the star pulsates with a single frequency in the third radial overtone having , and .
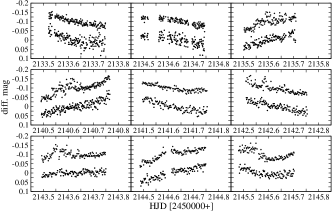
4.1.3 NGC 6383 #152 (#T54)
With mag #152 falls within the boundaries of the classical instability strip (Fig. 10). But only one significant frequency of 2.55 d-1 with a peak-to-peak amplitude of 30 mmag appears in the B data. Unfortunately the V filter data are of worse quality, where the noise is so dominant that no peak in the amplitude spectrum exceeds four times the noise level.
Although this star has been one of the primary targets in NGC 6383 to search for PMS pulsators, it remains inconclusive in our data. Longer time series of better quality have to be obtained to unambiguously decide about variability.
4.2 Other Variables
For several other stars, that probably are not pulsating PMS cluster members, variability could also be detected. A list of suspected variable stars is given in Table 2.
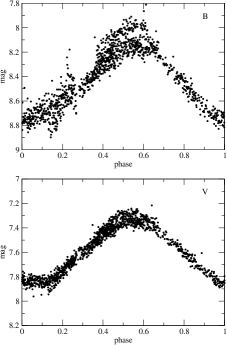
4.2.1 NGC 6383 #15 (#T47)
mag and mag together with its position in the HR-diagram indicate that this star is not a member of the cluster. Two frequencies, corresponding to periods of 1.645 and 1.414 hours, were found to be significant (see Table 1). As it is most likely in the foreground, it seems to be a classical Scuti type star (see Fig. 6). The amplitude and phase errors were computed using the software package epsim (Reegen 2003).
4.2.2 NGC 6383 #25
No astrophysical parameters were available from the literature for NGC 6383 #25. Our transformation yields mag and mag. A frequency of 1.19755 d-1, i.e. a period of 20.04 hours, leads to a phase plot shown in Fig. 7.
mag corresponds to a spectral type of M5 and is associated to , and according to Schmidt-Kaler (1965). Assuming a rotation period of 20.04 hours, the equatorial rotational velocity is 16.37 km s-1. This velocity would be in agreement with a rotating, active and weak-lined T Tauri star.
4.2.3 NGC 6383 #71
No astrophysical information was available from the literature for NGC 6383 #71. Our calculations give = 15.37 mag and = 1.35 mag. If the star belongs to the cluster, it is an early K type star (Schmidt-Kaler 1965).
Two frequencies of 2.759 and 2.240 d-1, i.e. periods of 8.688 and 10.714 hours, respectively, were detected (Fig. 8). A variability on this time scale cannot be explained assuming cluster membership. Permitting NGC 6383 #71 to be more distant than the cluster itself, interstellar reddening may shift its position in the HR-diagram into the SPB, or Cephei domain. A clear decision can only be drawn from spectroscopy.
4.2.4 NGC 6383 #64
No information about this star was found in the literature. According to our observations, the star has only 16.72 mag in and mag. A single frequency of 2.499 (corresponding to a period of 9.605 hours) with a peak-to-peak amplitude of approximately 20 mmag is found to be significant in both B and V light curves and leads to the phase plot shown in Fig. 9.
| star | ref | V | B-V | Mv | sp | var. in filter | remarks | |
| # | mag | mag | mag | mag | B / V / B & V | |||
| 170 | F 4 | 12.61 | 0.60 | 1.00 | 0.37 | A5 | B & V | new PMS pulsator |
| 198 | T 55 | 12.90 | 0.36 | 0.93 | 0.3 | - | B & V | new PMS pulsator |
| 152 | T 54 | 12.45 | 0.70 | 0.44 | 0.24 | - | B & V | suspected PMS pulsator |
| 15 | T 47 | 10.08 | 0.34 | -1.87 | 0.01 | - | B & V | foreground Scuti star |
| 25 | - | 16.77 | 1.58 | 4.87 | 1.25 | - | B & V | T Tauri star |
| 64 | - | 16.72 | 1.63 | 4.82 | 1.30 | - | B & V | probably not a cluster member |
| 71 | - | 15.37 | 1.35 | 3.47 | 1.02 | - | B & V | probably not a cluster member |
| 66 | T 28 | 12.59 | 0.33 | 0.63 | -0.17 | - | B | inconclusive in V |
| 84 | - | 15.98 | 1.31 | 4.08 | 0.99 | - | B | inconclusive in V |
| 91 | F 10 | 15.3 | 0.9 | 3.41 | 0.62 | - | B | inconclusive in V |
| 93 | F 20 | 11.42 | 0.17 | -0.43 | -0.24 | B8 | B & V | different periods in B & V |
| 98 | F 11 | 15.10 | 1.06 | 3.26 | 0.81 | - | B & V | T Tauri candidate |
| 106 | F 6 | 13.77 | 0.52 | 1.93 | 0.27 | A6 | B & V | known IR excess |
| 108 | - | 15.61 | 1.45 | 3.71 | 1.12 | - | B & V | P7.26 hours, inconclusive |
| 111 | F 8 | 12.82 | 0.32 | 1.00 | 0.00 | - | B & V | P5.65 hours, inconclusive |
| 116 | - | 15.13 | 1.31 | 3.23 | 0.98 | - | B & V | T Tauri candidate |
| 122 | - | 16.44 | 1.42 | 4.54 | 1.09 | - | B & V | unresolvable |
| 136 | T 52 | 12.33 | 0.72 | 0.43 | 0.39 | - | B | inconclusive in V |
| 164 | T 5 | 11.31 | 0.011 | -0.6 | -0.32 | - | B & V | P2 days, amplitude 30 mmag |
| 167 | F 3 | 10.3 | 0.29 | -1.57 | -0.05 | - | B | saturated in V |
| 220 | - | 16.67 | 2.03 | 4.77 | 1.70 | - | V | P2.87 hours in V |
| 221 | - | 16.54 | 1.19 | 4.64 | 0.86 | - | B & V | irregular variable, T Tauri candidate |
| 239 | T 77 | 12.50 | 0.85 | 0.61 | 0.59 | - | B & V | probably not a cluster member |
| 258 | - | 14.56 | 0.69 | 2.66 | 0.69 | - | B & V | different periods in B & V |
5 Conclusions
Photometric time series of 286 stars in the field of the young open cluster NGC 6383 were analyzed using classical Fourier techniques in order to detect pulsation among PMS members of spectral types A to F. A higher number of PMS pulsators would allow to confine the boundaries of the PMS instability strip observationally and especially investigate a possible difference to the classical instability region.
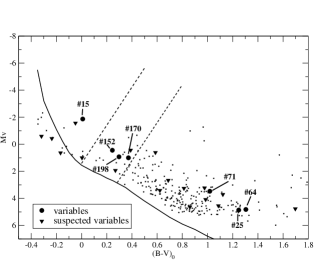
The computed and values were dereddened using mag and the apparent distance modulus of corresponding to = 10.9 and a distance of kpc derived by Fitzgerald et al. (1978). Out of 15 cluster members that fall in the region of the classical instability strip (see Fig. 10), for only two, NGC 6383 #170 and NGC 6383 #198, pulsation could be clearly detected, whereas for NGC 6383 #152 variability can only be suspected. This corresponds to 20% variable stars within the region of the classical instability strip in NGC 6383 down to a noise level of 0.2 mmag in V and 0.1 mmag in B in the Fourier domain. The percentage of detected pulsating PMS stars in the instability region is somewhat lower than is observed for their post-ZAMS counterparts.
A literature search was performed for additional information about all stars in NGC 6383. For the Herbig Ae star NGC 6383 #170, one of the two discovered pulsating PMS stars, van den Ancker, Thé & de Winter (2000) found a large infrared excess, Hα in emission, and indications for the presence of circumstellar gas in the spectrum. We support the idea of circumstellar material around NGC 6383 #170, because the raw photometric time series show additional irregular light variations on longer time scales than for pulsation. Only magnitude and colours are available in the literature for NGC 6383 #198, but its light curve and position in the HR-diagram provide clear evidence for another new PMS pulsator.
For all stars on the frames, magnitudes and colours are given in Table LABEL:data in the Appendix.
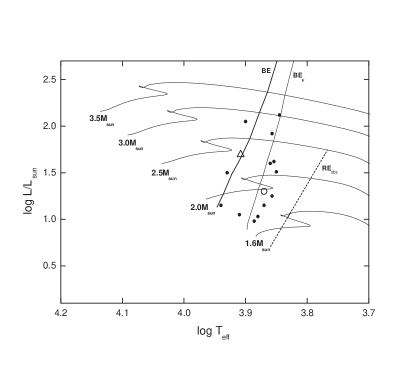
The location of 15 known PMS pulsators in the HR-diagram is shown in Fig. 11. The values for and for the PMS pulsators are taken from Marconi & Palla (2003), Marconi (2004, priv. comm.), Amado et al. (2004) and Koen et al. (2003), the PMS evolutionary tracks from D’Antona & Mazzitelli (1994), the borders of the classical instability strip from Breger & Pamyatnykh (1998), where REobs marks the empirical red edge, BE the general blue edge for the radial overtones, and BEF the blue edge for the fundamental mode. However, the number of known PMS pulsators remains insufficient to determine empirically the PMS instability strip.
Acknowledgments
This project was supported by the Austrian Fonds zur Förderung der wissenschaftlichen Forschung (P14984). Fourier Analysis was performed using the program Period98 written by M. Sperl (1998). Use was made of the WEBDA database, operated at the Institute of Astronomy of the University of Lausanne. Finally, it is a pleasure to acknowledge E. Paunzen for valuable comments on data reduction, A. Pamyatnykh for fruitful discussions, as well as S. Frandsen and T. Arentoft for their patient introduction to the MOMF software.
References
- Amado (2004) Amado P.J., Moya A., Suárez J.C., Martin-Ruiz S., Garrido R., Rodriguez E., Catala C., Goupil M.J., 2004, MNRAS, preprint (astro-ph/6110A)
- Breger (1972) Breger M., 1972, ApJ, 171, 539
- Breger (1998) Breger M., Pamyatnykh A., 1998, A&A, 332, 958
- D’Antona (1994) D’Antona F., Mazzitelli I., 1994, ApJS, 90, 467
- Deeming (1975) Deeming T.J., 1975, Ap&SS, 36, 137
- Eggen (1961) Eggen O.J., 1961, Roy. Obs. Bull., 27, 61
- Evans (1978) Evans, T.L., 1978, MNRAS, 184, 661
- Fitzgerald (1978) Fitzgerald M.P., Jackson P.D., Luiken M., Grayzeck E.J., Moffat A.F.J., 1978, MNRAS, 182, 607
- Kenyon (1995) Kenyon S.J., Hartmann L., 1995, ApJS, 101, 117
- Kjeldsen (1992) Kjeldsen H., Frandsen S., 1992, PASP, 104, 413
- Koen (2003) Koen C., Balona L.A., Khadaroo K., Lane I., Prinsloo A., Smith B., Laney C.D., 2003, MNRAS, 344, 1250
- Kurtz (1995) Kurtz D., Marang F., 1995, MNRAS, 276, 191
- Kuschnig (1997) Kuschnig R., Weiss W.W., Bahr R., Bely P., Jenkner H., 1997, A&A, 328, 544
- Marconi (1998) Marconi M., Palla F., 1998, AJ, 507, L141
- Marconi (2003) Marconi M., Palla F., 2003, Ap&SS, 284, 245
- Palla (1993) Palla F., Stahler S.W., 1993, ApJ, 418, 414
- Pamyatnykh (2000) Pamyatnykh A., 2000, in Breger M., Montgomery M. H., eds., ASP Conf. Ser. 210, Delta Scuti and related stars. Astron. Soc. Pac., San Francisco, p. 215
- Pigulski (2000) Pigulski A., Kolackowski Z., Kopacki G., 2000, in Szabados L., Kurtz D.W., eds., Proc. IAU Coll. 176, ASP Conf. Ser. 203, The impact of large scale surveys on pulsating star research. Astron. Soc. Pac., San Francisco, p. 499
- Reegen (2003) Reegen P., 2003, in Proc. of the Second EDDINGTON Workshop, Stellar Structure and Habitable Planet Finding, in press
- Schmidt (1965) Schmidt-Kaler, Th., 1965 in Landolt-Börnstein, Numerical data and functional relationships in science and technology, group VI, vol. I, pp.284. Springer Verlag, Berlin
- Sperl (1998) Sperl M., 1998, Comm. Ast. 112, 1
- Sterken (1992) Sterken C., Manfroid J., 1992, Astronomical Photometry. Kluwer Academic Publishers
- The (1965) Thé P.S., 1965, Contr. from the Bosscha Obs., No. 32
- The (1985) Thé P.S., Hageman T., Westerlund B.E., Tjin A Djie H.R.E., 1985, A&A, 151, 391
- vandenancker (2000) Van den Ancker M.E., Thé P.S., de Winter D., 2000, A&A, 362, 580
Appendix A Photometric data
For all stars located on the CCD chip, and values were computed using our transformation (described in Sect. 3.1). Assuming cluster membership they were dereddened using mag and mag (Fitzgerald et al. 1978). The resulting photometric data (, , and ) are listed in Table LABEL:data.
| no | ref | X | Y | V | |||
| # | [px] | [px] | [mag] | [mag] | [mag] | [mag] | |
| 1 | T 32 | 1199.72 | 18.23 | 13.431 | 0.713 | 1.531 | 0.383 |
| 2 | - | 664.68 | 20.66 | 16.263 | 1.290 | 4.363 | 0.960 |
| 3 | T 13 | 1924.37 | 68.24 | 12.056 | 0.210 | 0.156 | -0.120 |
| 4 | T 38 | 466.83 | 69.62 | 13.627 | 0.758 | 1.727 | 0.428 |
| 5 | T 19 | 1573.26 | 74.82 | 11.645 | 1.303 | -0.255 | 0.973 |
| 6 | - | 375.99 | 82.95 | 15.563 | 0.878 | 3.663 | 0.548 |
| 7 | - | 1164.79 | 86.15 | 16.818 | 1.327 | 4.918 | 0.997 |
| 8 | - | 817.81 | 87.60 | 16.852 | 1.209 | 4.952 | 0.879 |
| 9 | - | 1248.96 | 91.15 | 16.866 | 1.144 | 4.966 | 0.814 |
| 10 | - | 397.82 | 102.68 | 16.438 | 1.060 | 4.538 | 0.730 |
| 11 | T 39 | 651.10 | 114.00 | 13.374 | 0.672 | 1.474 | 0.342 |
| 12 | EV 281 | 1589.78 | 122.32 | 14.596 | 1.706 | 2.696 | 1.376 |
| 13 | - | 644.77 | 140.70 | 15.357 | 1.046 | 3.457 | 0.716 |
| 14 | T 12 | 2019.93 | 143.29 | 13.038 | 0.792 | 1.138 | 0.462 |
| 15 | T 47 | 164.02 | 178.78 | 10.030 | 0.339 | -1.870 | 0.009 |
| 16 | - | 1887.08 | 181.27 | 17.003 | 1.250 | 5.103 | 0.920 |
| 17 | - | 2039.42 | 184.29 | 16.689 | 1.225 | 4.789 | 0.895 |
| 18 | T 31 | 1220.05 | 189.32 | 14.006 | 0.736 | 2.106 | 0.406 |
| 19 | - | 1812.81 | 190.70 | 16.166 | 1.133 | 4.266 | 0.803 |
| 20 | T 40 | 628.59 | 193.29 | 13.264 | 0.605 | 1.364 | 0.275 |
| 21 | - | 1605.13 | 199.85 | 16.077 | 1.518 | 4.177 | 1.188 |
| 22 | - | 31.87 | 201.90 | 16.383 | 0.993 | 4.483 | 0.663 |
| 23 | - | 619.57 | 202.99 | 15.158 | 1.178 | 3.258 | 0.848 |
| 24 | - | 1994.76 | 208.01 | 16.794 | 1.219 | 4.894 | 0.889 |
| 25 | - | 1729.50 | 217.61 | 16.767 | 1.578 | 4.867 | 1.248 |
| 26 | - | 658.03 | 223.70 | 17.094 | 1.273 | 5.194 | 0.943 |
| 27 | - | 1049.01 | 225.60 | 16.861 | 1.186 | 4.961 | 0.856 |
| 28 | - | 517.64 | 236.29 | 17.093 | 2.194 | 5.193 | 1.864 |
| 29 | T 41 | 727.62 | 259.08 | 10.913 | 1.192 | -0.987 | 0.862 |
| 30 | - | 1664.79 | 261.29 | 15.050 | 0.843 | 3.150 | 0.513 |
| 31 | T 30 | 1202.61 | 268.73 | 13.379 | 0.914 | 1.479 | 0.584 |
| 32 | - | 1097.97 | 275.27 | 16.731 | 1.346 | 4.831 | 1.016 |
| 33 | - | 364.16 | 280.00 | 16.741 | 1.164 | 4.841 | 0.834 |
| 34 | - | 1961.79 | 281.93 | 14.550 | 1.162 | 2.650 | 0.832 |
| 35 | T 29 | 1548.39 | 286.17 | 13.655 | 0.818 | 1.755 | 0.488 |
| 36 | - | 115.06 | 288.75 | 16.779 | 1.049 | 4.879 | 0.719 |
| 37 | T 46 | 304.32 | 316.07 | 12.675 | 0.759 | 0.775 | 0.429 |
| 38 | - | 1439.01 | 325.23 | 14.780 | 0.778 | 2.880 | 0.448 |
| 39 | - | 1764.32 | 338.96 | 16.081 | 1.105 | 4.181 | 0.775 |
| 40 | - | 836.25 | 351.06 | 16.542 | 1.428 | 4.642 | 1.098 |
| 42 | - | 788.92 | 381.86 | 16.293 | 1.240 | 4.393 | 0.910 |
| 43 | - | 102.83 | 390.66 | 16.382 | 1.196 | 4.482 | 0.866 |
| 44 | - | 1941.02 | 405.92 | 14.340 | 0.825 | 2.440 | 0.495 |
| 45 | - | 975.65 | 408.16 | 15.494 | 1.073 | 3.594 | 0.743 |
| 46 | - | 1231.15 | 439.34 | 17.018 | 1.304 | 5.118 | 0.974 |
| 47 | EV 109 | 1335.71 | 439.39 | 16.672 | 1.114 | 4.772 | 0.784 |
| 48 | - | 1823.24 | 440.78 | 14.399 | 0.857 | 2.499 | 0.527 |
| 49 | - | 1559.90 | 441.50 | 16.519 | 1.588 | 4.619 | 1.258 |
| 50 | - | 593.61 | 454.80 | 16.441 | 1.152 | 4.541 | 0.822 |
| 51 | - | 1819.27 | 483.77 | 16.148 | 1.062 | 4.248 | 0.732 |
| 52 | - | 992.62 | 488.38 | 16.745 | 1.425 | 4.845 | 1.095 |
| 53 | - | 1796.40 | 489.68 | 16.211 | 1.112 | 4.311 | 0.782 |
| 54 | - | 668.14 | 520.89 | 16.908 | 1.558 | 5.008 | 1.228 |
| 55 | EV 108 | 1357.83 | 522.08 | 15.690 | 1.204 | 3.790 | 0.874 |
| 56 | - | 954.27 | 530.73 | 15.653 | 1.136 | 3.753 | 0.806 |
| 57 | T 45 | 307.36 | 535.32 | 13.276 | 2.410 | 1.376 | 2.080 |
| cross references according to: T … Thé (1965), EV … Evans (1978), | |||||||
| F … Fitzgerald et al. (1978) | |||||||
Photometric data no ref X Y V # [px] [px] [mag] [mag] [mag] [mag] 58 EV 107 1492.03 543.14 14.841 1.002 2.941 0.672 59 T 96 1721.10 553.00 11.403 0.704 -0.497 0.374 60 EV 111 1155.64 570.06 15.681 0.915 3.781 0.585 61 - 1709.27 570.10 14.552 0.920 2.652 0.590 62 EV 113 323.40 591.39 15.427 1.248 3.527 0.918 63 EV 380 925.06 595.27 14.190 0.667 2.290 0.337 64 - 870.31 595.94 16.721 1.634 4.821 1.304 65 - 855.11 602.99 15.481 1.335 3.581 1.005 66 T 28 1468.18 605.70 12.532 0.163 0.632 -0.167 67 - 923.89 611.24 15.374 1.115 3.474 0.785 68 - 233.11 621.07 15.116 0.982 3.216 0.652 69 EV 114 492.68 621.79 15.942 1.034 4.042 0.704 70 EV 110 1366.40 637.78 16.758 1.186 4.858 0.856 71 - 908.28 646.88 15.373 1.348 3.473 1.018 72 - 45.21 656.10 16.907 1.204 5.007 0.874 73 - 1686.12 662.89 15.174 0.926 3.274 0.596 74 EV 112 1051.58 670.23 17.131 1.262 5.231 0.932 75 EV 115 595.97 710.18 16.084 1.091 4.184 0.761 76 - 1595.67 714.97 14.665 0.891 2.765 0.561 77 T 44 234.60 736.71 13.560 0.706 1.660 0.376 78 T 43 412.39 762.81 13.103 0.445 1.203 0.115 79 EV 158 1603.79 765.28 13.797 0.691 1.897 0.361 80 - 1903.06 788.90 16.290 1.571 4.390 1.241 81 - 755.16 792.04 16.050 1.335 4.150 1.005 82 T 50 162.81 806.29 13.527 0.943 1.627 0.613 83 - 1380.35 830.01 15.077 1.358 3.177 1.028 84 - 1246.26 841.33 15.982 1.315 4.082 0.985 85 - 1549.76 852.24 16.491 1.283 4.591 0.953 86 T 17 1389.39 853.14 12.649 0.659 0.749 0.329 87 - 383.82 854.74 16.256 1.213 4.356 0.883 88 - 511.36 860.75 15.543 1.114 3.643 0.784 90 F 21 1003.22 867.06 12.000 0.773 0.100 0.443 91 F 10 1125.23 881.18 15.312 0.952 3.412 0.622 92 F 2 1277.07 885.23 10.403 -0.017 -1.497 -0.347 93 F 20 1173.62 888.08 11.473 0.094 -0.427 -0.236 94 - 1325.99 890.34 15.870 1.013 3.970 0.683 95 - 983.26 892.09 16.770 1.742 4.870 1.412 96 - 348.81 893.05 16.332 1.133 4.432 0.803 97 - 996.66 894.20 15.576 0.955 3.676 0.625 98 F 11 1051.19 896.15 15.155 1.143 3.255 0.813 99 - 462.23 898.94 16.814 1.409 4.914 1.079 100 - 756.70 899.89 15.735 1.348 3.835 1.018 101 - 891.73 902.12 17.578 1.650 5.678 1.320 102 T 7 1695.73 904.24 12.752 0.339 0.852 0.009 103 T 42 673.15 910.60 13.660 0.798 1.760 0.468 104 - 1826.27 911.37 16.469 1.250 4.569 0.920 105 - 707.38 911.91 14.043 1.142 2.143 0.812 106 F 6 1144.36 914.89 13.833 0.598 1.933 0.268 107 - 752.96 920.26 14.324 0.852 2.424 0.522 108 - 1247.24 926.33 15.608 1.452 3.708 1.122 109 F 7 1122.63 931.87 12.662 0.255 0.762 -0.075 110 - 970.63 933.44 16.568 1.441 4.668 1.111 111 F 8 1130.81 944.62 12.900 0.333 1.000 0.003 112 - 1462.80 963.98 15.573 1.100 3.673 0.770 113 - 482.24 964.66 16.406 1.044 4.506 0.714 114 EV 132 1920.00 964.68 16.575 2.313 4.675 1.983 115 - 594.66 967.04 14.272 0.987 2.372 0.657 116 - 1055.88 969.96 15.128 1.306 3.228 0.976 cross references according to: T … Thé (1965), EV … Evans (1978), F … Fitzgerald et al. (1978)
Photometric data no ref X Y V # [px] [px] [mag] [mag] [mag] [mag] 117 - 559.77 970.03 14.200 0.848 2.300 0.518 118 F 9 1112.65 971.08 10.885 0.051 -1.015 -0.279 119 F 23 867.23 971.34 13.824 1.039 1.924 0.709 120 - 295.87 977.09 17.157 1.659 5.257 1.329 121 - 427.70 980.10 16.458 1.318 4.558 0.988 122 - 1054.97 984.20 16.442 1.416 4.542 1.086 123 - 313.07 984.63 14.516 1.048 2.616 0.718 124 EV 101 629.94 985.65 14.616 0.993 2.716 0.663 125 - 947.79 986.76 15.805 1.239 3.905 0.909 126 - 1110.64 994.16 15.072 1.298 3.172 0.968 127 - 938.11 1000.83 16.425 1.493 4.525 1.163 128 F 5 1313.96 1007.28 12.915 0.474 1.015 0.144 129 - 49.92 1013.16 14.420 1.379 2.520 1.049 130 - 1170.83 1015.02 17.255 1.962 5.355 1.632 131 - 1377.98 1018.00 17.168 1.582 5.268 1.252 132 - 347.13 1028.38 16.958 1.574 5.058 1.244 133 EV 118 798.36 1041.11 15.004 0.921 3.104 0.591 134 - 1777.01 1046.14 16.344 1.157 4.444 0.827 136 T 52 168.39 1057.81 12.333 0.719 0.433 0.389 137 - 764.65 1060.37 15.063 1.368 3.163 1.038 138 T 53 373.26 1062.19 12.364 0.845 0.464 0.515 139 F 14 1163.20 1064.25 9.908 0.011 -1.992 -0.319 140 EV 117 600.77 1068.02 16.079 3.436 4.179 3.106 141 EV 341 292.97 1072.18 14.870 0.673 2.970 0.343 142 - 755.79 1072.22 16.298 1.206 4.398 0.876 143 - 1142.33 1085.32 16.181 1.561 4.281 1.231 144 F 25 957.10 1104.88 12.546 0.193 0.646 -0.137 145 - 755.94 1107.58 14.528 0.920 2.628 0.590 146 - 768.08 1109.97 14.881 1.161 2.981 0.831 147 F 24 867.63 1117.11 11.401 0.099 -0.499 -0.231 148 - 214.36 1119.42 15.477 1.107 3.577 0.777 149 F 22 822.58 1123.93 12.344 0.586 0.444 0.256 150 - 1137.82 1125.75 15.797 1.118 3.897 0.788 151 F 18 1210.31 1127.16 13.414 0.895 1.514 0.565 152 T 54 642.20 1143.42 12.343 0.574 0.443 0.244 153 153 813.09 1160.87 15.900 1.043 4.000 0.713 154 EV 131 460.58 1172.03 17.089 1.410 5.189 1.080 155 - 1894.82 1181.04 15.942 1.326 4.042 0.996 156 - 1723.72 1191.24 16.841 1.260 4.941 0.930 157 - 1829.80 1196.28 16.631 1.169 4.731 0.839 158 T 84 1921.94 1202.35 12.173 0.177 0.273 -0.153 159 - 897.28 1208.26 16.722 1.459 4.822 1.129 160 - 1733.69 1211.13 15.075 1.104 3.175 0.774 161 - 1671.01 1211.58 14.758 0.802 2.858 0.472 162 - 972.84 1214.98 17.186 1.603 5.286 1.273 163 - 1067.84 1218.17 17.137 1.521 5.237 1.191 164 T 5 499.27 1228.13 11.307 0.011 -0.593 -0.319 165 - 766.29 1231.46 17.090 1.361 5.190 1.031 166 EV 105 1428.35 1232.13 15.391 1.282 3.491 0.952 167 F 3 1300.22 1238.68 10.329 0.281 -1.571 -0.049 168 EV 119 746.33 1248.59 14.920 0.952 3.020 0.622 169 - 454.11 1262.42 17.140 2.916 5.240 2.586 170 F 4 1185.09 1262.77 12.900 0.702 1.000 0.372 171 - 811.75 1266.25 17.083 1.403 5.183 1.073 172 - 387.18 1267.98 16.583 1.102 4.683 0.772 173 EV 120 650.21 1270.25 15.923 1.085 4.023 0.755 174 - 354.41 1271.08 14.232 1.321 2.332 0.991 175 EV 106 1578.70 1285.38 15.113 0.979 3.213 0.649 cross references according to: T … Thé (1965), EV … Evans (1978), F … Fitzgerald et al. (1978)
Photometric data no ref X Y V # [px] [px] [mag] [mag] [mag] [mag] 176 T 58 312.02 1289.90 12.425 0.339 0.525 0.009 177 EV 121 578.36 1291.90 15.956 1.126 4.056 0.796 178 - 213.07 1291.97 16.642 1.322 4.742 0.992 179 T 83 1845.63 1296.59 9.581 0.020 -2.319 -0.310 180 - 418.82 1306.86 16.830 1.286 4.930 0.956 181 - 316.03 1310.79 17.028 1.935 5.128 1.605 182 EV 104 1303.33 1319.82 15.217 1.000 3.317 0.670 183 - 414.92 1321.43 14.659 0.837 2.759 0.507 184 - 153.17 1340.29 15.929 1.199 4.029 0.869 185 - 1935.35 1355.92 15.803 1.011 3.903 0.681 186 - 1868.70 1357.27 15.862 1.005 3.962 0.675 187 - 992.20 1359.94 16.896 1.131 4.996 0.801 188 - 182.27 1360.00 16.524 1.882 4.624 1.552 189 - 136.86 1361.14 14.973 0.814 3.073 0.484 190 EV 103 1308.64 1367.22 16.275 1.087 4.375 0.757 191 - 1678.35 1369.76 15.107 0.876 3.207 0.546 192 - 986.65 1388.20 15.407 1.158 3.507 0.828 193 - 1634.02 1391.19 15.577 0.950 3.677 0.620 194 T 4 2011.94 1391.19 13.425 1.053 1.525 0.723 195 T 82 1707.91 1404.01 13.222 0.963 1.322 0.633 196 EV 102 1360.30 1409.28 14.729 0.802 2.829 0.472 197 EV 514 1548.60 1412.10 14.088 0.633 2.188 0.303 198 T 55 849.95 1418.74 12.827 0.627 0.927 0.297 199 - 1237.07 1419.28 16.019 1.093 4.119 0.763 200 - 1797.97 1435.41 15.211 0.929 3.311 0.599 201 T 56 863.37 1439.33 13.828 0.893 1.928 0.563 202 - 492.36 1443.38 16.411 1.590 4.511 1.260 203 T 57 418.35 1454.55 10.690 0.190 -1.210 -0.140 204 EV 127 904.69 1458.22 14.628 0.915 2.728 0.585 205 - 42.27 1462.05 14.396 2.072 2.496 1.742 206 - 663.53 1463.84 15.912 0.966 4.012 0.636 207 - 1765.15 1465.00 16.533 1.117 4.633 0.787 208 - 84.05 1474.30 16.125 1.286 4.225 0.956 209 - 223.36 1476.16 16.487 1.421 4.587 1.091 210 - 1455.78 1489.89 16.119 1.355 4.219 1.025 211 EV 126 794.32 1490.92 15.320 0.881 3.420 0.551 212 T 81 1630.73 1491.70 12.691 1.900 0.791 1.570 213 EV 128 1552.35 1516.75 15.825 1.331 3.925 1.001 214 - 1679.66 1526.65 15.995 0.996 4.095 0.666 215 - 906.80 1527.87 16.612 1.157 4.712 0.827 216 - 1479.14 1528.07 16.472 1.038 4.572 0.708 217 - 374.19 1529.61 16.395 1.522 4.495 1.192 218 - 495.27 1543.18 16.943 1.102 5.043 0.772 219 - 156.18 1550.33 14.952 1.051 3.052 0.721 220 - 1047.89 1558.93 16.671 2.027 4.771 1.697 221 - 154.93 1558.95 16.539 1.190 4.639 0.860 222 - 811.08 1559.72 16.820 1.531 4.920 1.201 223 - 48.92 1570.62 15.104 1.995 3.204 1.665 224 - 1102.75 1582.05 16.358 1.123 4.458 0.793 225 - 1865.21 1586.25 15.578 0.886 3.678 0.556 226 T 80 1494.10 1600.21 13.342 0.780 1.442 0.450 227 - 1853.22 1609.97 16.519 0.584 4.619 0.254 228 - 540.81 1629.21 15.321 0.923 3.421 0.593 229 - 1003.84 1630.04 16.503 1.555 4.603 1.225 230 - 485.73 1643.99 15.383 1.320 3.483 0.990 231 - 1356.33 1681.92 16.414 1.181 4.514 0.851 232 - 1167.04 1682.17 16.032 0.995 4.132 0.665 233 - 1149.45 1684.80 15.258 0.929 3.358 0.599 cross references according to: T … Thé (1965), EV … Evans (1978), F … Fitzgerald et al. (1978)
Photometric data no ref X Y V # [px] [px] [mag] [mag] [mag] [mag] 234 - 1855.72 1696.06 16.588 1.236 4.688 0.906 235 T 79 1558.33 1700.24 13.480 0.783 1.580 0.453 236 - 1437.65 1701.57 14.253 0.779 2.353 0.449 237 - 248.32 1702.52 17.885 1.871 5.985 1.541 238 T 62 82.90 1703.12 12.942 0.828 1.042 0.498 239 T 77 1876.77 1711.86 12.507 0.916 0.607 0.586 240 - 1652.13 1714.77 16.039 1.002 4.139 0.672 241 - 368.10 1720.81 15.411 1.304 3.511 0.974 242 EV 125 787.44 1721.21 15.718 1.054 3.818 0.724 243 EV 140 755.81 1732.73 14.914 1.529 3.014 1.199 244 - 345.34 1734.22 14.181 2.003 2.281 1.673 245 - 365.95 1750.00 15.843 1.045 3.943 0.715 246 - 319.94 1752.38 16.910 2.713 5.010 2.383 247 - 901.91 1752.96 16.854 1.268 4.954 0.938 248 - 1639.58 1772.67 16.486 1.071 4.586 0.741 249 EV 122 558.13 1775.02 14.052 0.754 2.152 0.424 250 - 1255.14 1777.12 15.439 1.443 3.539 1.113 251 - 1080.34 1784.27 15.613 0.895 3.713 0.565 252 EV 123 665.71 1792.36 14.396 1.174 2.496 0.844 253 EV 124 711.27 1793.36 15.343 1.170 3.443 0.840 254 - 72.90 1797.44 15.741 1.221 3.841 0.891 255 - 409.24 1799.02 16.521 1.188 4.621 0.858 256 - 1186.89 1799.37 15.286 0.919 3.386 0.589 257 T 71 1253.82 1808.40 12.794 0.867 0.894 0.537 258 - 2016.97 1814.63 14.563 1.018 2.663 0.688 259 - 125.07 1833.07 16.374 1.533 4.474 1.203 260 - 846.68 1838.83 16.057 1.238 4.157 0.908 261 T 78 1713.86 1844.37 12.375 0.779 0.475 0.449 262 T 63 193.20 1848.21 12.487 0.671 0.587 0.341 263 - 915.88 1852.10 17.024 2.334 5.124 2.004 264 - 106.20 1859.70 15.449 0.997 3.549 0.667 265 - 1820.86 1863.28 15.305 1.167 3.405 0.837 266 T 64 290.91 1864.59 11.234 0.769 -0.666 0.439 267 T 10 574.28 1865.66 10.048 -0.016 -1.852 -0.346 268 - 1769.05 1868.72 15.043 1.169 3.143 0.839 269 - 1606.88 1870.61 16.628 1.209 4.728 0.879 270 EV 133 1302.32 1875.69 16.390 2.501 4.490 2.171 271 - 783.40 1880.84 13.844 1.246 1.944 0.916 272 - 1376.96 1894.95 15.457 2.191 3.557 1.861 273 T 70 985.36 1912.30 13.074 0.502 1.174 0.172 274 - 2016.04 1921.81 14.643 0.912 2.743 0.582 275 T 65 443.72 1927.54 10.629 1.296 -1.271 0.966 276 - 1021.39 1928.14 15.421 0.823 3.521 0.493 277 - 807.00 1932.98 15.108 1.265 3.208 0.935 278 - 995.31 1948.07 16.408 2.347 4.508 2.017 279 - 1194.13 1957.44 15.576 1.264 3.676 0.934 280 - 1201.84 1975.30 14.674 0.858 2.774 0.528 281 T 69 876.93 1980.01 12.777 0.896 0.877 0.566 282 - 1948.21 1983.77 15.008 0.865 3.108 0.535 283 - 176.35 1987.67 15.584 1.110 3.684 0.780 284 - 716.69 1991.23 14.702 2.120 2.802 1.790 285 EV 316 1754.04 1992.89 14.539 0.739 2.639 0.409 286 - 35.14 2016.29 16.176 1.735 4.276 1.405 287 - 1224.00 2018.87 15.302 1.108 3.402 0.778 288 - 1162.16 2022.13 14.807 0.997 2.907 0.667 289 - 424.21 2022.17 16.411 1.878 4.511 1.548 cross references according to: T … Thé (1965), EV … Evans (1978), F … Fitzgerald et al. (1978)