SGARFACE: A Novel Detector For Microsecond Gamma Ray Bursts
Abstract
The Short GAmma Ray Front Air Cherenkov Experiment (SGARFACE) is operated at the Whipple Observatory utilizing the Whipple 10 m -ray telescope. SGARFACE is sensitive to -ray bursts of more than with durations from ns to s and provides a fluence sensitivity as low as 0.8 rays per above MeV (0.05 rays per above 2 GeV) and allows to record the burst time structure.
1 Introduction
The detection of -ray burst phenomena at MeV-GeV energies is generally the domain of satellite-based -ray telescopes with a wide field of view allowing sky surveys and monitors for classical Gamma Ray Bursts. The sensitivity of these telescopes is limited by their collection area (0.1 - 1 for EGRET, GLAST, respectively). EGRET also had a dead-time limiting the burst detection to time scales larger than 200 ms. Bursts of -rays with microsecond duration have been suggested to originate from primordial black holes hawking74 , assuming the final phase of their evaporation occurs rather fast, as suggested by some particle physics scenarios (for review see halzen91 and carr04 ). In this paper we present an exploratory ground-based -ray instrument that has a high fluence sensitivity to microsecond bursts of GeV -rays, the SGARFACE experiment.
Very High Energy (VHE) -ray astronomy has become an established discipline in high energy astrophysics through the detection of more than 10 astrophysical sources at TeV energies including supernova remnants, active galaxies, the Galactic Center and a few unidentified sources (for review see weekes03 , hofmann04 ). This recent development was made possible by the success of the imaging atmospheric Cherenkov technique pioneered by the Whipple collaboration using the Whipple 10 m -ray telescope on Mount Hopkins, in southern Arizona weekes89 . Major next generation telescopes are currently under construction worldwide and will provide an order of magnitude better sensitivity (see e.g., weekes02 , hofmann02 , enomoto02 , lorenz02 ).
The success of the atmospheric imaging technique is based on its inherently large effective collection area (, depending on the -ray primary energy) and the ability to efficiently discriminate -ray showers from the much more numerous cosmic-ray initiated air showers by off-line analysis of Cherenkov light images. A cosmic ray entering the atmosphere initiates a shower of secondary particles - mostly pions and their decay products including an electromagnetic component. The electromagnetic component of the cascade is accompanied by the formation of a Cherenkov light front which, at ground level has a duration of a few nanoseconds and extends over more than in radius for vertical showers. For example, a -ray primary results in a shower yielding a Cherenkov light density of on the ground. When a telescope, equipped with fast photo-detectors and electronics, is located within the light pool it can be used to record the Cherenkov flash, thus providing a large effective collection area. In case of a primary -ray, the image is elongated, pointing back to the direction of origin with a length of and a width of corresponding to the longitudinal and lateral spread of electrons and positrons in the shower. Cherenkov images from cosmic-ray showers are mostly broader, longer and the light distribution in the focal plane is more irregular and patchy than that from -ray induced showers. Some cosmic-ray shower images also show Cherenkov rings and arcs from single muons passing close to the telescope.
The energy threshold of next generation imaging atmospheric Cherenkov telescopes will be lowered to explore the energy regime below 100 GeV. However, for energies much below 100 GeV, the Cherenkov light density becomes small compared to the night-sky background, hence extremely large reflectors are required. It was suggested that telescopes with mirror areas of order 1,000 may be able to reach a 5 GeV trigger thresholds using existing technology aharonian02 if placed at 5 km altitude. However, difficulties related to the shower physics arise from the fact that the Cherenkov light signal from a very low energy shower does carry rather limited information about the physical parameters (arrival direction, primary energy and impact point) characterizing the primary -ray.
Nevertheless, -rays with energies as low as still produce small atmospheric showers with weak Cherenkov light yield. Such low energy atmospheric showers cannot be detected individually through their Cherenkov emission. However, a large number of -rays arriving within a short period of time could produce a detectable glow of Cherenkov light. Ground-based atmospheric Cherenkov telescopes could be highly sensitive to short duration -ray bursts with energies above . This idea was first suggested by Porter and Weekes porter78 . They used a pair of telescopes separated by 400 km, each equipped with a single photo-detector searching for coincident light flashes from microsecond -ray bursts. Recently, Krennrich, LeBohec and Weekes krennrich00 showed that short low energy -ray bursts could also be detected and identified with a single imaging atmospheric Cherenkov telescope using FADCs and modern digital trigger electronics. Such a system can provide unprecedented sensitivity to -ray bursts in the range of time scales from to , a regime still largely unexplored.
This is the conceptual basis for the design of the Short GAmma Ray Front Air Cherenkov Experiment (SGARFACE) which was installed on the Whipple 10 m telescope in Spring of 2003. SGARFACE is the first experimental realization of this idea using a modern Cherenkov telescope. Here, we first review the properties of Cherenkov flashes that should result from a -ray front entering the atmosphere. Then, we describe the design of the SGARFACE experiment and present performance parameters to discuss its sensitivity to microsecond -ray bursts.
2 The Cherenkov Light Glow From Multi--Ray Initiated Showers
Design and performance studies of a new air shower detection technique requires the use of Monte Carlo simulations. For our studies presented in this paper we used an updated version of simulation programs that is based on ISUSIM (see mohanty98 ). After intense scrutiny and comparison between MOCCA and ISUSIM, these programs were both used to derive the Crab Nebula spectrum published by the Whipple collaboration hillas98 . The ISUSIM programs for the shower development and Cherenkov light production have been refined in an updated program, known as GrISU. (http://www.physics.utah.edu/gammaray/GrISU). In GrISU, the timing of the shower development and light propagation has been introduced.
2.1 Cherenkov Light Density From Individual Showers

Figure 1 shows the simulated Cherenkov light density as a function of impact parameter for the Whipple Observatory altitude (2,300 m above sea level) from individual -ray showers at zenith with primary energies ranging from 100 MeV to 100 GeV with the US Standard Atmosphere absorption taken into account. It can be seen from Figure 1 that the radial light distribution exhibits a sharp rim at a distance of m, which is most pronounced for the highest primary energies (1 GeV - 100 GeV). As described in Hillas hillas90 , the increase of the Cherenkov angle, as particles penetrate deeper into the atmosphere, is somewhat compensated for by the decreasing distance between the particle and the ground. This leads to an accumulation of Cherenkov light at shower core distance, originating from a high energy particle component traveling along the shower axis bohec03 .
Cherenkov light falling beyond this characteristic rim originates from particles that have experienced scattering at large angles. Lower energy primary particles produce secondary particles that have a lower energy to start with, and hence the shower development tends to be more strongly affected by scattering. At energies below 1 GeV, this leads to a blur of the rim in the Cherenkov light density causing the lateral distribution to become flat out to distances of several hundreds of meters from the shower core.

Figure 1 also indicates that the Cherenkov light density from showers below 100 GeV does not scale linearly with the primary energy. This non-linearity has two origins. As the primary energy approaches the critical energy in the atmosphere, ionization losses become relatively more important and ultimately, -ray primaries of less than MeV do not develop an air shower and Cherenkov light emission ceases. Secondly, as the multiple scattering angle increases for lower energy secondary particles, the Cherenkov light is spread out over a larger area on the ground, reducing the Cherenkov light density.
The non-linearity of the Cherenkov light yield as a function of energy can be better seen in the top panel of Figure 2, showing the average density of Cherenkov light on the ground within the arbitrary radius of . Figure 1 shows that the contribution to the burst image from showers falling beyond 1000 m will be very small. The linear relationship seen above 100 GeV is lost for lower energies and a cutoff occurs around 100 MeV.
The lower panel of Figure 2 shows the Cherenkov light density per bin of energy produced by a -ray burst assuming various differential power law energy spectra () of index 1.0, 1.5, 2.0, 2.5 and 3.0, all with a fluence of 1 ray per above 100 MeV. The effect of the cutoff can be seen below 100 MeV. At energies higher than 10 GeV, approaching the regime where the Cherenkov yield scales linear with the primary energy, the response curve follows a power law resulting from the chosen energy spectrum. The peak response ranges from for the spectrum to arbitrarily higher energies for harder energy spectra. Astrophysical searches for which the SGARFACE experiment can be used have a wide range of possible energy spectra, from primordial black holes with thermal spectra at a few 100 MeV to pulsed emission from -ray pulsars showing hard spectra ( see nolan96 ).
2.2 The Cherenkov Light Image And Time Structure
Off-line analysis of Cherenkov light images has been very successful in discriminating between -rays from discrete sources and cosmic-ray induced air showers. Both types of events potentially constitute a background to a search for short -ray bursts; however, the latter exhibit image and time properties which, when combined, render burst images unique.
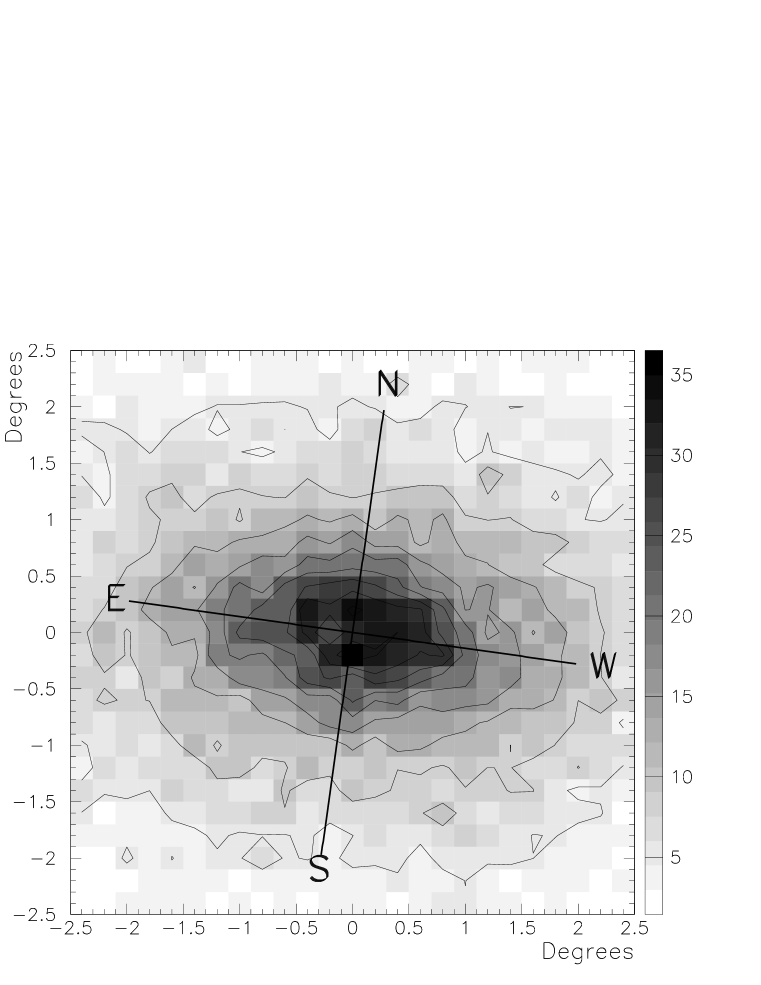
Figure 3 shows the Cherenkov light image produced by a simulated -ray burst at zenith with above 200 MeV. The differential energy spectrum taken is a power law of index 2.5 above 50 MeV. The cross indicates the direction of the burst and the orientation of the cross indicates the direction of the Earth’s magnetic field. The image is elongated in the direction perpendicular to the magnetic field. This effect results from the bent tracks of low energy electrons and positrons which allow showers with larger impact parameter in the east and west directions to contribute Cherenkov light to the image. The magnitude of this effect depends on the angle between the magnetic field and the shower axis. It will be maximal in directions perpendicular to the magnetic field.
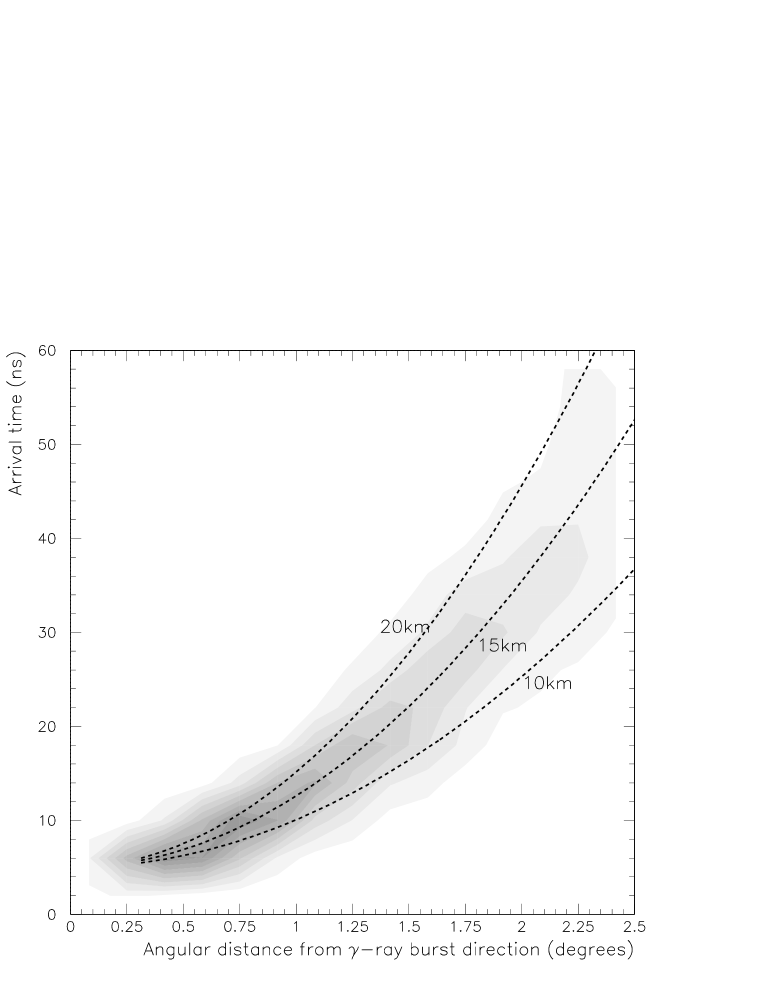
The image time structure also contains potentially useful information about the nature of the Cherenkov light image. The angular distance of a Cherenkov photon from the burst direction is strongly correlated with the impact parameter of the contributing low energy shower. This is reflected in the time structure of the Cherenkov glow produced by a simulated -ray burst with no intrinsic time dispersion. The arrival time of the Cherenkov photons are shown in Figure 4 as a function of the angular distance from the burst direction. The relationship is well reproduced by the dotted lines which show the expected arrival time of the Cherenkov light emitted from fixed altitudes in a standard isothermal atmosphere. The Cherenkov light in the outer part of the glow is coming from showers that are further away and have arrived later. The time dispersion ranges from ns at the center of the image to ns for away from the center. The time lag between those points in the image is ns. As a consequence the time structure of the Cherenkov glow from a burst should be center symmetric and the signal in each point of the image should reproduce the burst time profile with a dispersion of less than 10 ns.
2.3 Zenith Angle Dependence

It is interesting to note that the burst detection technique is less dependent on zenith angle than the standard atmospheric Cherenkov technique detecting individual air showers; in the latter the energy threshold changes substantially with zenith angle. In the -ray burst detection, the energy threshold is fixed by the critical energy (typically 80 MeV) and does not depend on the zenith angle. Furthermore the different geometric effects compensate each other. As we go to larger zenith angles, electromagnetic showers develop further away from the telescope, the Cherenkov light is spread over a larger area and the fraction collected by the telescope decreases. This tendency is compensated by the fact that, for increasing zenith angle, each pixel collects the light from an increasing number of showers since showers develop at a larger distance. The sensitivity to -ray bursts still somewhat decreases at lower elevation because of atmospheric absorption.
A larger factor impacting the sensitivity of the burst technique is given by the geomagnetic field. When the angle between the line of sight and the Earth’s magnetic field is maximal, the east-west extension of a burst image is increased while the Cherenkov light density of the image is reduced, thus reducing the sensitivity. When observations are made in the direction of the magnetic field the compactness of the image is at its maximum and the sensitivity is not affected. This is illustrated in Figure 5 which shows the relative sensitivity along the local meridian. The lobe is skewed toward the celestial magnetic north pole; at elevation, the sensitivity is close to three times higher compared to the south at the same elevation.
3 The Short GAmma Ray Front Air Cherenkov Experiment
The properties of the Cherenkov light images produced by a -ray burst are quite unique and we expect the possible detection of ultra-short -ray bursts to be essentially free of background events. In order to search for ultra-short -ray bursts, we have designed and constructed an experiment to record Cherenkov light images and time profiles providing substantial sensitivity to microsecond scale -ray bursts. The Short GAmma Ray Front Air Cherenkov Experiment (SGARFACE) is designed to detect the glow of Cherenkov light collectively produced by atmospheric showers.
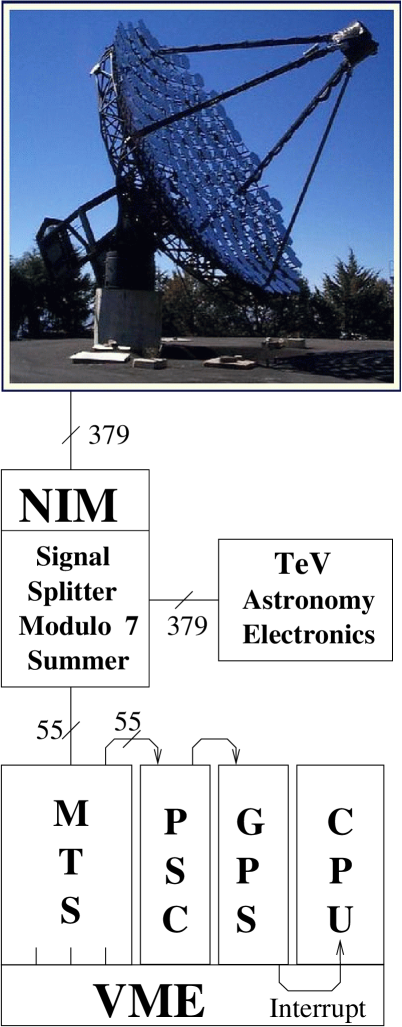
SGARFACE was integrated in the Whipple 10 m telescope in Spring of 2003 and it is operated in parallel to the standard TeV -ray observations (see Figure 6). The Whipple 10 m reflector has a mirror area of . The focal plane instrument covers a field of view of with 379 photo-multipliers in a close packed hexagonal array with a center-to-center spacing finley01 . The photo-multipliers are operated at an average gain of krennrich01 . The photomultiplier signals are sent via RG-58 cables (170 ft) to the nearby counting house where the electronics for VHE--ray astronomy and SGARFACE is located. For further details on the Whipple 10 m telescope see finley01 .
In order to provide the photomultiplier signals to both the SGARFACE and Whipple 10 m VHE experiments simultaneously, they are duplicated using a passive signal splitter (Figure 6). At this level, the signals of 7 neighboring camera pixels are combined in an analog sum for further processing by the SGARFACE electronics.
The 55 remaining analog signals are then digitized by 50 MHz flash ADCs and buffered in the multi-time scale (MTS) discrimination modules that constitute trigger level-1. The discriminator outputs are then used in the trigger level-2, a pattern sensitive coincidence unit (PSC) to reduce accidental rates from the night sky. When a level-2 trigger occurs, the computer is prompted via hardware interrupt to read out the digitized pulse information buffered in the MTS. In this section, we describe the elements of the SGARFACE electronics system that were designed and constructed at the Electronics Design Center of the Physics Department at Iowa State University.
3.1 Splitter-Summer Modules
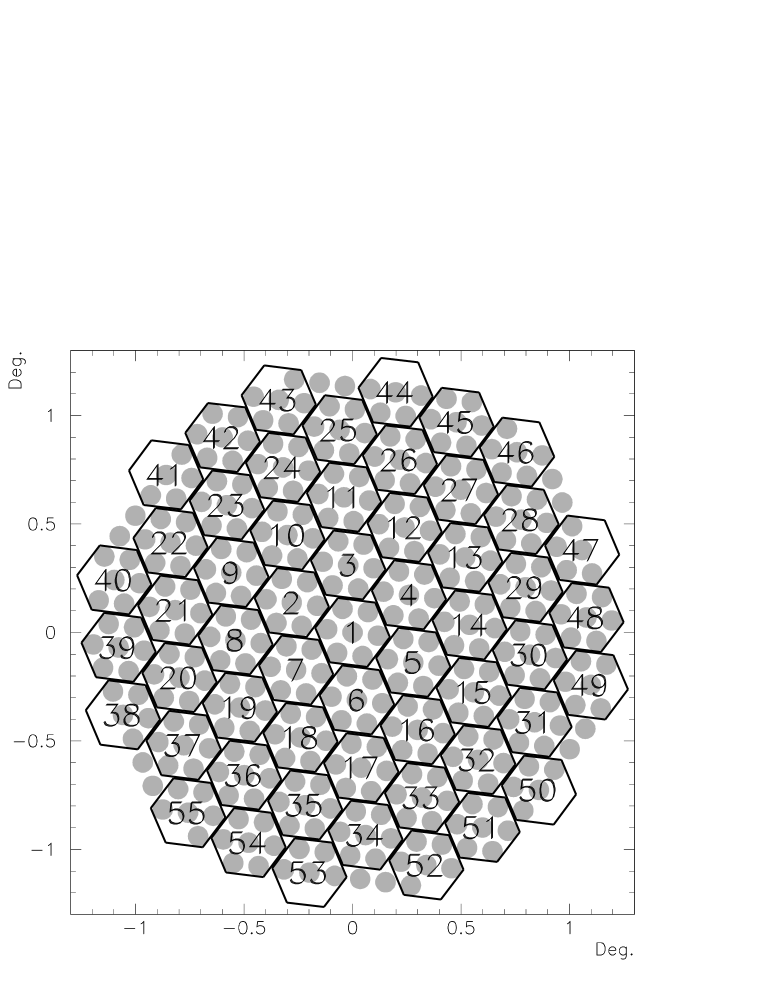
The Cherenkov light image of a -ray burst is quite extended () compared to the pixelation of the Whipple 10 m telescope camera (). This allows us to reduce the inherently high angular resolution of the Whipple camera for the integration of SGARFACE by combining the signals of 7 neighboring photo-multipliers (Figure 7). The resulting pixelation of is adequate for triggering on -ray burst images.
A passive splitter preserves the signal bandwidth for the standard Whipple 10 m VHE electronics introducing a attenuation. A capacitive coupling before the summing junction ensures that the photomultiplier anode current component remains unaffected by the SGARFACE electronics. It is used by the standard VHE system to monitor the night-sky luminosity. The rise time of photomultiplier signals can be as short as a few nanoseconds while the SGARFACE electronics digitizes the incoming signals in 20 ns slices. A bandwidth limitation is applied to the SGARFACE signals by shaping them to a typical width of more than 20 ns in order to minimize the information loss during the digitization. A voltage gain of 3 is applied to the signals going to the SGARFACE digital trigger modules.
The splitter and adder circuit boards are integrated in triple-width NIM modules, with five boards per module. Each board provides inputs for seven photomultiplier signals entering through the back panel, and exiting through the front. The front panel also provides one dual output with the analog sum of 7 neighboring pixels. A total of 55 splitter-adder boards are used for the operation of SGARFACE.
3.2 The Multi-Time-Scale (MTS) Discriminators
Since SGARFACE is designed for use in a survey for -ray burst phenomena, the duration of a putative burst is not known a-priori. Therefore, the trigger has been designed to cover the time scales for which this technique is most sensitive, a region largely unexplored by other instruments. The MTS discriminators, the level-1 trigger was designed to maximize sensitivity to pulses with durations from 100 ns to 35 s. The incoming signals are amplified by an additional gain of 3 in the MTS discriminator module and then digitized by 50 MHz 8-bit FADCs covering a dynamic range of 1 V. Taking into account the photomultiplier gain, the attenuation in the cables and the various gains in the electronics, we find that 1 digital count corresponds to 1.8 photoelectrons per 20 ns sample.
The digitized signals are then used to form an integral over various fixed time intervals. This is achieved by summing the difference between the input and the output of a first-in-first-out (FIFO) register stack through which the digitized signals are sent from the FADC. The number of registers in the stack defines the time interval over which the integral is calculated.
In fact, the signal is integrated over 3 consecutive time windows. A trigger signal is produced only when the three integral values exceed a predefined threshold at the same time (see Figure 8). This feature reduces the trigger sensitivity to signals that are shorter than the time scale for which the trigger is designed. This is most relevant for triggering on the shortest burst time scales of 60 ns. The 60 ns time scale trigger could still be sensitive to Cherenkov light pulses from cosmic-ray induced showers that are typically shorter than 40 ns krennrich00 . The requirement that at least 3 consecutive time slices of 20 ns show a signal, reduces the number of cosmic-ray triggers.
In order to provide sensitivity over a broad range of time scales, the logic using FIFOs is replicated in cascade. The first of the three time windows of each time scale is subdivided into three and used in the discrimination logic of the shorter time scale. This provides optimal sensitivity over time windows of 60 ns, 180 ns, 540 ns, 1620 ns, 4860 ns and 14580 ns. The entire trigger logic is implemented in a register FIFO stack. In addition, the FIFO stack is followed by an extra 1024 register stack allowing us to record signal lengths up to .
Moreover, each discriminator signal is shaped to have a duration corresponding to its time scale. For each channel, the six time scale discriminator signals are combined in an “OR” gate. The output of the “OR” gate is sent to the coincidence unit which can issue a global trigger signal (level-2) which is fed back into the MTS to freeze the register stacks. After a trigger occurred the local computer can read out the stream of data present in the MTS register stack. The SGARFACE trigger system can then be reactivated. The local computer can also write a diagnostic stream of data to any Xilinx FPGA to test for discriminator threshold and timing operations.

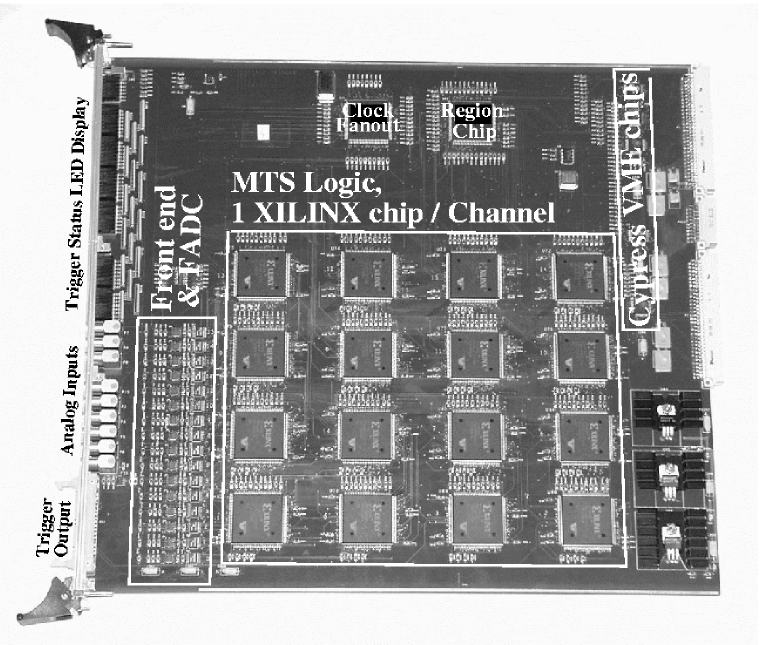
The MTS discriminators are arranged in 16-channel 9U VME-based modules (See Figure 9). Hence, four MTS discriminator modules are sufficient for the entire SGARFACE experiment. The VME interface is implemented around one Actel FPGA permanently programmed as a region chip. It communicates with the VME back plane through four Cypress VME chips and their controller. This circuit handles commands, VME bus addressing and status reporting. The MTS logic of each channel is implemented individually in a Xilinx XCV400E-PQ240 re-programmable gate array. All 16 Xilinx FPGAs are programmed by a local crate computer through the controlling region chip. Instructions describing the trigger logic consist of a series of bytes written to the Xilinx FPGA consisting of both command and configuration data. After the Xilinx gate arrays have been programmed they can be addressed directly and information can be sent to and received from the local computer through simple “read” and “write” commands. For example, each discriminator threshold value for individual channels and specific time scales is written to the Xilinx chip and can be read back by the local computer for verification. To test the performance of the trigger level-1 it is possible to upload test data into the XILINX gate arrays, allowing a full verifications of the function of the digital trigger logic.
3.3 Pattern Sensitive Coincidence (PSC) Unit
Since the technique we describe here relies on triggering on extended Cherenkov light images it is necessary to use a pattern selecting device that optimizes the trigger efficiency for burst images. This is achieved by the PSC which detects coincidences within subsets of the 55 pixels across the camera. It permits to require a programmable number of neighboring pixels to simultaneously deliver a level-1 trigger.
The PSC unit is designed to take 64 asynchronous inputs. For the SGARFACE experiment a single PSC unit is sufficient for making a level-2 trigger decision based on the 55 inputs coming from the MTS unit. The design of the VME interface in the PSC unit is similar to that of the MTS discriminator. The PSC works as a coincidence unit making a trigger decision based on the topology of the event.
In order to reduce the accidentals rate from night-sky background fluctuations, the PSC can be made sensitive to up to 64 overlapping sectors. For each sector, the number of channels in a high state is calculated and compared to a multiplicity level required to issue a trigger. If any of the 64 sectors reach a trigger decision, a global trigger signal is issued. This signal is used to hold the MTS discriminator modules, latch the GPS clock and generate an interrupt to notify the local computer that new data is available for readout. The logic is implemented in a single Xilinx XCV1000E-PQ240 FPGA chip.
3.4 Software
The VME control is based on a Tundra Universe II driver for Linux. The acquisition software is written in C. It launches an interrupt handler as well as a TCP/IP server.
For each trigger event, the interrupt handler reads the time from the VME based GPS clock, the pulses stored in the MTS discriminator registers stacks and the trigger information from the PSC unit. The interrupt handler also reads the telescope tracking status as well as the photomultiplier high voltage values which are made available through NFS mounting of the disk of one of the computers of the standard Whipple 10 m electronics system. The event information is then written to disk and a log book is updated. The discriminator and the coincidence units which were stopped by the trigger are reactivated and the interrupt is re-enabled for the data acquisition to resume.
The TCP/IP server accepts command strings which are interpreted and can act on the VME based modules by setting the various parameters of the experiment and send back information to the client for hand-shaking and display purposes. The TCP/IP client is a TCL/TK script which provides a graphical user interface for modifying the experiment configuration, start and stop the acquisition while offering a complete display of the status and most recent event.
4 Performance
4.1 Trigger Rates
We explored various trigger conditions with different multiplicities and discriminator thresholds. A suitable setting of the PSC unit is to require a minimum of 7 neighboring pixels exceeding the MTS discriminators. This gives sensitivity to Cherenkov light images that are about across or larger. The large multiplicity is efficient in reducing accidentals and constitutes a good match to the angular extent of potential -ray burst images (3).
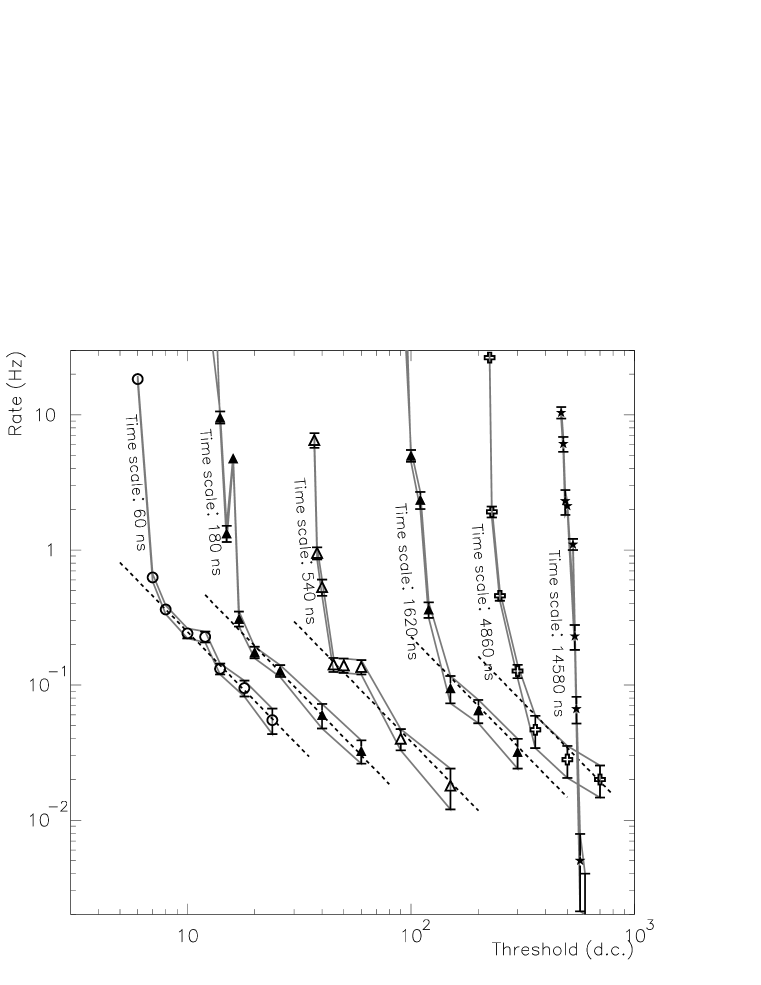
In order to determine the optimal threshold settings of the MTS discriminators for each time scale, we measured the trigger rate as a function of threshold (See Figure 10). For small threshold values, the trigger rate is dominated by night-sky background fluctuations and the rate decreases rapidly with increasing threshold. For larger threshold values, triggers are predominantly due to cosmic-ray showers. In this regime, the rate as a function of the threshold can be described by a power law. At the transition between these two regimes one can see a relatively sharp break in the slope of the trigger rate curve versus threshold (see Figure 10). Generally, atmospheric Cherenkov experiments are operated well above that break point to assure stable operation in the cosmic-ray dominated regime.
All the different time scale triggers, except perhaps the shortest one, should not respond to a short Cherenkov flash from a cosmic-ray shower, which typically lasts less than 40 ns. Nevertheless, all except the longest time scale do still show a power law tail corresponding to cosmic-ray triggers (Figure 10). This results from an electronic artifact associated with the TeV electronics system: this system is not designed to preserve slow pulses, in fact it uses a high pass filter to reject pulses longer than 200 ns. This causes a feedback in the splitter module, introducing a slow capacitive discharge pulse in the SGARFACE electronics. However, these events are easily rejected at the analysis level since they show a short peak followed by a long tail.
After determining the breakpoint for each time scale, the MTS thresholds were set about a factor of two above this transition to avoid instabilities in the trigger rates due to night sky variations. With these stable settings the event rate of SGARFACE is Hz with a typical dead-time of of the observation time. A single night of observations with 8 hours of on-time produces 800 Mb of data. As it turns out, these threshold settings for the different time scales do not scale as expected: from Poisson noise fluctuations of the night sky, one would expect the threshold settings derived using trigger rate curves to increase with the square root of the time scale. However, for the longest time scales the electronics noise dominates over the night sky noise fluctuations. This is mainly due to the fact that in the Whipple camera, the signal cables are only properly terminated for the pulses passing the capacitive coupling. Slower components are just reflected back and forth, affecting mostly the relatively slow pulses relevant for the SGARFACE experiment.
Nevertheless, the sensitivity of SGARFACE is excellent. For the 180 ns time scale, a trigger threshold of 48 d.c. (86 photoelectrons) accumulating over a time scale of 60 ns (one third of 180 ns) corresponds to 16 d.c. (28.8 photoelectrons) per 20 ns sample. For the s time scale, a threshold of 1100 digital counts accumulating over s corresponds to photoelectrons per 20 ns sample. A SGARFACE channel is the analog sum of 7 neighboring photo-multipliers; therefore, for the second shortest and the longest time scales of SGARFACE the threshold corresponds to respectively and photoelectrons per photomultiplier per 20 ns. To put this in perspective, the standard Whipple electronics has a trigger threshold of approximately 10 photoelectrons accumulating over a 20 ns time interval in a single photomultiplier tube. Hence, depending on the time scale, SGARFACE with these conservative threshold settings is a factor of 2.4 (180 ns) to 8.7 (14.58 s) times more sensitive to light densities than the standard TeV system.
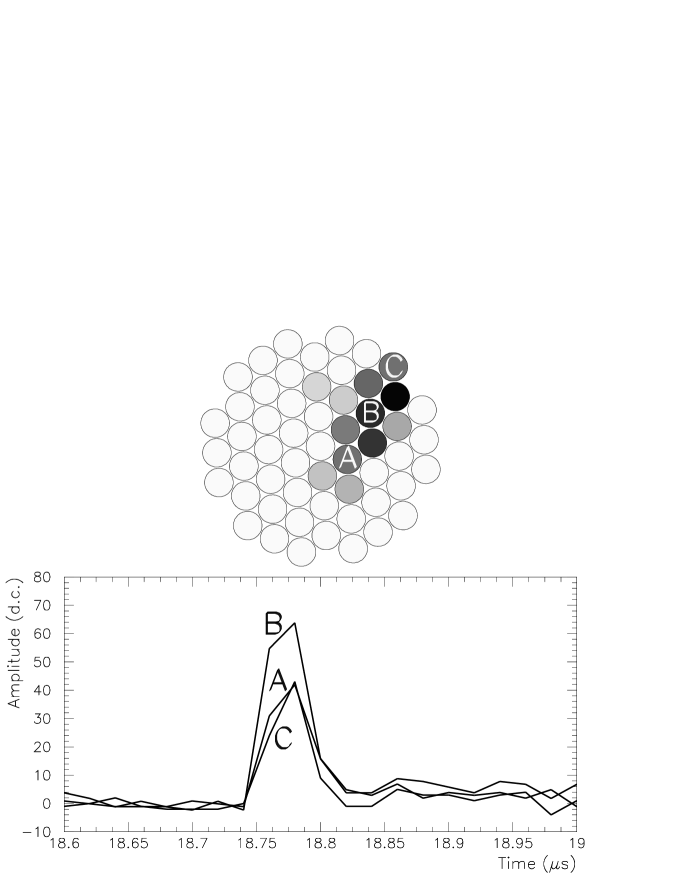
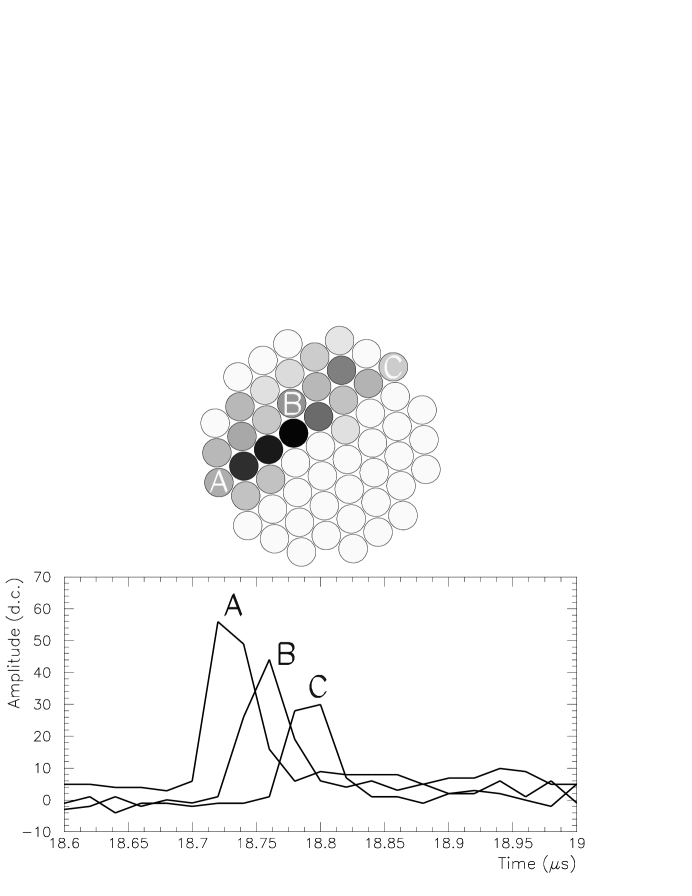
In Figure 11 we show the Cherenkov light image of a typical cosmic-ray event that triggered the SGARFACE electronics. The image has been reconstructed using the flash-ADC information over a 60 ns time window. The flash-ADC traces from three pixels line up within a few nanoseconds. Another event shown in Figure 12 shows a cosmic-ray image that extends all across the camera and the recorded pulses are systematically shifted, indicating a time gradient along the shower image. This indicates the shower axis was seen at an angle of several degrees, much larger than the Cherenkov angle hess99 . This is possible since low energy particles are strongly deflected by multiple scattering resulting in scattering angles of several degrees from the shower axis. This increases the effective aperture of the camera making it possible to view events which are degrees off-axis. Both events in figure 11 and 12 can be easily rejected as not resulting from a -ray burst because of their fast pulse and because of the time gradient along the image.
4.2 Sensitivity
In the previous section we established the hardware trigger threshold and expressed the sensitivity of SGARFACE in terms of photoelectrons per time sample. This information can be used to estimate the sensitivity to -ray bursts using simulations. A model of the SGARFACE electronics has been implemented in the detector simulation code of the GrISU package. The sensitivity of the experiment will depend of the actual burst energy spectrum and time profile. We have simulated -ray bursts with power law differential energy spectra of index 2.5 and a rectangular pulse profile of various widths.
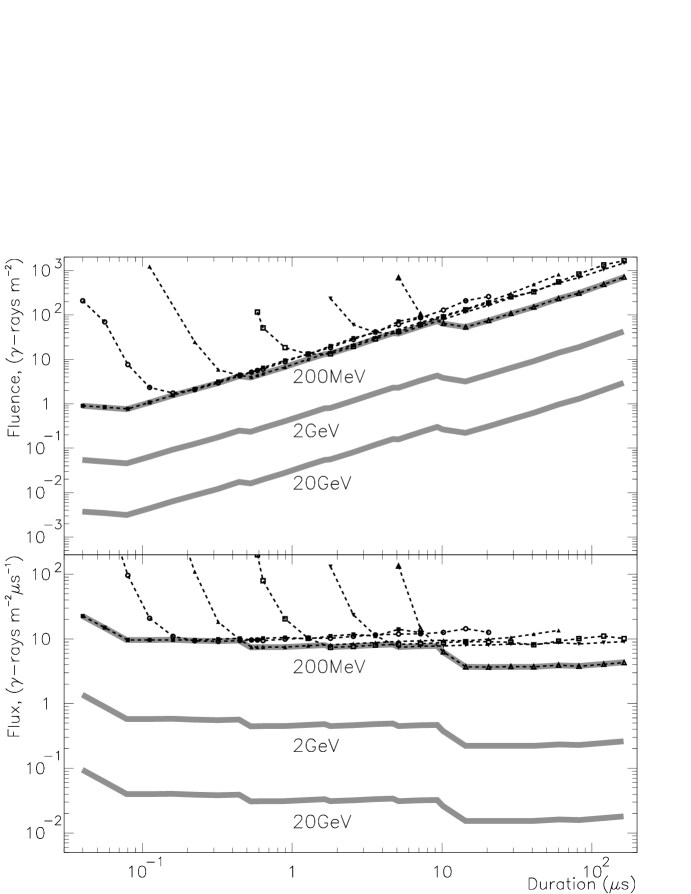
In Figure 13 we show the fluence sensitivity to a -ray burst at zenith occurring on-axis, and therefore centered within the field of view, as a function of burst duration. Each curve corresponds to one of the 6 trigger time scales (, , , , or ) showing the best sensitivity close to its specific integration time. For each time scale, the sensitivity to pulses with shorter durations is reduced as they are less likely to exceed the threshold simultaneously in three consecutive integration time windows. For pulses longer than the trigger time scale, a smaller fraction of the pulse is contained in the MTS discriminator integration window and the sensitivity is therefore also reduced. The sensitivity of SGARFACE corresponds to the envelope of the 6 curves as indicated by the broad grey line. With our current settings the SGARFACE sensitivity to bursts with differential energy spectra of index 2.5, ranges from 0.8 -rays to 50 -ray above 200 MeV for pulse width ranging from to , respectively. However, the sensitivity above 2 GeV ranges from 0.05 -rays to 3 -ray for the same time scales. These are sensitivities at zenith. As shown in section 2.3, the sensitivity at other elevations will be affected mostly by the geomagnetic fields. Along the local meridian, the sensitivity improves at lower elevation to the north while it is rapidly degraded to the south as can be seen on figure 5.
The trigger settings of the MTS units are very conservative with the individual discriminators a factor of two higher than the break point from the trigger rate curves would indicate. With a next generation SGARFACE experiment attached to a state-to-the-art Cherenkov telescope for which the noise would be dominated by the night-sky, the sensitivity could be greatly improved, especially for the longer time scales.
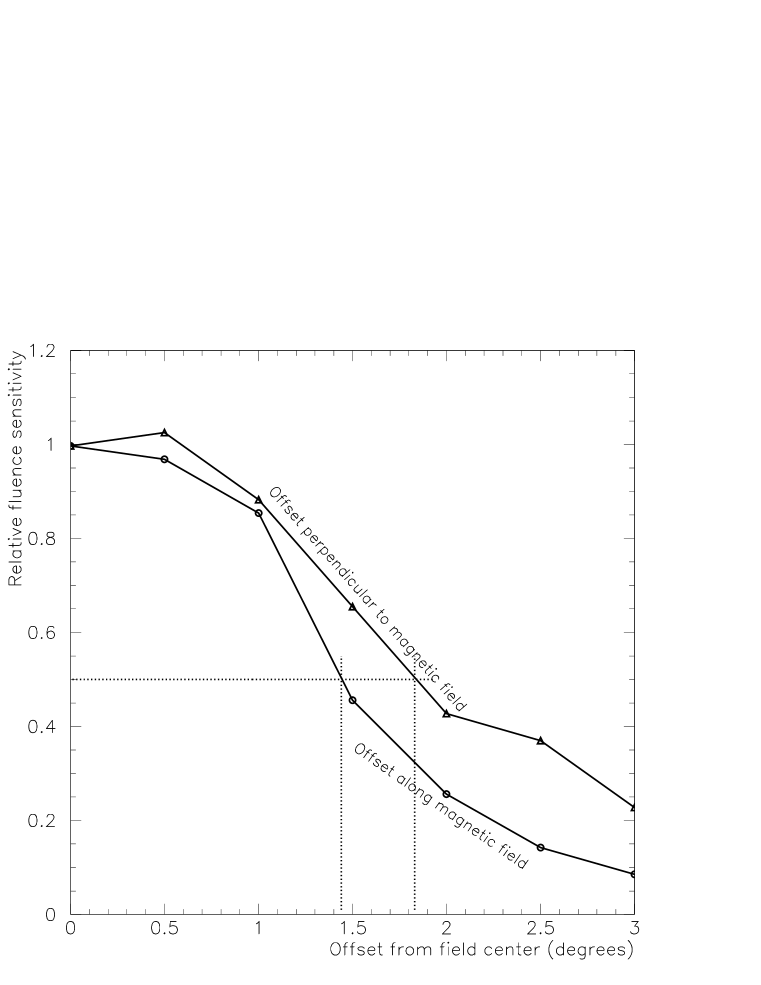
Since the field of view of the Whipple camera is limited, it is important to estimate the sensitivity of bursts that arrive off-axis. When the burst is off-axis, the sensitivity decrease does not depend on the time scale. The relative sensitivity is shown in Figure 14 as a function of the offset angle for observations at zenith. As a result of the elongation of the -ray burst Cherenkov image, the effective field of view also slightly depends on the arrival direction with respect to the magnetic field: it is larger for showers arriving perpendicular to the magnetic field. The fluence sensitivity remains constant within 10% up to off-center and is reduced to 50% at off-center. It should be noted that the instrument has sensitivity up to distances of . However, when the burst image falls mostly outside of the field of view, the event analysis and reconstruction will become less accurate.
5 Conclusions
In this paper we provide a description of a ground-based -ray detector with excellent fluence sensitivity to microsecond -ray bursts at energies of 200 MeV and above. Gamma-Ray Bursts (GRBs) observed with space-based detectors show a wide range of durations - the exploration of the shortest time scales with these detectors is limited due to the detector integration time of typically more than 1 ms. Among the detected GRBs, millisecond and sub-millisecond variability is common walker00 . Because of this limitation of the space-based instruments to shorter time scales and their small effective collection area we have built an experiment that is complementary to space telescopes. We have designed and constructed a ground-based experiment (SAGARFACE) with sensitivity to microsecond bursts of -rays at energies above 200 MeV. The SGARFACE experiment has been operating since March of 2003 and in this paper we have presented the design and technical aspects of the apparatus. The essential part of the instrument is a flash-ADC system that is followed by XILINX re-programmable gate arrays which form the trigger on a wide range of time scales. These electronics have been successfully implemented in the experiment and make the Whipple 10 m telescope sensitive to microsecond bursts of -rays.
SGARFACE has an unprecedented fluence sensitivity of 0.8 -rays for bursts lasting 0.1 s and a fluence sensitivity of 6 -rays for microsecond bursts at energies above 200 MeV. When comparing with EGRET’s fluence sensitivity for short bursts, a regime for which the EGRET instrument would require the detection of multiple photons within a trigger gate of 600 ns, we see that SGARFACE has a factor of 100 (20) better fluence sensitivity at 100 ns (1s). For bursts with spectra peaking at 2 GeV or above, the fluence sensitivity is a factor of 2500 better than EGRET. As bursts are not expected to be more frequent in some directions than others, SGARFACE data are taken toward whichever target the Whipple 10m telescope is tracking and data is taken in the galactic plane as much as away from the galactic plane. Data taken in the direction of the Crab Nebula will be used in a dedicated analysis to search for counterparts to pulsar giant radio pulses shearer .
A limitation of the SGARFACE experiment is its small field of view (3 degrees across). Nevertheless, a survey using approximately 1000 hours of observations is expected to have a sensitivity that is substantially better than previous experiments for detecting primordial black holes in the microsecond time scale regime. If SGARFACE were extended to an array of telescopes it would truly become a background-less experiment as for a -ray burst event, no parallactic displacement of the image is expected from telescope to telescope. This peculiar property would make it virtually impossible to misclassify an event as a -ray burst. The detection of a few interesting events with the current SGARFACE would make a strong case for an extension to VERITAS. With next generation wide field of view atmospheric Cherenkov detectors a SGARFACE trigger could be used as a very effective survey for ultrashort GRBs.
6 Acknowledgment
We thank Harold Skank for help in the electronics design during the early development stage of the project. We also thank Roy McKay for invaluable technical assistance in the assembly and test of the prototype trigger boards. We acknowledge Oscar Valfredini and Louis Le Bohec for their help in the cabling of the experiment. FK acknowledges the support for the SGARFACE project by the Department of Energy High Energy Physics Division through the Outstanding Junior Investigator program and generous financial support by Iowa State University. Also we would like to express many thanks to Trevor Weekes for reading the manuscript. We thank the VERITAS collaboration for the usage of the Whipple 10 m telescope.
References
- (1) Aharonian F., Konopelko, A.K., Voelk, H.J. & Quintana, H. 2001, Astropart.Phys., 15, 335, 19
- (2) Carr, B. 2003, in ”Quantum Gravity: From Theory to Experimental Search”, eds. D. Giulini, C. Kiefer, C. Lammerzahl (Kluwer), Lect.Notes Phys. 631, 301
- (3) Enomoto, R. et al., 2002, Astropart.Phys., 16, 3, 235
- (4) Finley, J.P., et al. 2001, in Proc. ICRC, OG 2.05, 230
- (5) Halzen, F., Zas, E., MacGibbon, J.H. & Weekes, T.C. 1991, Nature, 353, 807
- (6) Hawking, S.W. 1974, Nature, 248, 31
- (7) Heß, M. et al., 1999, A&A 349, 11
- (8) Hillas, A.M. & Patterson J.R. 1990, J. Phys. G:Nucl. Part. Phys., 16, 1271
- (9) Hillas, A.M. et al. 1998, ApJ, 506, 744
- (10) Hofmann, W. et al. 2002, Proc. of “The Universe Viewed in Gamma Rays”, University of Tokyo Symposium, eds. R. Enomoto, M. Mori, S. Yanagia (Universal Academy Press, Inc.: Tokyo), p. 357
- (11) Hofmann, W. et al. 2004, Proc. of “Gamma Ray Symposium 2004”, Heidelberg, to be published
- (12) Krennrich, F., LeBohec, S. and Weekes, T.C. 2000 ApJ, 529, 506
- (13) Krennrich, F. et al. 2001, ApJ, 560, L45
- (14) Le Bohec, S. and Holder, J. 2003, Astropart.Phys., 19, 221
- (15) Lorenz, E., et al. 2002, Proc. of “The Universe Viewed in Gamma Rays”, University of Tokyo Symposium, eds. R. Enomoto, M. Mori, S. Yanagia (Universal Academy Press, Inc.: Tokyo), p. 351
- (16) Mohanty, G. et al. 1998, Astropart.Phys., 9, 1, 15
- (17) Nolan, P.L. et al., 1996, A&AS 120, 61
- (18) Porter, N.A. and Weekes, T.C. 1978 Mon. Not. R. Astr. Soc. 183, 205
- (19) Shearer, A. et al., 2003, Science, Vol. 301, Issue 5632, pp. 493-495.
- (20) Walker, K.C. et al. 2000, ApJ, 537, 264
- (21) Weekes, T.C. et al. 1989, ApJ, 342, 379
- (22) Weekes, T.C. 2003, Very High Energy Gamma Ray Astronomy, Series in Astronomy and Astrophysics, Ed. Institute of Physics Publishing
- (23) Weekes, T.C. et al. 2002, Astropart.Phys., 17, 221