The Effects of Photon Bubble Instability in Radiation-Dominated Accretion Disks
Abstract
We examine the effects of photon bubble instability in radiation-dominated accretion disks such as those found around black holes in active galactic nuclei and X-ray binary star systems. Two- and three-dimensional numerical radiation MHD calculations of small patches of disk are used. Modes with wavelengths shorter than the gas pressure scale height grow faster than the orbital frequency in the disk surface layers. The fastest growth rate observed is five times the orbital frequency and occurs on nearly-vertical magnetic fields. The spectrum of linear modes is in good agreement with a WKB analysis that indicates still faster growth at unresolved scales, with a maximum growth rate proportional to the gravitational acceleration and inversely proportional to the gas sound speed. Disturbances reaching non-linear amplitudes steepen into trains of shocks similar to a 1-D periodic non-linear analytic solution. Variations in propagation speed result in merging of adjacent fronts, and over time the shock spacing and amplitude increase. Growth is limited by the strength of the magnetic field. The shock train structure is disrupted when the ram pressure of the disturbances exceeds the magnetic pressure. The maximum horizontal density variations are comparable to the ratio of magnetic to gas pressure, and in our calculations exceed one hundred. Under the conditions considered, radiation diffuses through the inhomogeneneous flow five times faster than through the initial hydrostatic equilibrium, and the net cooling rate is several times greater than in a similar calculation without magnetic fields that shows the effects of convection. These results indicate that photon bubbles may be important in cooling radiation-dominated accretion disks. The Shaviv type I global instability grows faster than the orbital frequency in calculations of the disk surface layers with lower boundaries of fixed temperature, but is weak or absent in calculations spanning the disk thickness.
1 INTRODUCTION
Black hole systems with luminosities between about 1% and 100% of the Eddington limit are thought to be powered by accretion through a geometrically thin disk supported by rotation. Near the hole, the internal radiation pressure greatly exceeds the gas pressure and determines the thickness of the disk. In the standard picture, angular momentum is transferred outward within the disk by a torque of unspecified origin, proportional to the vertically-averaged gas plus radiation pressure. The released gravitational energy escapes by diffusion of photons to the disk faces (Shakura & Sunyaev, 1973). The model is unstable to perturbations in the mass flow (Lightman & Eardley, 1974) and heating rates (Shakura & Sunyaev, 1976), and no steady accretion is possible in radiation-pressure dominated regions in the standard picture. However, the thermal instability is absent if additional cooling processes operate and the cooling rate increases with disk thickness faster than the heating rate (Piran, 1978).
The evolution of disks is governed by torques together with heating and cooling processes. In the inner parts of black hole disks, the accretion stresses are due to magnetic forces. Magneto-rotational instability (MRI) leads to turbulence in which magnetic fields linking material at different distances from the hole transfer angular momentum outward (Balbus & Hawley, 1991, 1998). The gas is heated by the dissipation of the magnetic fields and the turbulence through microscopic resistivity and viscosity. In radiation-dominated disks, kinetic energy is also converted directly to photon energy by radiative diffusion damping of compressive motions (Agol & Krolik, 1998). The strength of the magnetic fields is regulated by generation through MRI and losses through buoyancy (Stella & Rosner, 1984; Sakimoto & Coroniti, 1989) and dissipation. In a vertically-stratified 3-D local shearing-box radiation-MHD calculation, the magnetic pressure is less than the gas pressure near the midplane, and greater than the gas but less than the radiation pressure in surface layers (Turner, 2004). Field lines close to the midplane are tangled while those near the disk surface lie mostly along the direction of orbital motion.
Steady accretion through a thin disk requires that local cooling balance the vertically-integrated heating. In this article we focus on how radiation-dominated disks cool. Several dynamical instabilities have linear growth rates similar to or faster than the orbital frequency, and may lead to vertical energy transport in turbulence driven by the MRI. The instabilities considered are convection, the Shaviv modes and photon bubbles and have the following properties.
-
1.
The standard Shakura-Sunyaev model is convectively unstable (Bisnovatyi-Kogan & Blinnikov, 1977). Convection in two-dimensional radiation hydrodynamical disk calculations carries energy vertically at a rate similar to diffusion. The extra losses are not sufficient to quench the thermal instability (Agol et al., 2001). Convection may be absent if the heating from dissipation of magnetic fields is concentrated at low column depths due to magnetic buoyancy (Svensson & Zdziarski, 1994; Turner, 2004).
-
2.
Radiation-supported atmospheres through which photons diffuse in less than a sound-crossing time may be subject to a global linear instability even when convectively stable (Shaviv, 2001). The resulting overturning motions might lead to formation of low-density chimneys where the radiative flux is enhanced.
-
3.
Displacements of gas along magnetic field lines can be overstable, leading to growing, propagating density variations known as photon bubbles (Arons, 1992; Gammie, 1998). Growth is fastest at wavelengths shorter than the gas pressure scale height, and in the short-wavelength limit the instability is due to radiative driving of the density fluctuations found in slow magnetosonic waves (Blaes & Socrates, 2001). Numerical results on neutron star accretion columns indicate that short-wavelength photon bubble modes saturate at small amplitudes, and the later evolution of the instability is dominated by longer wavelengths (Hsu, Arons, & Klein, 1997). Photon bubble instability may lead to the development of trains of propagating shocks. The flux of radiation diffusing through the low-density gaps between the shocks could be substantially greater than in the hydrostatic atmosphere (Begelman, 2001).
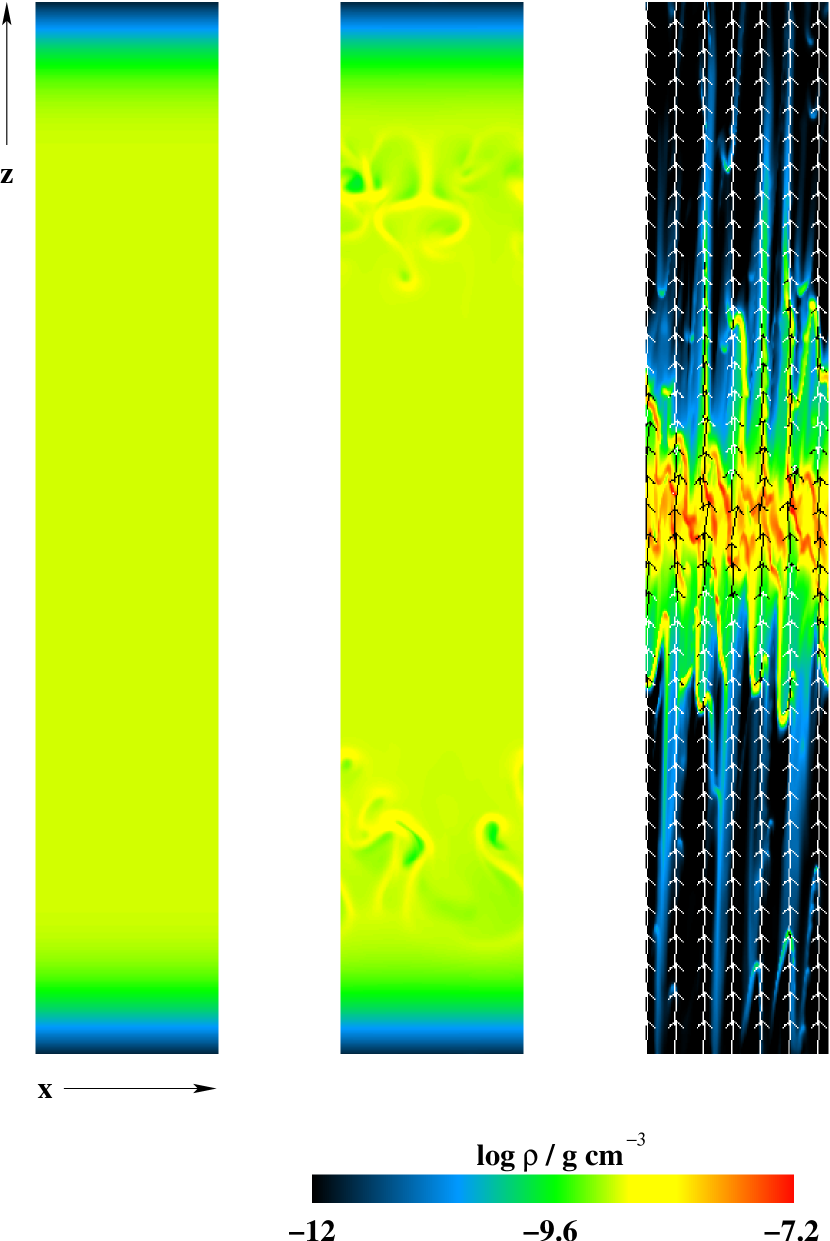
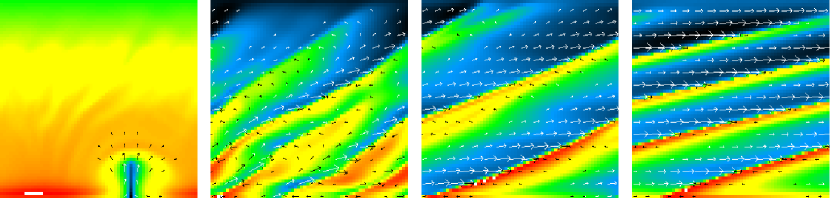
The effects of these three dynamical instabilities are explored by numerically solving the equations of radiation MHD in a patch of disk centered 20 Schwarzschild radii from a black hole of mass M⊙. The rapid cooling possible through convection and photon bubble instability is illustrated in figures 1 and 2. The domain height here is 2.3 times the disk thickness and the width is 17% of the height. The initial state is a standard Shakura-Sunyaev model with accretion rate 10% of the Eddington limit for a 10% radiative efficiency, constructed using a ratio of height-averaged accretion stress to gas plus radiation pressure . The dissipation rate per unit volume is assumed proportional to the density at each height. During the calculations, the -viscosity is omitted and there is no further injection of energy. We measure the rate at which the initial reservoir of energy is depleted by loss of radiation through the disk surfaces. To study the cooling processes separately from the energy release resulting from the MRI, we neglect the radial gradient in angular velocity. The side boundaries are periodic, and the top and bottom boundaries allow gas, radiation and magnetic fields to escape. The domain is divided into zones, and the initial equilibrium is disturbed slightly by applying random density perturbations with probability uniformly distributed between % and %. Any effects of the boundaries are reduced by applying the perturbations only in the disk interior where the density is greater than half the midplane value. In the case with a magnetic field, photon bubble instability leads to large density inhomogeneities. Radiation escapes through the patchy atmosphere in this case five times faster than through the smooth density distribution in the calculation with vertical diffusion alone.

The equations solved and numerical methods are described in section 2, and the construction of the initial equilibrium in section 3. In sections 4 and 5 we consider the effects of convection and the Shaviv (2001) instabilities, which require no magnetic fields. The growth rates of linear radiation MHD disturbances are compared against the results of the Blaes & Socrates (2003) WKB analysis in section 6. The linear photon bubble modes develop into trains of shock fronts. The shock structure is compared against the Begelman (2001) non-linear analytic solution in section 7 and limits on the growth of the shock trains are discussed. A summary and conclusions are in section 8.
2 EQUATIONS AND METHOD OF SOLUTION
The radiation magnetohydrodynamics (MHD) equations solved are frequency-averaged and include only terms that are of order unity in in at least one optical depth regime. A Cartesian coordinate system is used, with - and -axes lying in the disk midplane and -axis vertical. Ideal MHD is assumed. Conservation of mass, gas momentum, radiation momentum, gas energy, and radiation energy, and the evolution of magnetic fields are described by
| (1) |
| (2) |
| (3) |
| (4) |
| (5) |
and
| (6) |
(Mihalas & Mihalas, 1984; Stone, Mihalas, & Norman, 1992; Blaes & Socrates, 2003). The vertical component of the gravity of the black hole is included by an acceleration , proportional to the square of the Keplerian orbital frequency at domain center. The center is placed at radius and differential orbital motion is neglected. The opacities included are the flux-mean total opacity , which is dominated by electron scattering, and the Planck-mean free-free absorption opacity . The radiation is assumed to be sufficiently similar to a blackbody at the gas temperature that differences between the Planck-weighted and intensity-weighted frequency averages of the absorption opacity can be neglected. The set of equations 1 to 6 is closed using an ideal gas equation of state , with , and an Eddington tensor relating the radiation pressure tensor to the radiation energy density through . The angular dependence of the radiation field which determines the Eddington tensor is treated approximately using the flux-limited diffusion (FLD) method. The Eddington factor and the flux limiter approach in optically-thick regions. The limiter is reduced in optically-thin regions according to the prescription of Levermore & Pomraning (1981) equation 22, ensuring that photons transport energy no faster than light speed.
The equations are integrated using the Zeus MHD code (Stone & Norman, 1992a, b) with its FLD module (Turner & Stone, 2001). We make two kinds of calculation. Those spanning the thickness of the disk as in figure 1 show the overall cooling effects of the instabilities, while calculations of small patches of the surface layers are used for higher-resolution studies that are compared with analytic results. The timestep in the surface-layer calculations is limited by the diffusion step . The diffusion step is approximately the time for radiation to diffuse across the lowest-density grid zone, and depends on the grid spacing , number of spatial dimensions , and domain-maximum radiation diffusion coefficient . The numerical method is stable with longer timesteps due to the implicit differencing scheme used for the radiation source terms. However in calculations with longer steps, well-resolved short-wavelength linear photon bubble modes grow slower than expected (section 6.2). Execution times depend on the number of grid zones and the number of timesteps. With the timestep limited by diffusion, execution times are proportional to in 2-D and in 3-D calculations, so that high resolutions are obtained at considerable expense.
The domain for the calculations spanning the disk thickness is two orders of magnitude larger than the surface-layer patches and the diffusion timestep set by the initial minimum density is 30 times shorter. Results are obtained in a reasonable amount of computer time by allowing timesteps up to . While accuracy is sacrificed in the outermost layers, the timesteps are initially shorter than the time for photons to diffuse across grid zones within of the midplane, where the densities are more than 100 times the minimum. Extremely low densities and short timesteps are prevented in the full-disk-thickness calculations using a density floor. Gas is added to the grid where needed to bring the density up to 0.1% of the initial value at the midplane. The floor is not reached until significant evolution has occurred, at 2.82 orbits in the diffusion calculation, 2.05 orbits in the convection calculation and 0.76 orbits in the photon bubble calculation. In the calculations of the surface layer patches, no floor is applied and densities are allowed to become arbitrarily small.
3 DOMAIN AND INITIAL CONDITIONS
The initial states for the calculations shown in figure 1 are taken from a standard Shakura-Sunyaev model. The structure is in hydrostatic equilibrium and radiative balance, and heat is assumed to be deposited at a rate proportional to the density at each height. The construction of the initial condition is described below in section 3.1, and the initial state is shown in figure 3. The disk interior is radiation-supported and the half-thickness is set by the surface radiation flux . Characteristic speeds are the radiation sound speed and isothermal gas sound speed . Characteristic scales for disturbances are obtained by matching the corresponding pressure gradients to the gravity. The radiation pressure scale height is roughly equal to and the gas pressure scale height, , is shorter by times the ratio of radiation to gas pressure. The ratio of the pressures is 275 at the midplane so that the ratio of the two pressure scale heights is 367.
The density in the disk interior is almost uniform. The radiation flux increases linearly with height and the radiation force balances the vertical component of gravity. The time for radiation to diffuse from the midplane to a height is orbits or eight orbits. In the disk surface layers, densities are lower, so the flux varies little with height and gas pressure provides the extra support needed for hydrostatic balance. The thickness of the gas pressure supported surface layer is approximately and photons diffuse through this layer in about 0.01 orbit, much shorter than the gas sound crossing time orbit. Gas and radiation reach thermal equilibrium through emission and absorption of photons in a time ranging from orbits at the midplane to orbits at the lowest densities, so we choose to place the entire domain initially in thermal equilibrium. The total optical depth through the disk is 9200. The boundary conditions for the full-disk-thickness calculations are discussed in section 3.2. The initial and boundary conditions for the calculations in small patches of the surface layers are described in section 3.3.

3.1 Hydrostatic and Radiative Balance
The initial condition is constructed by vertically integrating the equations of hydrostatic equilibrium and radiative balance, assuming that the dissipation rate is proportional to the density, that gas and radiation are in thermal equilibrium, and that the radiation diffusion approximation holds. The integration runs from midplane to outer boundary. The midplane density is chosen so that the surface density matches the Shakura-Sunyaev model, and the midplane radiation pressure is chosen so the vertically-integrated accretion stress matches the assumed accretion rate .
The procedure in detail is as follows. The radial structure of the Shakura-Sunyaev model is used to determine the surface mass density,
| (7) |
and the flux through each face of the disk,
| (8) |
The Eddington luminosity in equation 7 is the value for which outward radiation forces balance the gravity of the black hole in spherical symmetry. The factor occurs because the accretion stress is assumed to approach zero at the disk inner edge, , placed at . The choice of conditions at the inner edge is expected to have little effect on the outcome of the calculations at . Given the surface density and flux, the vertical structure is completely specified by the vertical component of the equation of motion
| (9) |
and the summed gas and radiation energy equations
| (10) |
together with boundary values for density and temperature. Equations 9 and 10 are integrated simultaneously from the midplane outward. The midplane density is chosen so that the surface density of the resulting structure is . The surface density is measured between the top and bottom surfaces of the disk at optical depth unity. The midplane temperature is adjusted until the height-integrated accretion stress is sufficient to produce the accretion rate, so that
| (11) |
As with the surface density, the vertical integration extends to the surfaces of unit optical depth.
The initial state is constructed assuming Eddington factors of one-third throughout. This is inaccurate above the photosphere, where the specific intensity is expected to be greater looking down than up. Direct integration of the transfer equation indicates that the Eddington factor at zero optical depth is 0.42. The smaller Eddington factor used corresponds to shallower gradients in radiation energy density and higher temperatures near the photosphere. The higher temperatures lead to slower growth of photon bubbles in the disk surface layers, as the fastest growth rates are proportional to (Blaes & Socrates, 2003). Our calculations therefore place a lower bound on the growth rates of photon bubbles in the Shakura-Sunyaev model.
3.2 Boundary Conditions
Gas, magnetic fields, and radiation are allowed to flow out through the upper and lower boundaries of the full-disk-thickness calculations, and radiation is allowed also to diffuse out. The gradients of gas temperature and density across the boundaries are set to zero. The vertical velocity is restricted to zero or outward values, so that gas may flow out, but not in. The outflow boundary condition on the magnetic field is imposed through the electromotive force (EMF). The gradient in the EMF is zero across the boundary (Stone & Norman, 1992b). Radiation energy densities outside the domain are chosen so that the flux across the boundary is approximately equal to the flux between the outermost pair of active zones. The fluxes are calculated using the diffusion coefficients obtained in the previous timestep, so that the boundary condition corresponds exactly to only when the flow is time-independent. Should the flux be directed into the domain, the radiation energy densities outside are chosen to make the flux zero, preventing radiation from entering. The side boundaries are periodic.
3.3 Surface Layers
The domain for the calculations of the disk surface layers extends from 0.95 to above the midplane. The initial conditions for these calculations are constructed assuming no dissipation occurs within the domain, so the flux is independent of height. The resulting structure has density gradients slightly steeper than the corresponding region in the calculations spanning the whole disk thickness. The temperature and density at the height in the full vertical structure that corresponds to the center of the smaller domain are used as starting conditions for the integration of the hydrostatic equilibrium and flux balance equations, 9 and 10. The flux throughout is set to the value at the height corresponding to the bottom of the surface layer domain and the dissipation term on the right-hand side of equation 10 is zero. The vertical integration is first performed assuming that the opacity is due to electron scattering alone. A more accurate equilibrium is obtained with a second integration, including free-free opacities calculated using the temperatures and densities resulting from the first approximation. The resulting structure when placed in a 1-D vertical radiation hydrodynamic calculation shows residual motions initially less than times the radiation acoustic speed, and decreasing or constant over 10 orbits. The structure is convectively stable, with radiation and gas Brunt-Väisälä frequencies ranging from 1.17 and at the lower boundary to 7.19 and at the top. The total optical depth is 287. Characteristic lengths are the density scale height and the gas pressure scale height . The density scale height ranges from at the bottom boundary to at the top, and the density declines by a factor 14 or -foldings over the height of the surface layer patch. The gas pressure scale height is the longest distance over which gas pressure disturbances can balance gravity. It depends on the temperature and gravity, which are almost uniform over the domain. The gas pressure scale height is at domain bottom, at center and at top. The ratio of radiation to gas pressure ranges from 121 at the lower boundary to 1500 at the top, and at domain center the ratio is 254. At the lower boundary in the surface layer calculations, the temperature and density are fixed at their initial values, and the vertical velocity is zero. The fixed temperature means that the supply of radiation energy diffusing into the patch from below is inexhaustible. The side and top boundaries are treated as in the calculations spanning the disk thickness.
4 CONVECTION
Radiation-dominated Shakura-Sunyaev equilibria are convectively unstable (Bisnovatyi-Kogan & Blinnikov, 1977), with the fastest modes growing at about the orbital frequency (Pietrini & Krolik, 2000). Greatest convective instability in the initial condition for the calculations in figure 1 occurs a little below the disk surface, at , as shown in figure 3, lower left panel. Growth begins in the numerical calculations from initial random 1% density perturbations applied within of the midplane, where the density is greater than half the midplane value. Growth rates during the linear stage are measured using Fourier power spectra of the horizontal velocities in a square region spanning the domain width and extending from to above the midplane. The fastest mode has horizontal and vertical wavelengths 0.2 and and grows at . The fastest mode in the corresponding region below the midplane has horizontal and vertical wavelengths 0.13 and and grows at . These fastest modes are well-resolved, with 40 or more grid zones per wavelength. Among the solutions of the local linear dispersion relation, Blaes & Socrates (2003) equation 49, the same two wavevectors grow fastest. The analytic growth rates of both modes peak at height , where the rates are approximately equal and are . At the upper boundary of the measurement region at there is convective stability, while at the lower boundary at , the dispersion relation indicates both modes grow at . The differences between the fastest modes in the numerical and analytic solutions are much less than the range in local analytic growth rates across the region. The WKB approximation is marginally applicable to the fastest modes, as the radiation pressure at the top of the region is 1.7 times less than at the bottom. Nevertheless the WKB solutions and the numerical results are consistent.
Once the disturbances reach non-linear amplitudes in the convection calculation, overdense gas falls toward the midplane and underdense material rises toward the vertical boundaries. Radiation is carried with the rising gas, leading to an overall increase in the cooling rate (figure 2). The mean cooling rate between 2.25 and 3.25 orbits is 1.6 times that in the diffusion calculation. The horizontally-averaged ram pressure of the motions is greater than the gas pressure and less than the radiation pressure. The horizontal separation between dense sinking plumes of gas is about equal to the domain width, so we check whether cooling is limited by the width using a version with the horizontal size doubled and the number of zones in the horizontal direction increased to 256. The cooling rate is similar and the radiation energy falls to half its initial value in 2.1 orbits.
5 OVERTURNING MODES
Results of a linear stability analysis indicate that unmagnetized electron-scattering atmospheres transmitting a flux greater than about half the local Eddington limit are subject to two instabilities driven by the rapid diffusion of radiation with respect to the gas (Shaviv, 2001). The analysis is 2-D, and is local in the horizontal direction and global in the vertical direction. The temperature and gravity used by Shaviv are appropriate to a white dwarf envelope during a nova outburst. The first of the modes, type I, is stationary, with density and radiation pressure disturbances anticorrelated, and was seen only in calculations with fixed-temperature lower boundary. Its growth time is similar to the time for gas sound waves to cross the density scale height. The second mode, type II, is propagating, with a phase lag between density and radiation pressure disturbances, and appears in calculations with a variety of boundary conditions. Its growth is an order of magnitude slower.
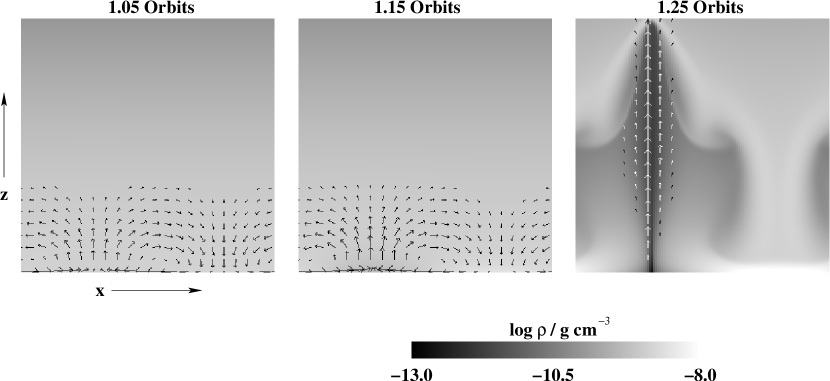
We search for growing radiation hydrodynamical modes of the surface layers of the disk model shown in figure 3, using numerical calculations without magnetic fields. The domain extends from to above the midplane, as described in section 3.3. In the first series of calculations, the domain width is equal to the height and symmetry is assumed along the third dimension. Initial density perturbations are applied in the middle half of the domain height. The perturbation in each grid zone is random, with probability uniformly distributed over the interval . During the calculations an exponentially-growing mode appears. The horizontal variation can be represented by a single Fourier component with wavelength equal to the domain width while the vertical variation is the sum of several Fourier components having growth rates identical within the time fluctuations, indicating the mode is global. The instability occurs when low density at one location near the bottom boundary leads to a larger radiation flux, which drives material up and away from the boundary, further reducing the density. In regions of higher density to either side, gas falls, producing an overturning pattern shown in figure 4. The pattern is stationary and grows in place. It is localized near the bottom boundary and its amplitude decreases sharply with height. Density and radiation pressure are approximately anticorrelated. The largest positive density and negative radiation pressure perturbations lie at the same horizontal position, but the radiation pressure extremum is offset higher by 0.05 density scale height. When the disturbance reaches non-linear amplitudes, the rising gas forms an evacuated chimney in which the flux is greater than the surroundings. The horizontally-averaged flux at the last time shown in figure 4 is 4.6 times the flux in the initial hydrostatic atmosphere. Material is lost quickly through the chimney, and the total mass in the domain decreases 4% during the 0.01 orbits before the last time shown. The chimney structure may prove to disrupt the layer in which it forms. Radiation diffusion is required for instability, as no growth is seen in an otherwise identical calculation with the diffusion term in equation 5 omitted.
The variation of the instability with horizontal wavelength is checked using calculations in a wider domain. The width is increased fourfold to and several modes with global vertical patterns grow exponentially. The dependence of growth rate on horizontal wavenumber and numerical resolution is shown in figure 5. The fastest modes have horizontal wavelengths roughly . Growth rates increase with numerical resolution, so we have not achieved numerical convergence. The first null in horizontal velocity lies 2 grid zones above the bottom boundary in the calculations with 32 zones in the height, and 3, 6 and 12 zones above the boundary in the calculations with 64, 128 and 256 zones in the height, respectively; the pattern is poorly resolved on the coarser grids. Like the type I instability, the overturning modes grow fastest at intermediate horizontal wavenumbers, and are stable for and large. In the linear analysis by Shaviv (2001), the fastest modes have horizontal wavelengths roughly times the density scale height and growth rates comparable to the ratio of gas sound speed to density scale height. In the present calculations these correspond to horizontal wavenumber and growth rate at domain center. The growth rate and wavenumber increase with the Eddington ratio up to the largest value 0.9 examined by Shaviv (2001). The Eddington ratio at domain center in our calculations is 0.94 and the wavenumber and growth rate of the fastest mode are greater than those estimated by Shaviv.

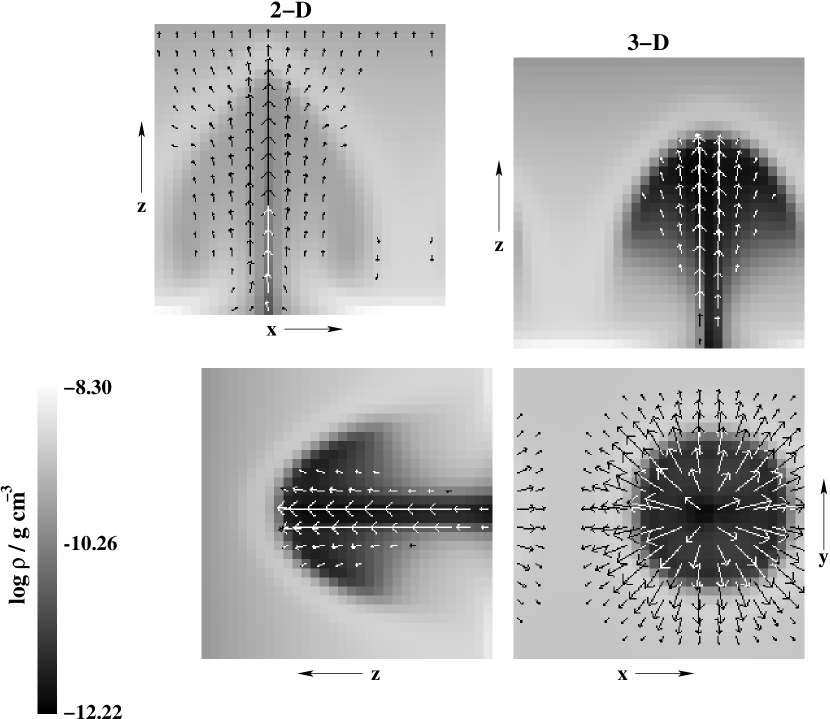
Instability in three dimensions is tested using a single calculation at the same location, with the volume of divided into zones. The fastest-growing mode is again an overturning pattern that is global in the vertical direction, with wavelengths along both horizontal axes equal to the domain size. Its linear growth rate is the same within the amplitude of small time variations as the fastest mode in the 2-D calculation of the same domain width and resolution. The gas motions soon after the development of a chimney structure are shown in figure 6.
The overturning instability appears to be of the first type described by Shaviv (2001). Both are local in the horizontal and global in the vertical direction; require radiation diffusion; have density and radiation pressure perturbations stationary and anti-correlated; and grow fastest at about the gas sound crossing rate for wavelengths comparable to the density scale height. The instability is vigorous in our disk surface layer calculations, growing faster than the orbital frequency. Disturbances reaching non-linear amplitudes develop into narrow chimneys of low-density gas moving rapidly upwards, separated by larger regions of denser down-welling material. Radiation escapes readily through the chimneys.
No Shaviv type I modes are observed in the convection calculation shown in figure 1 where the spatial resolution matches that in the surface-layer calculation with zones. The type I modes may require a lower boundary of fixed temperature, and if this is so they are unlikely to play a major role in cooling radiation-dominated accretion disks. The modes could be important in situations where a radiation-supported atmosphere lies above a thermal conductivity discontinuity, as in accreting, weakly-magnetized neutron stars and in high-mass stars with internal composition boundaries. No modes resembling Shaviv’s slower-growing type II instability were found in our calculations. The absence may be due to differences including our lower temperature and density, smaller gravity that increases with height, and greater optical depth.
6 LINEAR PHOTON BUBBLE INSTABILITY
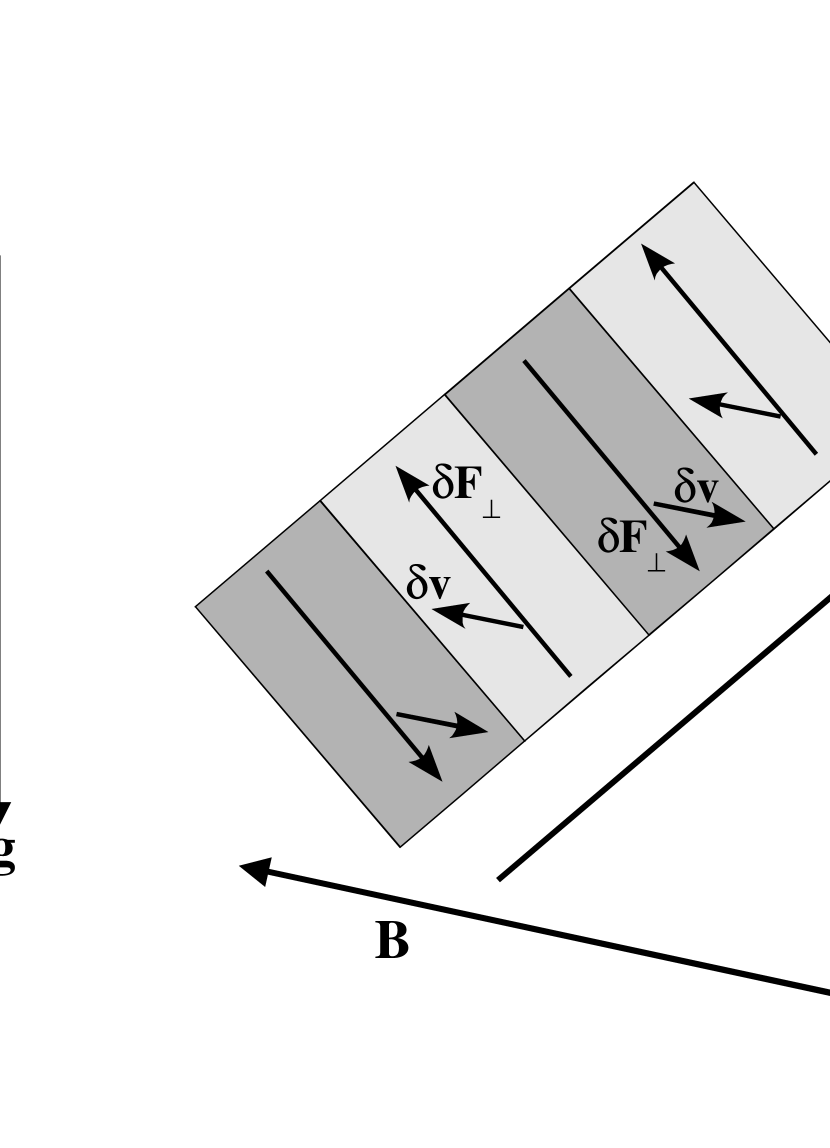
Unlike convection and the overturning modes, photon bubbles require magnetic fields. The source of free energy for photon bubble instability is the gradient in radiation pressure that supports the disk against gravity in the vertical direction. Instability occurs when density disturbances lead to flux perturbations having a component parallel to the magnetic field. The greater flux in regions of low density accelerates gas out of these regions along field lines, leading to an increase in the density contrast with time as illustrated in figure 7. A mathematical justification for this picture is presented in the appendix. When magnetic fields are absent, compressional motions are purely longitudinal in the short-wavelength limit. Sound waves displace the gas along the wavevector and perpendicular to the flux perturbations, so there is no net acceleration over a wave period and no instability.
In this section we look at the exponential growth of small-amplitude photon bubbles. The growth rate varies with the wavelength, the direction of propagation and the magnetic field strength and orientation. However the growth rate is independent of field strength for magnetic pressures greater than the gas pressure. Furthermore the fastest modes have wavelengths shorter than times the gas pressure scale height but long enough to be optically-thick, and over this range the growth rate varies slowly with wavelength. The fastest growth occurs when the wavefronts and the fields are close to the vertical but tilted slightly with respect to one another.
6.1 Dependence on the Wavevector
We compare the photon bubble growth against the predictions of Blaes & Socrates (2003). They carried out a WKB plane-wave analysis, treating the radiation field in the Eddington approximation and found that photon bubbles in the limit of short wavelengths are unstable slow magnetosonic waves. The growth rate increases with wavenumber for fixed propagation direction, approaching an asymptote at wavenumbers greater than the inverse gas pressure scale height if the gas and radiation reach thermal equilibrium in much less than a wave period. The comparison is made using the same patch of the disk surface layers as in section 5. In the first set of 2-D calculations, the magnetic field is initially uniform and horizontal. The field strength is chosen so the magnetic pressure is 10% of the midplane radiation pressure, or 25% of the radiation pressure at the center of the surface layer patch. Because the group velocity is nearly parallel to the field, unstable waves arising near domain center propagate many times across the width, taking more than 10 orbits to reach the upper or lower boundary. Any possible effects of the boundaries are further reduced by applying initial density perturbations only in the middle half of the domain height. As in section 5, the perturbations are random in each grid zone, with .
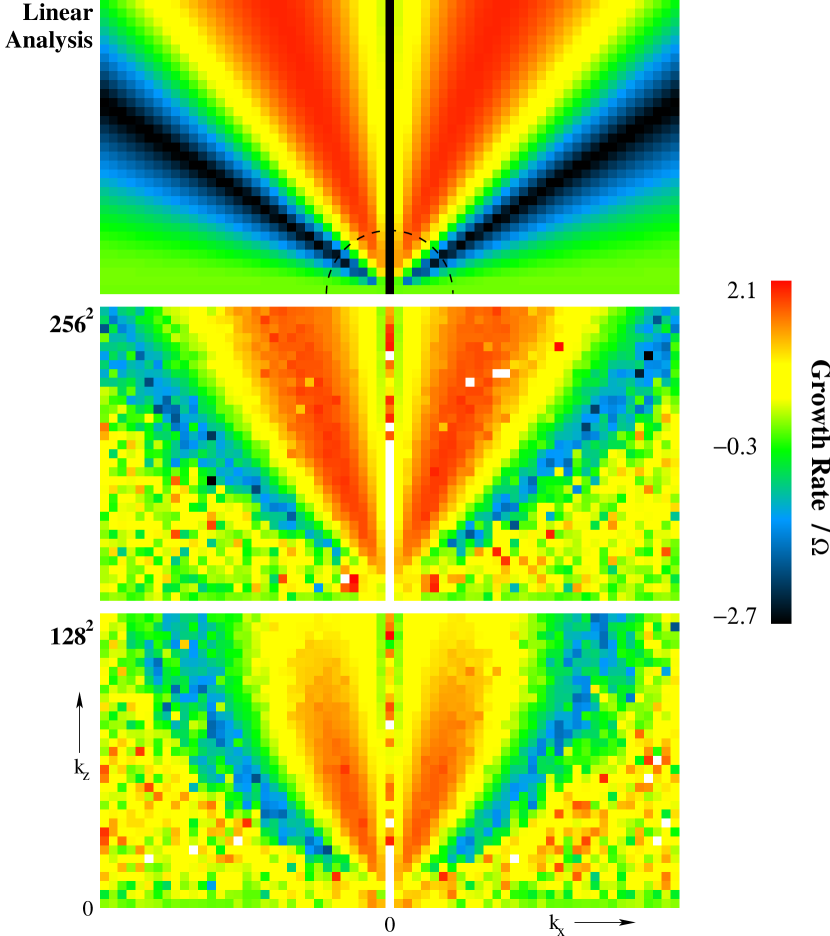
During the evolution, mode amplitudes are measured every 0.01 orbits using Fourier power spectra of the horizontal velocities. The growth rates are averaged in time over the period of exponential growth and averaged together for pairs of modes with wavevectors mirror-symmetric about the vertical. The case of horizontal fields is special as modes traveling to left and right grow at equal rates. Growth rate is plotted versus wavenumber in figure 8, for modes with wavevectors from horizontal. The longest-wavelength of these modes fitting in the domain has one wavelength across the width and two in the height and the first five overtones are also shown. The mean density scale height is intermediate between the vertical wavelengths of the fundamental and first overtone, so that the WKB assumption is violated for the fundamental mode. Exact numerical convergence of the surface-layer patch to a single WKB solution is not expected because the variation of growth rate with height depends on the wavenumber. Nevertheless the measured growth rates are in good agreement with the linear analysis. Modes that are well-resolved, having fifteen or more grid zones per wavelength, grow at rates within 10% of those predicted for domain center. The growth rate difference between the numerical solution and the domain-center analytic solution for the second and third overtones varies approximately quadratically with the grid spacing, as it should with a numerical method of second-order accuracy.

The variation of growth rate with propagation direction is shown in figure 9. The most unstable modes at domain center have wavevectors from horizontal. Modes propagating parallel to the radiative flux are stable because there is no flux perturbation parallel to the wavefronts. Modes propagating exactly parallel or perpendicular to the magnetic field are stable because displacements lie along the wavevector as in hydrodynamic acoustic waves. For other propagation directions, the growth rate increases only slowly with wavenumber for , or wavelengths less than one-seventh the domain height. Lines of constant growth rate in the top panel of figure 9 are almost radial except near .
6.2 Dependence on Timestep and Optical Depth
The effects of the numerical timestep on the linear growth rate are checked using a version of the calculation with timesteps ten times longer than the diffusion timestep. The fundamental and first overtone grow at rates similar to those shown in figure 8, but the shorter-wavelength modes grow more slowly than expected. The shortest wavelength mode plotted in figure 8 grows at in the calculation using the diffusion timestep, and in the calculation with long timesteps. These results are consistent with the expectation for diffusion processes that the shortest wavelength accurately represented is proportional to the square root of the timestep.
Photon bubble instability is absent in the limit of large optical depth. A version of the calculation is made with the diffusion term omitted from equation 5. After 3 orbits, the largest speeds are times the gas sound speed, while by the same time in the version including diffusion, speeds resulting from photon bubbles have grown greater than the gas sound speed.
For sufficiently large wavenumbers, the optical depth per wavelength is less than unity and disturbances in the radiation field are poorly described by the Eddington approximation used in the linear analysis. In the limit of low optical depth, there is no flux perturbation and no photon bubble instability (Blaes & Socrates, 2003). At domain center in the surface layer calculations, the optical depth per wavelength is unity at wavenumber . This wavenumber is unresolved even in our highest-resolution numerical calculation, where grid zones at domain center have optical depth 1.06.
Thermal equilibrium between gas and radiation holds throughout the surface layer domain, as the time for the gas temperature to change by emission and absorption of photons is much shorter even than the oscillation period of the modes with unit optical depth per wavelength.
6.3 Three-Dimensional Modes
The fastest-growing linear photon bubble modes are symmetric perpendicular to the plane containing the radiative flux and magnetic field. Modes with wavelength shorter than along the third direction are expected to grow noticeably slower than the symmetric modes in the surface layers of the model disk. We carried out a 3-D surface-layer calculation with a horizontal magnetic field having pressure 10% of the midplane radiation pressure. The variation of growth rate with wavenumber along the third direction is shown in figure 10 and is consistent with the linear analysis.

6.4 Dependence on the Magnetic Field
The spectrum of linear photon bubble modes is independent of magnetic field strength if the magnetic pressure is greater than the gas pressure, as shown in figure 11. Growth at in the model disk is faster than the MRI for some propagation direction if the magnetic pressure is greater than one-thirtieth the gas pressure. The numerical results in figure 11 are from a set of 2-D surface-layer calculations in which the strength of the initial horizontal magnetic field is varied. In the cases with magnetic pressure less than gas pressure, both the photon bubble and overturn instabilities are present and gas motions lead to bending of the fields. Although the overturning modes are global, they are localized near the bottom boundary, so photon bubble growth rates were measured separately by using the horizontal velocities in the upper half of the domain. The overturning instability grows at in the calculation with magnetic pressure 0.1% of domain-center radiation pressure, significantly slower than the rate in the calculation of the same resolution without magnetic fields shown in figure 5. The fields resist the overturning motions.

The growth rate of the photon bubble instability depends also on the inclination of the magnetic field. The effects of a small inclination are examined using a set of 2-D surface-layer calculations, with a magnetic pressure 10% of the midplane radiation pressure as in section 6.1 but tilted from horizontal. Growth is fastest for wavefronts lying in the acute angle between the magnetic field and the radiation flux. The fastest modes have group velocities lying close to magnetic field lines, with the vertical component negative. Photon bubbles originating near domain center reach the bottom boundary after crossing the width of the box about 2.4 times, in 0.8 orbits. The reflecting lower boundary leads to some exchange of energy between modes, so that only the growth of the fastest mode is reliably measured. The linear growth rates of the fastest modes in calculations of different resolutions are plotted against wavenumber in figure 12. The differences from the linear analysis are less than the variation in growth rate over the domain height.

6.5 Fastest-Growing Modes
Photon bubble growth rates depend on the orientations of the wavevector and magnetic field. The angles of fastest growth are found in this section. The results are independent of the field strength, as the magnetic pressure is fixed at 10% of the midplane radiation pressure and is much greater than the gas pressure. Based on the linear analysis and results of sections 6.1 and 6.2, growth is expected to be fastest for wavenumbers between and . The angle dependence of the growth rates at the low end of this range is shown in figure 13. The growth rates of photon bubbles with wavenumber equal to the inverse gas pressure scale height can be seen to increase with the inclination of the magnetic field. The fastest mode on horizontal fields grows at , on fields inclined at and on fields inclined at . The fastest modes of all have wavevectors almost horizontal, magnetic field inclined from vertical in the opposing sense and growth rate . The patterns are similar for larger wavenumbers of 10 and 40 times the inverse gas pressure scale height except that the fastest modes have wavevectors more nearly horizontal and magnetic fields more nearly vertical so that the perturbations in flux and velocity are close to parallel and driving is maximized. The growth rates are 8.9 and 9.5 times the orbital frequency, respectively. The maximum growth rate at the largest wavenumber is 9% less than the asymptotic rate obtained from Blaes & Socrates (2003) equation 93 with radiation and magnetic pressures much greater than gas pressure.
Accurate measurements of growth rate on inclined fields are difficult in surface-layer calculations owing to the effects of the lower boundary. We measure growth rates instead using a higher-resolution version of the radiation-MHD calculation shown in figure 1, spanning the disk thickness. The grid resolution is doubled to zones so that the grid spacing is the same as in the surface-layer runs of figures 8 and 12. As in figure 1, the timesteps chosen are 100 times the diffusion step set by the minimum density, found outside the photosphere. More precise measurement of the linear growth rates is made possible by smaller initial random density perturbations of one part per million. The mode amplitudes are measured from the Fourier transforms of the horizontal velocity in the square region between 0.65 and above the midplane. The fastest mode showing sustained exponential growth has 31 wavelengths in the width and 8 in the height of the selected region, corresponding to a wavevector from horizontal, a wavenumber 1.16 times the initial inverse gas pressure scale height at and a wavelength of 8 grid zones. Its growth rate is . The local dispersion relation near the top of the region at indicates this mode is expected to grow at , fastest among all those with the same and smaller wavenumber. The dispersion relation near the bottom of the region at indicates the same mode is expected to grow at . The growth rate measured in the numerical calculation lies near the middle of the range expected over the region based on the linear analysis.

7 SHOCK TRAINS
Begelman (2001) showed that a radiation-supported atmosphere with a strong magnetic field can sustain a train of propagating shocks. A 1-D analytic solution was found by neglecting the change in background quantities from one shock to the next so that the flow is periodic and assuming rapid photon diffusion so the gas is isothermal. In the solution, Lagrangean fluid elements move back and forth along inclined magnetic field lines. Where the density is low, the gas transmits a large radiative flux and is driven up field lines by the radiation force. On striking high-density material it shocks, is compressed and slides back down the field under gravity. The solution relates the inclination and spacing of the fronts, the density jump across the shocks and the overall flux of radiation through the atmosphere. Given any two of these four quantities, the other two can be calculated.
The shock train, like the photon bubble instability, is a propagating disturbance that requires a magnetic field and is driven by radiative flux changes associated with density perturbations. In this section we show that photon bubbles reaching non-linear amplitudes become shock trains. To spatially resolve the fast-growing linear modes with wavenumbers near the inverse gas pressure scale height, we use calculations of the disk surface layers. A fiducial calculation is described in section 7.1 and compared with the non-linear analytic solution in section 7.2. The stability of the shocks is discussed in section 7.3 and the dependence on magnetic field strength and orientation in section 7.4. Limits on growth near the disk photosphere are examined in section 7.5. The wavelengths of disturbances reaching order unity generally increase with time. Calculations extending through the whole thickness of the disk have lower resolution, but allow the shocks to become more widely-spaced and better show the effects of the vertical gradients in background quantities. They are described in section 7.6.
7.1 Fiducial Calculation
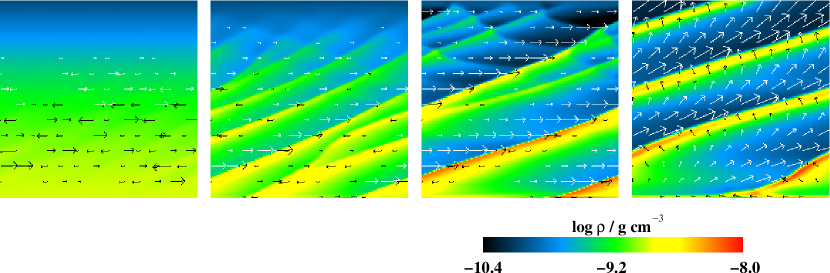
A fiducial calculation of the growth of shocks in the disk surface layers is made using conditions identical to those in section 6.1 except that the field is tilted from horizontal and the random initial density perturbations have amplitude 0.1%. The domain is divided into zones. The calculation passes through three main phases: exponential growth, merging shocks and a steady shock pattern (figure 14). During an initial transient lasting 0.1 orbits, the density perturbations lead to disturbances in the flux and to gas motions. Photon bubble modes then become established and grow exponentially. Modes with wavefronts tilted to the same side as the magnetic field grow fastest. The most unstable has 3 wavelengths in the domain width and 7 in the height and grows at . Velocities exceed 10% of the isothermal gas sound speed at 0.72 orbits and the wave pattern steepens into a train of traveling shocks, with the same orientation as the wavefronts of the fastest linear mode. Growth slows at 0.9 orbits, when densities range from half to twice their initial values. During the second phase, shocks merge because gas accelerated through the low-density regions reaches lower speeds if the fronts are closer together. A trailing shock propagates faster into the slow-moving upstream gas, eventually overtaking the shock ahead. The merged fronts are more and more widely spaced and the density contrast and mean radiation flux increase. Mergers continue until at 1.6 orbits there is just one front in the domain width and two in the height. The horizontal spacing of fronts is then constant during the third phase. Propagation is fastest near the bottom edge where the local flux is greatest due to the fixed temperature of the boundary. The fronts are sheared and become more nearly horizontal over time. The mean flux through the top boundary and the gas speeds increase until at 1.74 orbits ram pressure exceeds magnetic pressure at some locations, the fields buckle, the pattern is disrupted and material is lost through the top boundary.
7.2 Comparison with Analytic Solution
We compare the results of the fiducial calculation against an improved version of the Begelman (2001) shock train solution. Because the flux is proportional to the radiation energy gradient divided by the density, the curl of ought to be zero. This is ensured by choosing a form for the flux
| (12) |
replacing equation 16 of Begelman (2001). The first term is the flux through the hydrostatic atmosphere. The disturbances are separated into components along the unit vector parallel to the shock fronts and along the perpendicular direction . We write for the angle between the shock fronts and the horizontal, for the mean density and for the horizontal component of the shock propagation speed. The form of the flux used by Begelman (2001) when written in this notation differs only by an extra factor in the term proportional to . The solution is obtained by the same steps used in Begelman (2001) and relates the same four parameters, the inclination and spacing of the shock fronts, the size of the density jump and the enhancement in the flux. The horizontal distance between shocks in units of the gas pressure scale height is
| (13) |
and the enhancement in the vertical component of the flux in the limit of strong magnetic fields becomes
| (14) |
where is the ratio of the maximum density to the mean and is the angle between the magnetic field and the horizontal. The ratio of the minimum density to the mean is expected to equal . The quantities we compare between the analytic and numerical solutions are (1) the density structure, (2) the density contrast – shock spacing relationship and (3) the flux enhancement.
The density along a ray perpendicular to the shock fronts at domain center in the fiducial calculation is shown with the analytic solution in figure 15. For the analytic solution, the inclination and spacing of the fronts are set equal to the values measured in the numerical calculation and the amplitude of the density variation is found by inverting equation 13. There is general agreement between the two solutions in the amplitude and shape of the resulting pattern, but several differences are apparent. The analytic solution is periodic by assumption, while the background density and shock strength in the numerical calculation vary with height and are greater below domain center. The pattern is reduced in strength near the top and bottom boundaries. Also, the shocks are spread over several grid zones in the fiducial calculation for numerical stability, while in the analytic solution the shocks are arbitrarily thin. Similar profiles are found on other rays perpendicular to the fronts. The agreement in the fiducial calculation is better than in a version with a coarser grid of zones, indicating that some of the departure from the analytic solution is due to the limited spatial resolution. At earlier times during the shock merger phase in the fiducial run, a range of separations is present, violating the analytic assumption of periodic structure.

The distance between shocks in the fiducial calculation increases with the overdensity as shown in figure 16. The domain-averaged shock spacing and inclination are measured by locating local density maxima along rows and columns. Maxima found next to converging flows are counted as shocks. Also shown is an analytic estimate computed from equation 13 using the overdensities and shock inclinations in the numerical calculation, the initial magnetic field angle and the background quantities at domain center. The relationship between overdensity and shock separation in the numerical calculation agrees well with the analytic expectation except near the start and end of the calculation. Near the start, the front spacing is overestimated because the small-amplitude waves have density maxima offset by a quarter-wavelength from the locations of fastest compression and are missed from the count. Near the end, the analytic assumptions of straight magnetic field lines and time-averaged hydrostatic equilibrium no longer hold.

The radiation flux in the fiducial calculation is shown as a function of the overdensity in figure 17. The vertical component of the flux in the frame co-moving with the gas is averaged along a horizontal line passing through domain center, and plotted in units of the flux in the initial hydrostatic atmosphere. The overdensity is the maximum ratio of the density to the initial density on the same horizontal line. Each plotted point marks a measurement from one snapshot in the fiducial calculation, while a dotted curve shows the analytic estimate from equation 14. The two solutions agree well until the shock spacing approaches the density scale height, violating the analytic assumption that the background quantities vary little over a wavelength. The flux in the numerical calculation is then greater, but increases with overdensity at about the same rate as in the analytic solution. During the final 0.07 orbits, fluxes become much greater than in the analytic solution as the magnetic fields buckle and gas is ejected through the top boundary.

7.3 Stability in Three Dimensions
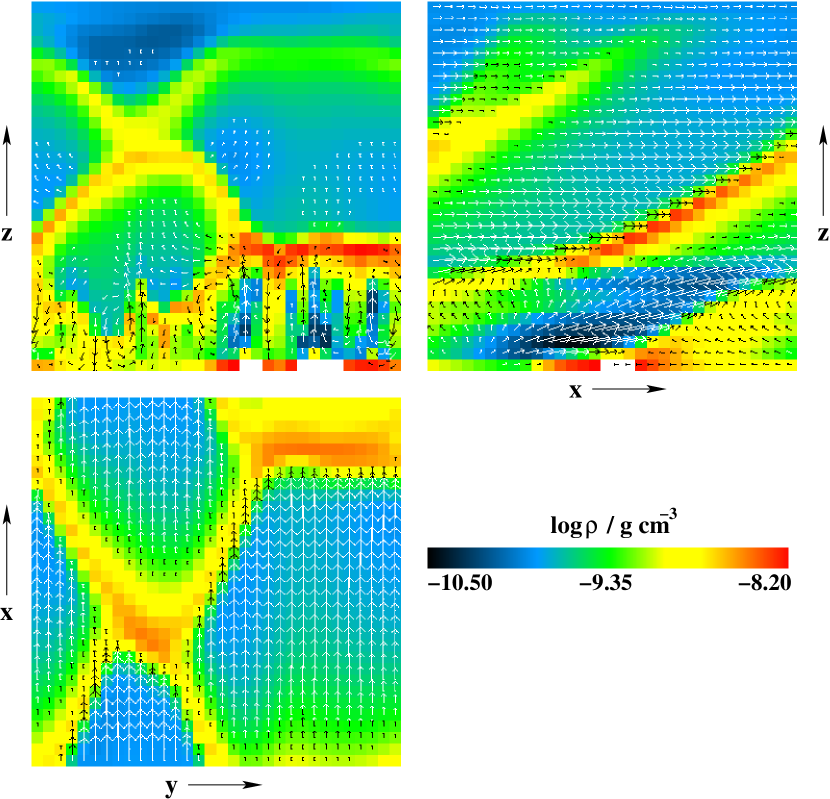
Shocks grow in the fiducial calculation until the pattern is disrupted by buckling of the magnetic field. However in three dimensions, the field provides stiffness only along one horizontal axis, and variations along the other horizontal direction could destroy the shock pattern at an earlier stage. A three-dimensional version of the fiducial calculation is made by extending the domain along the third or -axis to make a cube of volume divided into zones. Other parameters are identical to the fiducial calculation, with each magnetic field line lying on an – plane and inclined from horizontal. The results on individual cross-sections perpendicular to the third direction are initially quite similar to the fiducial run, with the linear instability leading to a train of parallel inclined propagating shocks that merge, until at 1.5 orbits the horizontal shock separation is equal to the domain -extent. Stucture along the third axis is at large scales, with the greatest Fourier power in the modes with wavelength equal to the domain -size. The development is changed by a secondary instability that becomes apparent after 1.5 orbits, when an overturning pattern appears near the bottom boundary (figure 18). The overturning motions lie in the – plane and are approximately symmetric along the -direction parallel to the magnetic field. Some field lines move up, leaving behind lower gas densities near the bottom boundary, while field lines at nearby -positions move down, locally increasing the density. The wavelength along the -direction is about one-sixth the domain size, or five grid zones. The pattern grows rapidly and vertical speeds exceed the gas sound speed after 1.62 orbits. The rising gas penetrates the overlying shock pattern, disrupting it by 1.89 orbits. The secondary instability resembles the Shaviv type I instability in that overturning motions lead to the growth of low-density chimneys of rising material, but differs in that the horizontal wavelength is six times shorter. The secondary instability might be a form of the two-dimensional type I instability modified by the shear and if that is the case, may also require a special lower boundary condition.
7.4 Dependence on Magnetic Field
The magnetic field orientation affects the growth rate and propagation direction of the fastest photon bubble mode (section 6) and therefore how quickly shocks develop and at what angle they first appear. The orientation of the field is varied in a series of calculations with zones that are otherwise identical to the fiducial surface-layer run of section 7.1. On horizontal fields, modes propagating to left and right grow at equal rates, leading to a pattern of crossed shocks shown in figure 19. On fields inclined three degrees or more from horizontal, the shock pattern is dominated by fronts of one inclination, propagating downhill along the field. Each calculation passes through the same three phases as the fiducial calculation, ending with a single shock in the domain width. In the calculation with horizontal fields, both the left and right-moving fronts have horizontal separation equal to the domain width. On fields inclined 12 and 24 degrees, during the shock merging phase, gas in low-density regions near the fixed lower boundary is accelerated upward by the radiation force, leaving behind extremely low densities. The corresponding large fluxes lead to bending of the field and disruption of the pattern.
The strength of the magnetic field affects the shocks through field line bending. A series of surface-layer calculations was made with fields having different strengths but a common inclination of 3 degrees. The initial magnetic pressures are 0.1, 1, 10 and 100% of the radiation pressure at domain center or 0.254 to 254 times the domain-center gas pressure. A snapshot from each calculation is shown in figure 20. The results are described below and may be compared with the fiducial calculation, where the magnetic pressure is 25% of the domain-center radiation pressure.
-
1.
In the weakest-field case, the first instabilities reaching non-linear amplitudes are photon bubbles in the upper two-thirds of the domain and the Shaviv type I overturn instability in the lower one-third. The magnetic fields are bent by gas pressure gradient and radiation forces when the disturbances reach non-linear amplitudes. At 0.6 orbits, the largest density variations due to photon bubbles are 5%, those due to the overturn instability are 9% and the field inclination ranges seven degrees either side of its starting value. At 0.8 orbits the speeds due to the photon bubbles approach the gas sound speed. The evolution after 0.8 orbits is dominated by a vertical chimney of rising, low-density gas that develops from the overturn instability and pushes aside the magnetic fields and weak shock train.
-
2.
In the case with magnetic pressure 1% of the domain-center radiation pressure, field lines are first bent by more than five degrees at 0.7 orbits, when the largest ram pressure, dyn cm-2, is still much less than the magnetic and gas pressures at the same location, and dyn cm-2, respectively. The forces bending the field lines are roughly equal parts due to the flux perturbations and gas pressure gradients from the density variations in the photon bubbles. Gas collects near shock fronts at inflection points in the field lines, further increasing the density contrast which reaches a factor five at one orbit. The low-density gas is then driven up parallel to the shock fronts by the radiation force and regions near the bottom boundary are evacuated. The calculation ends due to low densities after 1.13 orbits when the horizontally-averaged radiation flux is 2.6 times greater than initially.
-
3.
In the case with pressure ratio 10%, field lines first bend significantly during the shock merger phase. Mergers end at 1.4 orbits with the front spacing equal to the domain width. The largest ram pressure in the domain is about equal to the magnetic pressure and the field is bent by up to 8 degrees. At 1.48 orbits the horizontally-averaged flux is 4.8 times the initial value. The field is lifted away from the lower boundary at one location by radiation forces, leaving behind very low densities so that timesteps are short and further calculation is impractical.
-
4.
In the strongest-field case, the field lines remain within 0.7 degrees of their initial orientation for the six-orbit duration of the run. The ram pressure of the gas is everywhere less than 5% of the magnetic pressure. From 1.6 orbits on, the horizontal distance between fronts is equal to the domain width and the shock pattern varies slowly due to the vertical gradient in the propagation speed. Overdense gas moving down field lines near the lower boundary rises again only with difficulty, because the vertical velocity is fixed at zero on the boundary. Material gradually accumulates near the bottom and the calculation is ended after the horizontally-averaged density at domain center falls below half the initial value.
In summary, photon bubbles lead to shock trains over the whole range of field strengths explored. The shock amplitude is limited by the growth of the overturning instability in the case with magnetic pressure less than gas pressure, by the strength of the magnetic field in the two intermediate cases and by the size of the domain in the calculation with the strongest fields.
7.5 Low Optical Depth
Photon bubbles saturate at low amplitudes in a calculation centered on the disk photosphere at . The square domain extends from 1.07 to and is filled with an initial condition generated using the density, temperature and flux at the photosphere in the full-disk-thickness calculations. The magnetic field is horizontal with pressure 10% of the midplane radiation pressure, and random 1% density perturbations are applied throughout the domain. The grid resolution is . Photon bubbles grow until gas moves back and forth along the field lines with velocity amplitude twice the isothermal gas sound speed and the photosphere is crossed by weak shocks. The speeds are greatest below the photosphere but the kinetic pressure is everywhere less than 1% of the magnetic pressure so that field lines remain almost straight. Eddington factors depart slightly from one-third in regions of low density near the photosphere and the results may depend on the angular variation of the radiation intensity. More detailed calculations in this regime may be useful to test the accuracy of the relationship between the radiation energy gradient and the anisotropy assumed in our flux-limited diffusion calculation. However the saturation at low amplitude is a product of the artificial lower boundary in the surface-layer calculation. In the case spanning the disk thickness shown in figure 1, the photosphere is disrupted after shock trains develop deeper in the disk.
7.6 Full Disk Thickness
In this section we explore the growth of shocks and the effects on cooling in the calculation with magnetic fields shown in figure 1. The calculation extends through the thickness of the disk from one photosphere to the other. Photon bubbles grow from initial 1% random density perturbations applied within of the midplane. The fastest linear mode between heights and has 14 wavelengths in the domain width and 5 in the height of the region and grows at . The fastest mode grows slower, has longer wavelength and propagates further from the horizontal than in the calculation described in section 6.5, due to the lower resolution here. Density disturbances exceed 10% after 0.18 orbits and the photon bubbles develop into trains of shocks. The shock fronts are curved because the wavevector of the fastest-growing linear mode varies with height, being more nearly parallel to the magnetic field in the disk interior. The relationship between flux and overdensity at is consistent with the improved analytic shock train solution until 0.48 orbits. The radiation force due to the increased flux then ejects the surface layers above . By 0.7 orbits 2% of the total mass is lost, while the flux increases above that expected from the analytic solution. Magnetic field lines are bent increasingly by the ram pressure of the gas, and near the strongest shocks depart more than from their initial orientation after 0.6 orbits. Fluxes locally exceed 21 times the initial photospheric flux in the low-density channels between the shocks at 0.8 orbits and the radiation force drives the fronts toward the vertical. A further 0.7% of the initial mass is ejected through the channels by 1.5 orbits, when the total radiation energy has fallen by 94% and the calculation is ended. The declining fluxes in the later stages are not sufficient to support the overdense gas in the surface layers and the dense material collapses toward the midplane.
The timestep in the calculation shown in figure 1 is 100 times the diffusion step determined by the lowest densities. The effects of the timestep are checked using a version with steps ten times shorter that is run for one orbit. Linear photon bubble growth rates are similar and the same fastest mode grows at . Owing to a more accurate rise in the radiation energy outside the photosphere in response to increased fluxes inside, a smaller fraction of the surface layers is ejected and the mass decreases by only 1.2% up to 0.7 orbits. The mean cooling rate between 0.7 and 1.0 orbits is slightly faster than in the calculation with longer timesteps, at 5.9 times the rate in the calculation with diffusion alone. Overall, the results depend little on the timestep. However the effects of the photon bubbles are underestimated in both calculations because the longest wavelength of rapid linear growth, , is marginally resolved in the surface layers. Faster linear growth at short wavelengths is indicated by the WKB analysis and measured in the higher-resolution calculation described in section 6.5.
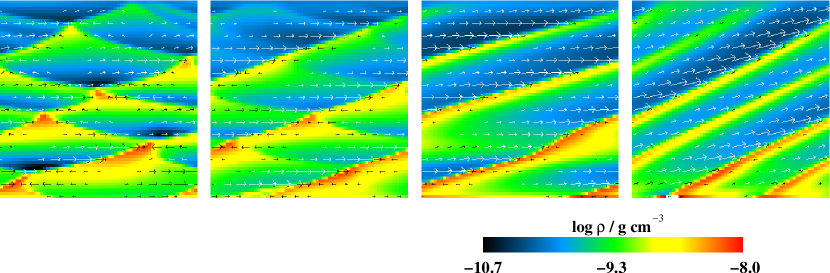
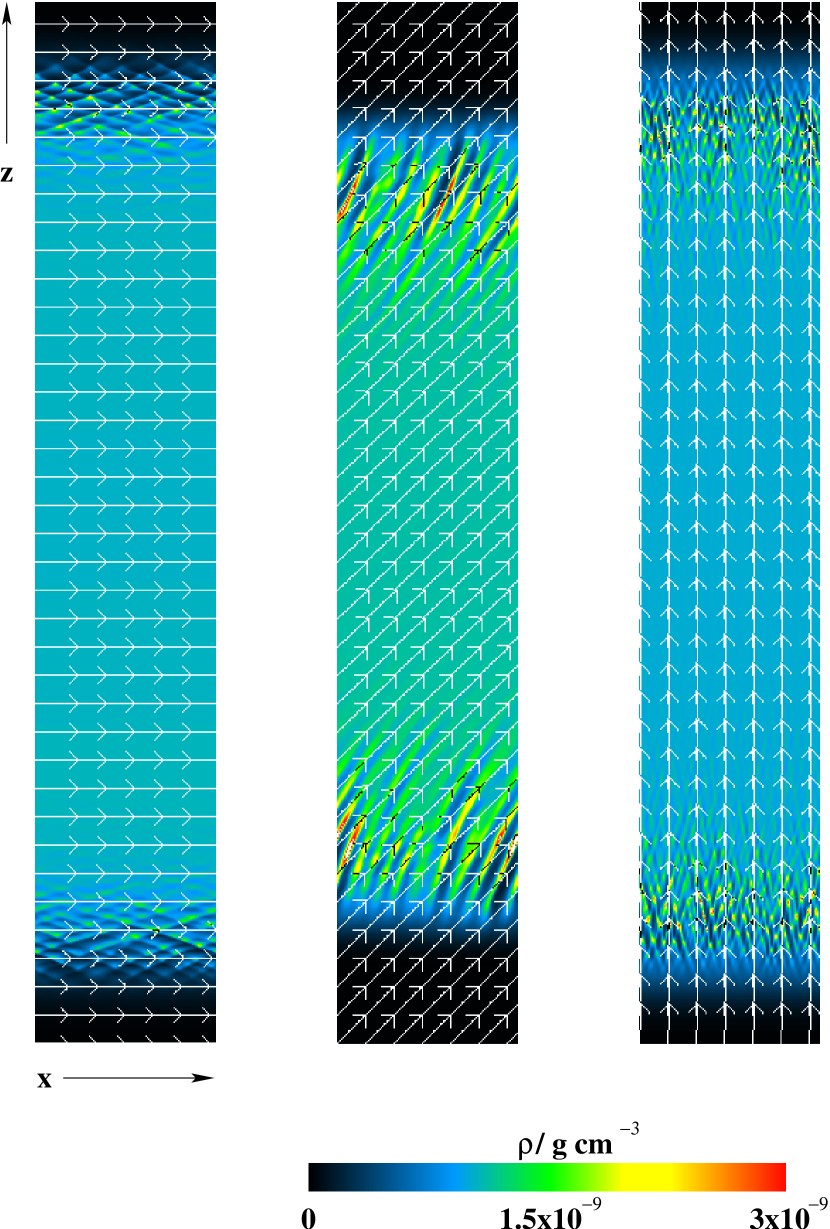
The dependence on the orientation of the magnetic field is examined with two additional calculations extending through the disk thickness. The only parameter differing from figure 1 is the initial inclination of the field. The field is horizontal in one case and inclined 45 degrees in the other. Results at the times when horizontal density variations first exceed a factor ten are shown in figure 21 with a corresponding view of the case from figure 1 having the field inclined 87 degrees. The times shown are 1.22, 0.72 and 0.33 orbits, respectively. As expected from the linear analysis, the development is fastest on near-vertical fields. The effects of the photon bubbles are also large in the case with the intermediate inclination, where modes with fronts tilted to the same side as the field grow much faster than those with fronts tilted the other way and long, unobstructed channels of low density are formed. The largest radiation flux is 30% greater than at the same density contrast in the case from figure 1. The shock spacing and amplitude and the gas speeds continue to grow until at 0.94 orbits the ram pressure exceeds the magnetic pressure at some locations and the field lines are bent. Gas collects near the inflection points in the field and slides down the field lines under its own weight, disrupting the shock pattern in the interior but leaving a regular train of fronts in the surface layers. The calculation is ended at 1.2 orbits. In the case with horizontal field, shock mergers by 1.5 orbits increase the horizontal spacing of the fronts to at height . The maximum fluxes at this time are twice the initial photospheric flux. The radiation force then drives off the outer layers where no perturbations were placed initially. By the end of the calculation at 1.8 orbits, 13% of the mass is lost through the top and bottom boundaries.
8 SUMMARY AND CONCLUSIONS
We study the cooling of radiation-pressure dominated accretion disks due to convection and the Shaviv type I and photon bubble instabilities, using 2-D and 3-D radiation-MHD calculations of small patches of disk. The background conditions are simplified by neglecting differential rotation, so the turbulence and heating resulting from MRI are absent. The initial states are chosen from a Shakura-Sunyaev model, but no effective viscosity is applied during the calculations. The cooling caused by the instabilities is compared against the 1-D vertical diffusion that is assumed in the Shakura-Sunyaev picture.
- 1.
-
2.
The Shaviv type I global instability is not observed in calculations extending through the disk thickness, but grows quickly in calculations with a closed lower boundary of fixed temperature. The wavelengths and fastest growth rates agree approximately with those in the linear analysis by Shaviv (2001) despite different assumptions about the background state. Disturbances reaching large amplitudes become narrow chimneys of rising low-density gas separated by denser, sinking material. The Shaviv type I instability is unlikely to have strong effects in radiation-dominated disks but may be important in radiation-supported atmospheres with distinct lower boundaries.
-
3.
Photon bubbles with wavelengths shorter than the gas pressure scale height grow faster than the orbital frequency when magnetic pressure exceeds gas pressure, in detailed agreement with a linear WKB analysis. Growth approaches the asymptotic rate expected from the linear analysis, when the field is nearly vertical. The disturbances develop into trains of propagating shocks similar to those predicted by Begelman (2001). The shocks grow in strength and increase in separation over time, while radiation escapes through the gaps between, cooling the flow in the case we considered five times faster than assumed in the Shakura-Sunyaev model.
Unlike convection, which is driven by an entropy gradient and can be absent if heating is concentrated in the surface layers, photon bubbles are driven by the radiation flux. The photon bubble shoulder wavenumber and the fastest growth rate at the disk surface are determined by the temperature and height of the photosphere. They are independent of the details of the internal structure and independent of the field strength, provided the magnetic pressure is greater than the gas pressure. Instability is present if the ratio of the flux to the radiation energy density exceeds approximately the isothermal gas sound speed in optically-thick regions having radiation and magnetic pressures greater than the gas pressure (Blaes & Socrates, 2003). Since the ratio of flux to energy density must approach at the photosphere and , the criterion for linear instability is likely to be satisfied in the outer layers.
A major issue to be resolved is the amplitudes reached by photon bubbles in turbulence driven by the MRI, where structures are destroyed on the eddy turnover timescale of about an orbit. Photon bubble growth rates depend on the orientation of the magnetic fields. The fields in MRI turbulence have a small mean vertical component in 3-D shearing-box MHD calculations of patches of accretion disk neglecting radiation diffusion (Brandenburg et al., 1995; Stone et al., 1996; Miller & Stone, 2000), and the median angle between magnetic field and midplane is in a calculation including diffusion (Turner, 2004). On fields with similar inclinations in the calculations described in section 6, photon bubbles grow faster than , corresponding to an increase in amplitude by a factor per orbit. The fastest modes in our numerical calculations grow on nearly vertical magnetic fields at , increasing in amplitude by a factor per orbit. Given time enough to grow, small disturbances develop into trains of shocks that increase in strength and wavelength until the magnetic fields buckle. The dependence of the linear growth rate on field angle could lead to effects varying in time and space according to the field structures found in the turbulence.
Fast photon bubble growth consistent with the asymptotic regime of the linear analysis is found only in calculations with grid spacing less than one-tenth the shoulder wavelength and timestep shorter than the diffusion step. Accurately following the growth of photon bubbles throughout the disk thickness for the parameters we chose required a grid of about a thousand zones in the vertical direction. The grid spacing needed in a Shakura-Sunyaev disk model is about , where is the gas pressure at the photosphere and is the radiation pressure at the midplane. Future advances in computer technology will enable the study of photon bubbles together with the MRI using 3-D radiation-MHD calculations on such grids.
The analytic and numerical results indicate that photon bubbles develop into regions of alternating high and low density much smaller than the disk thickness. Radiation escapes faster through the porous flow than through the hydrostatic structure of the same surface density and the resulting cooling may have fundamental effects on the overall thermal balance. Inhomogeneities within a few Thomson depths of the photosphere can modify the emitted thermal spectrum (Davis et al., 2004) and the reflected X-ray spectrum (Ballantyne et al., 2004) while sufficiently rapid cooling could lead to super-Eddington luminosities from geometrically thin accretion disks (Begelman, 2002).
Appendix A How the Photon Bubble Instability Works
As discussed at length in Blaes & Socrates (2003), there are two basic physical mechanisms for the radiative amplification of traveling acoustic waves. The first relies on an interaction between the background radiative flux and fluctuations in the flux mean (Rosseland) opacity in the wave, and exists even in the absence of magnetic fields. This mechanism is irrelevant for the conditions we consider in this paper, where the flux mean opacity is dominated by Thomson scattering, and is therefore constant. The second mechanism originates from a breakdown in cancellation of background radiation pressure, gas pressure, and gravitational forces on perturbed fluid elements. This can only occur for waves which are not purely longitudinal in character, which for acoustic waves requires a background magnetic field. It turns out that the force responsible for this second driving mechanism can be expressed entirely in terms of the flux perturbation that is perpendicular to the wave vector of the wave, and we show how to do this here. We used this fact in our illustration of the physical mechanism of the instability in figure 7.
The linearized equation of motion of a fluid element in a short wavelength magnetoacoustic wave may be written as (equations 74, 75, and 100 of Blaes & Socrates (2003))
| (A1) | |||||
Here ¸ is the Lagrangian displacement vector of the fluid element under consideration, is the wavevector of the wave and is its magnitude, is the angular frequency of the wave, is the Alfvén velocity, is the adiabatic sound speed in the gas, is the gas pressure, is the density, is the adiabatic index of the gas, is the radiation energy density, is the speed of light, is a characteristic angular frequency associated with true absorption opacity (equation 30 of Blaes & Socrates (2003)), is the acceleration due to gravity, is the logarithmic derivative of with respect to density, and is the logarithmic derivative of with respect to the gas temperature.
The first square bracket term on the right hand side of equation (A1) represents the magnetic pressure, magnetic tension, and gas pressure terms that provide the basic restoring forces that support the wave. Radiation pressure does not contribute here because of rapid photon diffusion at these short wavelengths. The three terms in curly braces represent the effects of Silk damping, damping of temperature differences between the gas and radiation due to absorption and emission, and damping (or driving) due to the interaction between the background radiative flux and opacity fluctuations in the wave.
The last term in square brackets on the right hand side of equation (A1) is the term of greatest interest here. It represents the possible unstable driving of magnetoacoustic waves due to the interplay of background radiation pressure gradient, gas pressure gradient, and gravitational forces. Using the equation of hydrostatic equilibrium in the background,
| (A2) |
Blaes & Socrates (2003) eliminated the gas pressure gradient to show that this driving term could be written as
| (A3) |
The last term, involving the gravitational acceleration, is perpendicular to the fluid displacement. It therefore does no work, and provides neither damping or driving. The first term involving the radiative flux represents a potential driving force based on an interaction between and density fluctuations in the wave. The second term involving is a driving force arising from a change in the background radiation pressure along a fluid displacement. The sum of these two terms is proportional to the gradient of the Lagrangian change in radiation pressure (Blaes & Socrates, 2003), and it is important to note that they cancel precisely for any longitudinal wave. Because magnetoacoustic waves need not be longitudinal, such waves can be driven unstable by these terms.
It turns out that it is also possible to write these driving terms in another way that is also physically intuitive. If we use hydrostatic equilibrium to eliminate rather than the gas pressure gradient, then
| (A4) |
Once again, the second term on the right hand side is perpendicular to the fluid displacements, and does no work. In the first term,
| (A5) |
is the component of the flux perturbation that is perpendicular to the wave vector , ignoring opacity fluctuations in the wave. Physically, a compressive plane wave will naturally produce positive (negative) flux perturbations through the rarefied (compressed) regions due to the increased (decreased) transparency of the medium (figure 7). Because surfaces of constant density in the wave follow surfaces of constant phase, these flux perturbations will be perpendicular to the wave vector. In a wave that is not purely longitudinal, these flux perturbations will have nonvanishing projections onto the fluid velocity in the wave, and can therefore cause damping or driving of the wave.
The discussion so far was for the case where the gas and radiation temperatures in the medium are allowed to depart from exact equality. In all the calculations shown in this paper, photon absorption and emission are so fast that the two temperatures are generally locked together. In this case, the equation of motion of a perturbed fluid element is (equations 82, 84, and 106 of Blaes & Socrates (2003))
| (A6) | |||||
Here the adiabatic sound speed in the gas in the first square brackets term on the right hand side has been replaced by the isothermal sound speed , because gas temperature fluctuations in the wave are smoothed out by the rapid radiative diffusion. Similarly, only density-induced opacity fluctuations are relevant in the damping/driving term in the term in braces.
Once again, it is the last square bracket term that is most relevant here. Hydrostatic equilibrium and radiative diffusion in the background implies
| (A7) |
Using this to eliminate the acceleration due to gravity, we find
| (A8) | |||||
Once again, the last term involving the density gradient does no work. In the absence of opacity fluctuations, the driving can be seen to be due entirely to the component of the flux perturbation that is perpendicular to the wave vector.
References
- Agol & Krolik (1998) Agol, E. & Krolik, J. 1998, ApJ, 507, 304
- Agol et al. (2001) Agol, E., Krolik, J., Turner N. J., & Stone, J. M. 2001, ApJ, 558, 543
- Arons (1992) Arons, J. 1992 ApJ, 388, 561
- Balbus & Hawley (1991) Balbus, S. A., & Hawley, J. F. 1991, ApJ, 376, 214
- Balbus & Hawley (1998) Balbus, S. A., & Hawley, J. F. 1998, Rev. Mod. Phys. 70, 1
- Ballantyne et al. (2004) Ballantyne D. R., Turner N. J. & Blaes O. M. 2004, ApJ, 603, 436
- Begelman (2001) Begelman, M. C. 2001, ApJ, 551, 897
- Begelman (2002) Begelman, M. C. 2002, ApJ, 568, L97
- Bisnovatyi-Kogan & Blinnikov (1977) Bisnovatyi-Kogan, G. S., & Blinnikov, S. I. 1977, A&A, 59, 111
- Blaes & Socrates (2001) Blaes, O. M., & Socrates, A. 2001, ApJ, 553, 987
- Blaes & Socrates (2003) Blaes, O. M., & Socrates, A. 2003, ApJ, 596, 509
- Brandenburg et al. (1995) Brandenburg, A., Nordlund, Å., Stein, R. F., & Torkelsson, U. 1995, ApJ, 446, 741
- Davis et al. (2004) Davis, S., Blaes, O., Turner, N., & Socrates, A. 2004, in ASP Conf. Ser. 311, AGN Physics with the Sloan Digital Sky Survey, ed. G. T. Richards & P. B. Hall (San Francisco: ASP), 135
- Gammie (1998) Gammie, C. 1998, MNRAS, 297, 929
- Hsu, Arons, & Klein (1997) Hsu, J. J., Arons, J., & Klein, R. 1997, ApJ, 478, 663
- Levermore & Pomraning (1981) Levermore C. D., & Pomraning G. C. 1981, ApJ, 248, 321
- Lightman & Eardley (1974) Lightman, A. P., & Eardley, D. M. 1974, ApJ, 187, L1
- Mihalas & Mihalas (1984) Mihalas, D., & Mihalas, B. W. 1984, Foundations of Radiation Hydrodynamics (Oxford: Oxford Univ. Press)
- Miller & Stone (2000) Miller, K. A., & Stone, J. M. 2000, ApJ, 534, 398
- Pietrini & Krolik (2000) Pietrini, P. & Krolik J. H. 2000, ApJ, 539, 216
- Piran (1978) Piran, T. 1978, ApJ, 221, 652
- Sakimoto & Coroniti (1989) Sakimoto, P. J., & Coroniti, F. V. 1989, ApJ, 342, 49
- Shaviv (2001) Shaviv, N. J. 2001, ApJ, 549, 1093
- Shakura & Sunyaev (1973) Shakura, N. I., & Sunyaev, R. A. 1973, A&A, 24, 337
- Shakura & Sunyaev (1976) Shakura, N. I., & Sunyaev, R. A. 1976, MNRAS, 175, 613
- Stella & Rosner (1984) Stella, L., & Rosner, R. 1984, ApJ, 277, 312
- Stone et al. (1996) Stone, J. M., Hawley, J. F., Gammie, C. F., & Balbus, S. A. 1996, ApJ, 463, 656
- Stone & Norman (1992a) Stone, J. M., & Norman, M. L. 1992a, ApJS, 80, 753
- Stone & Norman (1992b) Stone, J. M., & Norman, M. L. 1992b, ApJS, 80, 791
- Stone, Mihalas, & Norman (1992) Stone, J. M., Mihalas, D., & Norman, M. L. 1992, ApJS, 80, 819
- Svensson & Zdziarski (1994) Svensson, R., & Zdziarski, A. A. 1994, ApJ, 436, 599
- Turner & Stone (2001) Turner, N. J., & Stone, J. M. 2001, ApJS, 135, 95
- Turner et al. (2003) Turner, N. J., Stone, J. M., Krolik, J. H., & Sano, T. 2003, ApJ, 593, 992
- Turner (2004) Turner, N. J. 2004, ApJ, 605, L45