Dynamical Evolution of Barred Galaxies
Abstract
Angular momentum redistribution within barred galaxies drives their dynamical evolution. Angular momentum is emitted mainly by near-resonant material in the bar region and absorbed by resonant material mainly in the outer disc and in the halo. This exchange determines the strength of the bar, the decrease of its pattern speed, as well as its morphology. If the galaxy has also a gaseous component and/or a companion or satellite, then these also take part in the angular momentum exchange. During the evolution a bar structure forms in the inner parts of the halo as well. This bar is shorter and fatter than the disc bar and stays so all through the simulation, although its length grows considerably with time. Viewed edge-on, the bar in the disc component acquires a boxy or peanut shape. I describe the families of periodic orbits that explain such structures and review the observations showing that boxy/peanut ‘bulges’ are in fact just bars seen edge-on.
keywords:
barred galaxies, dynamical evolution, halo, peanuts, bulgesguessConjecture {article} {opening}
1 Introduction
Bars are very common features in disc galaxies. Eskridge et al. Eskridge et al. (2000), using a statistically well-defined sample of 186 disc galaxies from the Ohio State University Bright Spiral Galaxy Survey, find that 56% are strongly barred in the H band, while another 16% are weakly barred. Grosbøl et al. Grosbøl et al. (2002), using a smaller sample of 53 spirals observed in the K band, find that about 75% of them have bars or ovals. These bars can have very different morphologies, from short to long, and from fat to thin, or from rectangular-like to elliptical-like. Thus we need to explain not only their formation, but also the distribution of their parameters and their different morphologies.
The spontaneous formation of bars in galactic discs was already shown in -body simulations of the early seventies (e.g. Miller et al. 1970, Hohl 1971). At that time, the observational evidence for the existence of dark haloes around individual galaxies was hardly compelling, so the discs in these simulations were self-gravitating. Only a few years later haloes were propelled into the center of scientific discussions. Ostriker and Peebles Ostriker and Peebles (1973) were the first to check the effect of a heavy halo on the bar instability and found it to be stabilising. Although the number of particles in their simulations did not exceed 500, their work is very insightful. They introduced the parameter , which is the ratio of kinetic energy of rotation to total gravitational energy. They concluded that halo-to-disc mass ratios of 1 to 2.5 and an initial value of are required for stability. Several later papers (e.g. Athanassoula and Sellwood 1986) confirmed the stabilising tendency of the halo. Yet, as we will see in the next section, this is an artifact, due to the fact that these simulations were either 2D, or had a rigid halo, or had too few particles. Thus the halo was not properly described. Before I discuss the effect of a properly described halo, let me first describe briefly a temporal sequence in the bar formation and evolution process.
Most -body simulations start with a thin axisymmetric disc immersed in a more or less massive halo. The initial density and velocity distributions are chosen so as to be in agreement with observations of nearby spirals. Of course such initial conditions are idealised and may not hold for real galaxies, where the bar could well form at the same time as the disc. Yet, following the disc and bar formation ab initio, in a cosmological scenario, is a still largely unsolved problem, since it requires knowledge of the initial conditions of the mass distribution right after the formation of a disc galaxy. Furthermore, using present day initial conditions makes it possible to study best the angular momentum exchange and to make comparisons with analytical calculations. Nevertheless, problems like bar formation in a growing disc, non-spherical and/or clumpy haloes and the effect of infalling small satellites and debris need to be soon addressed.
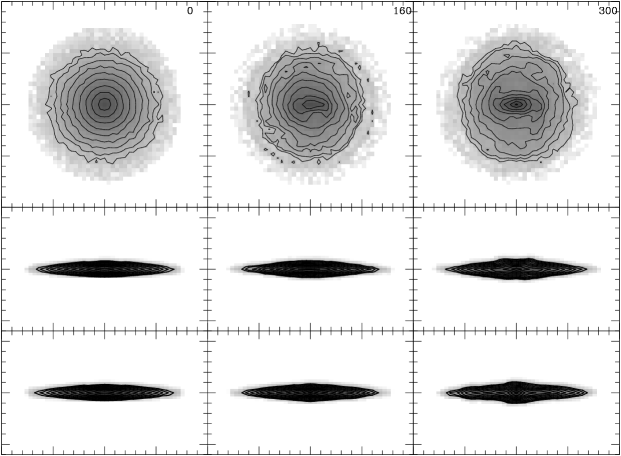
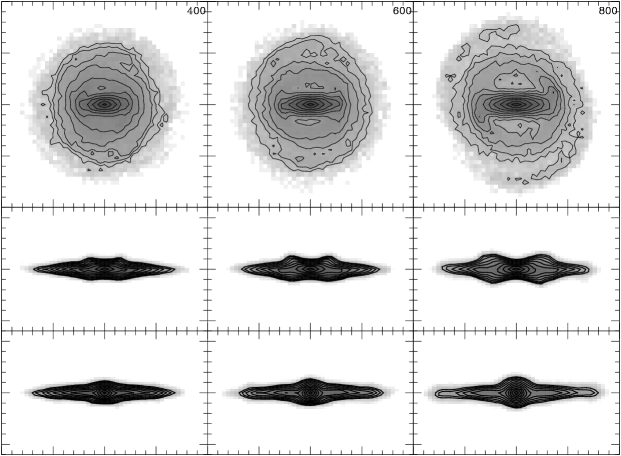
Bar formation in such idealised initial conditions is illustrated in Fig. 1, which gives the face-on, the side-on and the edge-on views of the disc component at various times. I call side-on the edge-on view where the line-of-sight is along the bar minor axis, while the end-on view is also edge-on but with the line-of-sight along the bar major axis. At the beginning the disc starts axisymmetric, but soon forms spirals (not shown here), whose multiplicity depends on the disc-to-halo mass ratio within the outer disc radius. The actual bar formation time also depends on the relative importance of the halo component, being shorter in simulations whose inner parts are more disc dominated. In the second of the times illustrated the bar is still short and rather asymmetric. With time, it grows more symmetric, but also longer, i.e. stronger. At the last time shown, a ring structure encircles the bar. It is somewhat elongated, but not far from circular, as inner rings observed in barred galaxies Buta (1986). In all simulations the bar is direct, i.e. rotates in the same sense as the particles in the disc, and stops within corotation, in good agreement with periodic orbit calculations Contopoulos (1980).
Viewed edge-on, the disc shows also clear evolution. During the first stages of its formation, the bar stays thin, but thickens shortly thereafter. Its vertical extent increases as the bar strength increases. Initially its shape is boxy and then gradually evolves to peanut-like. Seen end-on the bar looks round, reminiscent of a bulge in the central part of a disc. Seen this way also, the bar size increases as it strengthens in the face-on view.
2 Angular momentum exchange
In a ground-braking paper, Lynden-Bell and Kalnajs Lynden-Bell and Kalnajs (1972) discuss the transport of angular momentum within discs of spiral galaxies. Using a full analytical treatment, as well as a simple but insightful individual orbit approach, they show that disc stars at inner Lindblad resonance (hereafter ILR) emit angular momentum, while disc stars at corotation (hereafter CR) and outer Lindblad resonance (hereafter OLR) absorb it, so that angular momentum is transported outwards. If the spiral amplitude is growing, material which is not at near-resonance can also emit, or absorb, angular momentum.
Athanassoula Athanassoula (2003a) extended the work of Lynden-Bell and Kalnajs to include a spheroidal component. If the distribution function of this component depends only on the energy, then all halo resonances will absorb angular momentum. Thus the picture of Lynden-Bell and Kalnajs can be generalised as follows : Angular momentum is emitted from material at near-resonance in the bar region (ILR and other such resonances within CR, e.g. 1:4; see Appendix for the notation) and absorbed by material at resonance in the outer disc and in the halo. Colder material can emit/absorb more angular momentum that hotter one. Thus the halo is less responsive than the disc per equal amount of resonant mass. However, there is not much material in the outer disc, where the density is very low, while the halo can be very massive. It can thus be that the halo absorbs more angular momentum than the outer disc, and this has proven to be the case in many -body simulations, as will be discussed in the next section. Since the bar is a negative angular momentum ‘perturbation’ (Kalnajs 1971, Lynden-Bell and Kalnajs 1972), by losing angular momentum it becomes stronger.
Tremaine and Weinberg Tremaine and Weinberg (1984) investigated dynamical friction on a solid bar rotating in a spherical halo and found that this arises from halo stars which are near-resonant with the rotating bar. They derived an analogue of Chandrasekhar’s formula Chandrasekhar (1943) for spherical systems, valid when the angular velocity of the bar does not change too slowly. Weinberg Weinberg (1985) calculated that this will cause a considerable slow-down of the bar within a few bar rotations. As we will see in the next section, -body simulations also present such a slow down (e.g. Little and Carlberg 1991a, Little and Carlberg 1991b, Hernquist and Weinberg 1992, Athanassoula 1996, Debattista and Sellwood 2000, Valenzuela and Klypin 2003), but considerably less than that predicted by Weinberg Weinberg (1985). Weinberg Weinberg (2004) stressed that the derivation of the formulae of Lynden-Bell and Kalnajs assumes that the perturbations grow slowly over a very long time and that transients can be ignored. Their quantitative results should thus not be relied upon, since these assumptions may not hold in real galaxies. This, however, does not affect any of the results reviewed in this section, since they do not rely on any quantitative use of the Lynden-Bell and Kalnajs formalism.
3 Results from -body simulations

Contrary to real galaxies, -body simulations are well suited for studying the angular momentum exchange within a galaxy. This has been one of the main goals of \inlineciteAth02 and \inlineciteAth03 and I will retrace here a number of the steps made in those papers.
The first point to check is that there is a considerable amount of near-resonant material in the halo component. This is shown in the upper panels of Fig. 2, where I plot the mass per unit frequency ratio, , as a function of the frequency ratio (see appendix for the notation). It is clear that the distribution is not uniform, and has peaks at the resonances. In all simulations, the disc has a strong peak at ILR, which is made of particles trapped around this resonance and constituting the backbone of the bar. Secondary peaks can be found at other resonances, as e.g. inner 1:3, inner 1:4, CR or OLR, whose existence and height varies from one simulation to another. More important, the halo component also shows similar peaks. The highest is at CR, while secondary peaks can be seen at ILR and OLR. Such peaks can be seen in all simulations I analysed, again with varying heights.
The bottom panels of Fig. 2 show the way the angular momentum is exchanged. For the disc component it is emitted from the region within the bar, and particularly the ILR, and absorbed at CR (and in some simulations also at OLR). However, the amount of angular momentum emitted is much more than what the outer disc absorbs. This is understood with the help of the bottom right panel, which shows that all the halo resonances absorb a considerable amount of angular momentum, much more so than the outer disc. Thus simulations confirm the angular momentum exchange mechanism suggested by the analytical work, and show that the halo can be an important agent in this respect.

The global redistribution of angular momentum is seen in Fig. 3. This shows that the disc component loses a considerable amount of angular momentum which is taken by the halo. The amount of course varies from one simulation to another and depends on the parameters of the disc and the halo. Such a redistribution was also seen by \inlineciteDebSel and by \inlineciteVK.
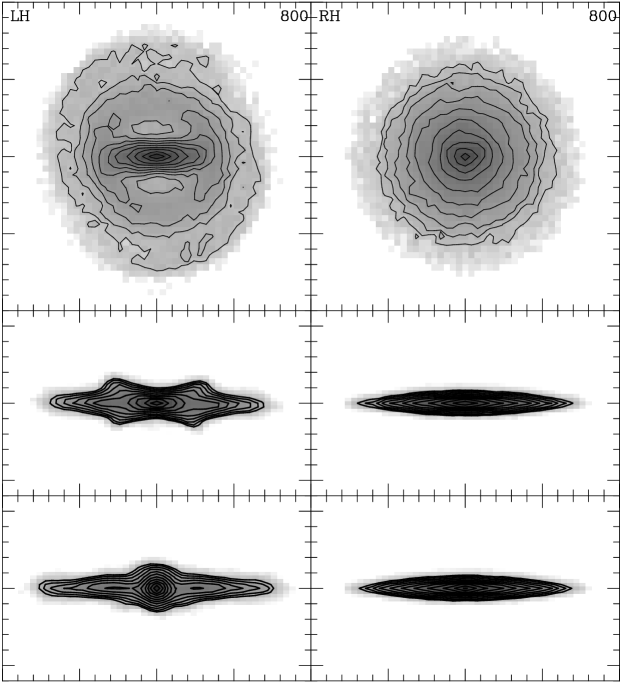
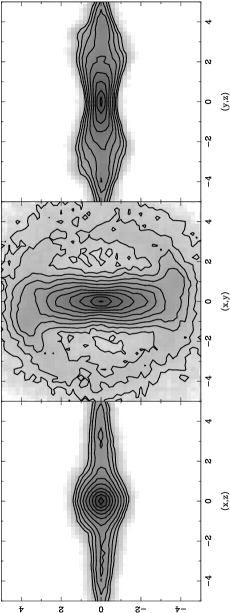
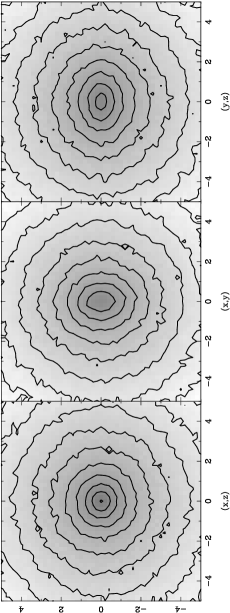
Fig. 4 shows that the angular momentum redistribution can be very important for the bar evolution. It compares two simulations with initially identical disc components and with haloes having initially identical mass distributions. In the simulation in the left panels the halo is live (LH), i.e. it is composed of particles. In the simulation in the right panels, however, the halo is rigid (RH), i.e. it is an imposed potential. Thus in LH the halo can absorb angular momentum, while in RH it can not. The difference in the evolution is very striking. Simulation LH grows a very strong bar, which, when seen side-on, has a strong peanut shape. Simulation RH, on the contrary, has a very mild oval in the innermost regions, and hardly evolves when seen edge-on. The large difference between the results of the two simulations argues strongly that the angular momentum absorbed by the halo can be a decisive factor in the evolution of the bar component.
Theoretical arguments predict that the angular momentum emitted or absorbed at a given resonance depends not only on the density of matter there, but also on how cold the near-resonant material is. This is borne out by the simulations. Indeed, if the disc is hot (i.e. has a high initial ) and/or the halo is very hot, then the bar does not grow to be very strong and does not slow down much. Examples of this are given by \inlineciteAth03.

In fact, it is the angular momentum redistribution that determines the strength and the slowdown rate of the bar. This can be seen in Fig. 5, which includes results (i.e. strength and pattern speed of the bar and angular momentum absorbed by the halo) from a very large number of simulations, all with the same disc and halo masses and the same initial disc scale-length. The upper right panel shows that there is a clear correlation between the strength of the bar and the angular momentum absorbed by the halo component. The upper middle panel shows the corresponding relation, now for the bar pattern speed. Let me now split the sample in two, one including simulations with haloes which have considerable mass in the regions of the main resonances, and one in which the halo mass is mainly in the parts outside the main resonances. In simulations in the first sample (middle row of panels), it is the halo that absorbs most of the angular momentum emitted by the bar region. A correlation between the pattern speed of the bar and the amount of angular momentum in the halo is thus expected, and is indeed found. In simulations in the second sample the disc plays a more important role in the angular momentum exchange, and only a weak trend with the angular momentum absorbed by the halo is expected, and this is indeed borne out by the simulations.
Such correlations are expected for all types of disc and spheroid models. The location of the regression line and of the individual points on the relevant planes – e.g. the (Lz,s/Lz,d, SB) plane, where Lz,s the amount of angular momentum absorbed by the spheroid, Lz,d the initial disc angular momentum, and SB the bar strength – may well change with the model used.
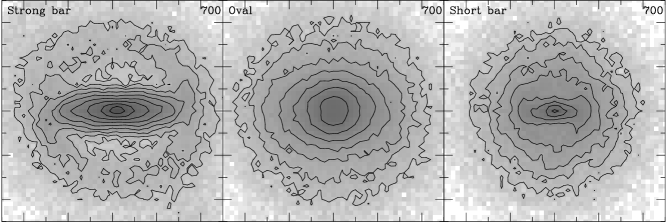
The angular momentum exchange also determines the morphology of the bar. In all simulations where a considerable amount of angular momentum is redistributed, the bar is strong, as the example given in the left panel of Fig. 6. Such bars are long and have rectangular-like isodensities (Athanassoula and Misiriotis, 2002). They are often surrounded by a ring, whose location and shape is like those of the inner ring in real galaxies. The properties of such simulated bars are similar to those of strong bars in early type disc galaxies Athanassoula (2003b). This can be easily explained, since such galaxies have big bulges. These components are spheroids similar to the halo, and seen their extent, they will have near-resonant material which will absorb angular momentum, thus helping the bar become yet stronger than it would in their absence.
Simulations in which little angular momentum has been exchanged do not form strong bars. Schematically, their morphology can be either that of an oval (middle panel of Fig. 6), or that of a short bar (right panel). Ovals are found predominantly in simulations with hot discs. Since in such cases it is the halo that absorbs most of the angular momentum, the bar can extend relatively far out in the disc to maximise the extent and therefore the contribution of the emitting region. Short bars are found predominantly in simulations with very hot, non-responsive haloes. Then the angular momentum absorbed by the outer disc is a considerable fraction of the total amount exchanged, and thus bars have to stay short in order to leave sufficient mass in the outer disc regions to do the absorption. Thus simulations can reproduce well the morphologies of observed bars and the wide range of bar strengths observed.
In \inlineciteAth03 only the disc and halo (and sometimes bulge) components are taken into account. Yet the complete picture of angular momentum exchange can be more complicated. Galaxies (particularly late types) have also a gaseous disc component. This may give angular momentum to the bar, and thus decrease its strength Berentzen et al. (2004). Furthermore, galaxies are not isolated universes, and thus can interact with their companions, or satellites. If the latter absorb angular momentum, then the bar can grow stronger than in the isolated disc Berentzen et al. (2004). This is in good agreement with observational results that show that more bars can be found in interacting than in isolated galaxies Elmegreen et al. (1990).
4 A bar in the halo component
Since the halo is not rigid, it evolves dynamically together with the disc. In simulations in which a considerable amount of angular momentum has been exchanged and which have thus formed a strong bar, the halo does not stay axisymmetric. It also forms a bar, or more precisely an oval, which I will call, for brevity, the halo bar. An example is seen in Fig. 7, which compares the morphology of the disc bar (upper panels) to that of the halo bar (lower panels). A very clear case of such a structure is also seen in Fig. 2 of \inlineciteHBKW.
Halo bars are triaxial, but nearer to prolate than to oblate, with their minor axis perpendicular to the disc equatorial plane. The axial ratio in this plane (ratio of minor to major axis) increases with increasing radius, so that halo bars tend to become axisymmetric in the outer parts. They are always considerably fatter than the corresponding disc bar, and thus nearer to ovals. Since the change in axial ratio is very gradual, it is not easy to define precisely the end of the halo bar, and thus to calculate its length. It is clear, however, that it is always considerably shorter than the disc bar. The length of the halo bar as a function of time for a simulation with a strong disc bar is given in Fig. 8. The spread in the measurements reflects the difficulty of defining precisely the end of the halo bar. Yet a least square fit shows clearly that the length of the halo bar increases with time. The slope of the dashed line gives the rate of increase of the disc bar length, and thus shows that the length of the halo bar increases less fast than that of the disc bar. The halo bar has roughly the same orientation as the disc bar at all times. In good agreement with \inlineciteHBKW, I find that the m=2 component of the halo continues also outside the halo bar, trailing behind the disc bar. More information on the halo bar properties, their relation with the disc bar properties, and the changes in the halo orbital structure as a result of the halo bar formation will be given elsewhere Athanassoula (2004b).

5 The formation of boxy/peanut features
-body simulations show that bars form initially in the disc equatorial plane. Very shortly thereafter, however, they buckle out of this plane, creating initially an asymmetric structure which soon evolves into a symmetric peanut (Combes and Sanders 1981, Combes et al. 1990, Raha et al. 1991, Athanassoula and Misiriotis 2002, Athanassoula 2003a, O’Neill and Dubinski 2003, Athanassoula 2004a) The formation of such a structure is easily understood in the framework of orbital structure in 3D barred galaxy potentials. Such a study was initiated by \inlineciteP84, who showed that there are several families of 3D orbits, bifurcated at the vertical resonances of the main planar family. This work was supplemented and extended in a series of four papers (Skokos et al. 2002a, 2002b, Patsis et al. 2002, 2003, also \opencitePuebla). I will briefly recall here the main results of these papers that are relevant to the formation of the peanut structure. I will also follow their notation.
2D orbital structure studies clearly established that it is the stable members of the x1 family of periodic orbits (i.e. the orbits that are elongated along the bar and close after one rotation and two radial oscillations) that constitute the backbone of the bar (Contopoulos and Papayannopoulos 1980, Athanassoula et al. 1983, etc.). Such periodic orbits trap around them regular, non-periodic orbits and, due to their appropriate size, shape and orientation, form the bar.
3D orbital studies, however, showed that the situation is much more complicated. The backbone of 3D bars is the x1 tree, i.e. the x1 family plus a tree of 2D and 3D families bifurcating from it (Skokos et al. 2002a, Skokos et al. 2002b). Trapping around these families will determine the extent and shape of the bar in the face-on view, as well as the edge-on extent and shape. However, it need not be the same family that determines both. The radial extent and outer outline in the face-on view is usually determined by the x1 family and/or 2D rectangular-like orbits at the planar 4:1 resonance region. On the other hand, the length of the peanut is determined by the extent of the 3D family that constitutes its backbone, e.g. the x1v1, or the x1v4 family (see Skokos et al. 2002a for more information on these families and their properties). This means that the length of the peanut must be somewhat shorter than that of the bar seen face-on, the exact ratio depending on which family(ies) contitute(s) the backbone of the peanut. It is important to note that the (x,y) projection of the members of the families of the x1 tree has, in general, an outline which is very similar to that of the members of the x1 family (2D orbits) at the same energy. This means that the difference between the two stands out in the edge-on view, but can be seen only little in the face-on view.
The vertical family which bifurcates from the x1 at the lowest energy – x1v1 in the notation of \inlineciteSPA02a – is particularly useful for building boxy or peanut-like features if it does not have a sizeable complex unstable part. If this family is the backbone of the peanut, then this feature is considerably shorter than the bar, the ratio of the two being less than 0.5 in the models of \inlinecitePSA02. On the other hand, if the backbone is a family which bifurcates at higher energies, then the peanut/bar ratio is considerably larger. E.g. if the backbone is the x1v4 family, then the ratio is of order of 0.8. In this case the vertical extension of the peanut or boxy feature is also considerably less. If more than one vertical family contributes significantly to the peanut, it is generally the one which bifurcates at the lowest energy that plays the main role morphologically. Finally, it is worth mentioning that 3D families which bifurcate from the x2 family (i.e. from the planar family which is elongated perpendicular to the bar) can also support boxy morphologies. This can influence the morphology of bars seen end-on.
Such boxy or peanut structures, when seen in real galaxies, are called by observers “boxy or peanut bulges”. This is due to the fact that, according to the simple morphological definition, a bulge is a smooth light distribution that swells out of the central part of the disc seen edge-on; a definition that is well fulfilled by boxy/peanut structures. However, bulges are not a homogeneous class of objects. As discussed by \inlineciteAth04a, they include classical bulges, boxy/peanut features, and disc-like bulges. Classical bulges have spheroidal shapes, a maximum thickness (seen edge-on) at the center of the galaxy, and a projected light, or surface density, profile close to the r law. They presumably form from hierarchical merging and/or collapse. On the other hand, boxy/peanut features are just part of the bar. In fact, as already discussed, they are the part that is composed of the vertically extending orbits from 3D families which bifurcate from the x1 family. Finally, disc-like bulges are central disc-like objects formed from gaseous material pushed inwards by torques due to bars, or perhaps other non-axisymmetric features, which later formed stars. This last class of objects has been mainly defined with the help of radial photometric profiles, i.e. they are excess light in the central part of disc galaxies, above the simple exponential profile fitting the remaining, non-central part of the disc.
Ath04a presented a number of comparisons of observed properties of boxy/peanut features with those of edge-on bars and found excellent agreement. I will here discuss two such comparisons, namely the comparison of the features in median filtered images, and the features in the emission line and absorption line position – velocity diagrams, and refer the reader to \inlineciteAth04a for others.
5.1 Median filtering
A comparison of images of real galaxies and of simulated ones after comparable median filtering is much more demanding than a comparison of the corresponding global morphologies. This is due to the fact that median filtering reveals a number of features, whose position and form have to be matched at a given scale.
Aronica et al. (2003, 2004) have performed median filtering of near-infrared images of a sample of edge-on boxy and peanut galaxies and found a number of interesting features. In many cases (e.g. Fig. 2a in \openciteAron03) one can note four extensions out of the equatorial plane, which form an X-like shape, except that the four extensions do not necessarily cross the center. Another common feature is maxima of the density along the equatorial plane, away from the center and diametrically opposite. Namely, starting from the center of the galaxy and going outwards along the equatorial plane, the projected surface density first drops and then increases again to reach a local maximum. It then decreases to the edge of the disc.
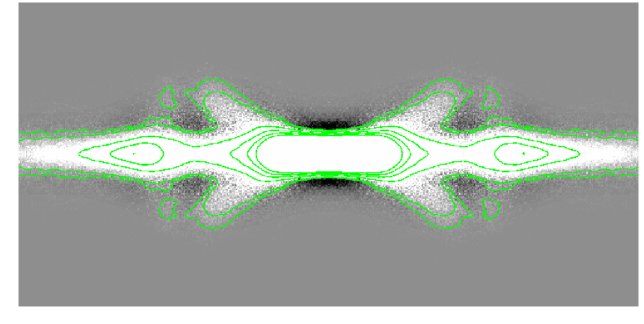
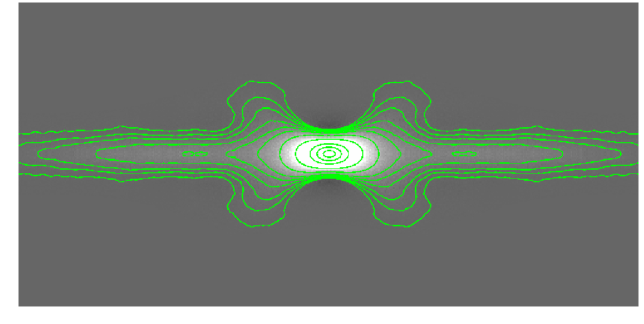
In order to compare the simulations to the observations, I applied to the former a similar analysis, using the same software. The full procedure is described in \inlineciteAth04a. The results for two different viewing angles are shown in Fig. 9 for a simulation with a strong bar. The similarity between the features in the median filtered observations and simulations is very striking.
In the upper panel of Fig. 9 the disc is viewed edge-on, with the bar side-on. It displays a clear X-like form, and secondary maxima on the equatorial plane on either side of the center, in good agreement with median filtered images of observed galaxies with peanuts. It further shows two very faint features, like parentheses enclosing the X. The lower panel of Fig. 9 shows the same simulation but from a viewing angle of . Viewed side-on, the four branches of the X do not cross the center. This is probably still true, but less easy to see, when the viewing angle is . Furthermore, the outermost isodensity contours joining the two upper (or lower) branches of the X look curved. This can also be seen in a number of the median filtered galaxy images in \inlineciteAron04, which might mean that these galaxies are seen from a viewing angle around . Finally, the secondary maxima along the equatorial plane can be seen from both viewing angles (as well as from an end-on view not shown here), but are most prominent in the side-on view. All these features were seen in the median filtered images of the galaxies in \inlineciteAron04. They are not accidental; they correspond to specific structures of the periodic orbits that constitute the backbone of barred galaxies Patsis et al. (2002). A more thorough comparison of the observations, the simulations and the periodic orbit structure will be given elsewhere (see also \openciteAron04).
5.2 PVD diagrams
Emission line spectroscopy of boxy/peanut galaxies (Kuijken and Merrifield 1995, Merrifield and Kuijken 1999, Bureau and Freeman 1999) showed that their major axis position velocity diagrams (hereafter PVDs) show a number of interesting features which were first linked to bars by Kuijken and Merrifield. \inlineciteBA99 used periodic orbits in a standard barred galaxy potential as a first step in understanding such features. Although this approach is too crude to reproduce, even roughly, observed PVDs, it can still give useful insight. For example. it showed that the superposition of the main periodic orbit families leads to gaps between the signatures of the different orbit families, as well as to material in the so-called forbidden quadrants. To actually model emission line PVDs, \inlineciteAB99 used the gas flow simulations of \inlineciteAth92 viewed edge-on. They found that shocks along the leading edges of the bar and the corresponding inflow lead to a characteristic gap in the PVDs, between the signature of the nuclear spiral (whenever existent) and the signature of the disc. There is in general very good agreement between the signatures of the observed emission line PVDs and those obtained by hydrodynamic models.
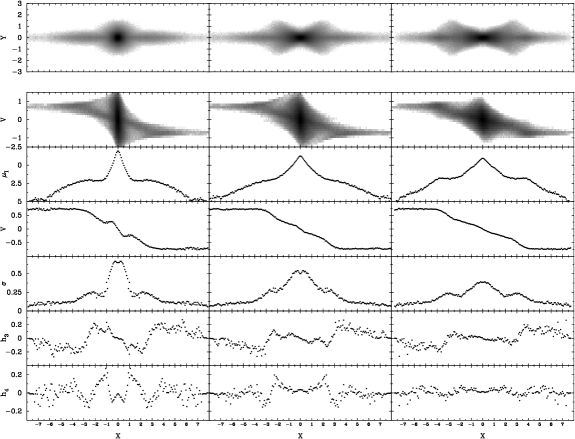
CB04 presented long-slit absorption line kinematic observations of 30 edge-on disc galaxies, most of which have a boxy structure or a peanut. They analysed the corresponding PVDs using Gauss-Hermite series and produced profiles of the integrated light along the slit, the mean stellar velocity , the velocity dispersion , as well as the higher order components and . \inlineciteBA04 ‘observed’ many -body bars seen edge-on, using for their analysis exactly the same techniques and, whenever possible, also the same software. It is thus both straightforward and meaningful to make comparisons of the results of the two studies.
The similarities are striking. Both studies find the same characteristic signatures, one in the observations and the other in the simulations. Fig. 10 gives the results for an -body simulation with a strong bar. The integrated light along the slit (equivalent to a major-axis light profile) has a quasi-exponential central component and a plateau at intermediate radii, followed by a steep drop. The rotation curve shows a double hump. The velocity dispersion has a central peak, which in the center-most part may be rather flat or may even have a central minimum. At intermediate radii there can be a plateau which sometimes ends on either side with a shallow maximum before dropping steeply at larger radii. In fact, these features can already be seen in Figure 13 of \inlineciteAM02, although the display adopted in that paper makes it more difficult to compare directly to observations. Fig. 10 also shows that correlates with over most of the bar length, contrary to what is expected for a fast rotating disc. All these features are spatially correlated and are seen, more or less strongly, both in the observations and in the simulations. The -body simulations show clearly that the strength of these features depends on the strength of the bar as well as on its viewing angle. Furthermore, those features can be interpreted with the help of the orbital structure in barred discs Bureau and Athanassoula (1999).
The only observed feature not found by \inlineciteBA04 is the anti-correlation of and in the center-most parts. Indeed, the observations show that, in a small region very near the center, the and curves anti-correlate in many cases, while for the remaining bar region they correlate. On the hand, in the simulations shown by \inlineciteBA04 the and curves always correlate all the way to the center. This small discrepancy can be remedied in two ways, presented and discussed elsewhere (Athanassoula, in preparation). The first relies on the existence of a gaseous inner disc, present in the galaxies but not in the simulations discussed by \inlineciteBA04, while the second relies on a more centrally concentrated halo profile. Thus even this small discrepancy between observations and simulations can be remedied.
6 Summary and discussion
Bars are present in the majority of observed disc galaxies and also form spontaneously in -body simulations. Contrary to previous beliefs, it is now well established that haloes can destabilise bars, since they can take positive angular momentum from them and thus make them stronger and slower rotating. This of course will work only if all components are non-rigid and capable of emitting/absorbing angular momentum.
It is possible to account for the considerable spread in observed bar morphologies. These can range from short bars or ovals, which should be found in disc galaxies within which not much angular momentum has been exchanged, to very strong bars with rectangular-like isophotes, which on the contrary should be in galaxies having undergone considerable amount of angular momentum redistribution. Extreme cases of such galaxies are some examples of bar dominated early type discs presented by \inlineciteGad03, in which the disc is not a major component any more, since a very considerable fraction of its mass is now within the bar component. Indeed, it is possible to turn the problem around and to try and obtain some information on galaxy haloes from the morphology of their bars. Even though no strong conclusions can be reached in this way, the insight thus obtained is still very welcome, since our knowledge on disc galaxy haloes is still very restricted. Thus short bars, like in our own Galaxy, should be indicative of very hot haloes, which could not absorb much angular momentum. On the contrary, strong and long bars, should be indicative of haloes that can absorb angular momentum, with considerable amount of material in the relatively inner regions where the resonances lie.
A short while after having formed, the bar buckles perpendicular to the disc equatorial plane and forms an edge-on boxy or peanut shape. Detailed comparison of -body bars with structures known as ‘boxy or peanut bulges’ – including morphology, photometry and kinematics – show that these so-called bulges are in fact the part of the bar sticking out of the equatorial plane of the galaxy. This behaviour and structure is easily understood with the help of the orbital structure in 3D barred galaxy potentials.
In this appendix I summarise some elementary notions for orbits and resonances in order to introduce the notation and nomenclature used in this paper.
In galactic discs, many stars are on orbits which are not too far from circular, so that the epicyclic approximation is valid. Orbits on the equatorial plane of a disc galaxy are then characterised by two frequencies : the angular frequency and the frequency of the radial motion, called epicyclic frequency, . In a frame of reference in which the bar (or, more generally, the non-axisymmetric perturbation) is at rest, the angular frequency becomes , where is the pattern speed. Resonances occur when the angular and radial frequencies are commensurable, i.e. when
| (1) |
where and are integers, so that the orbit closes in the rotating frame of reference. If the orbit closes after one rotation and two radial oscillations, i.e. when and = 2, it is at inner Lindblad resonance (ILR). An example of such an orbit is shown in the middle panel of Fig. 11. For = 1 and = 2 the orbit is at the outer Lindblad resonance (OLR). If the orbit is at corotation (CR), then = 0 (right panel of Fig. 11). Further resonances of importance to bars are the inner ultra-harmonic resonance (iUHR) with and , and in general all resonances with . If the and values are not commensurable the orbit will not close (left panel of Fig. 11). Epicyclic orbits in three dimensions have one more frequency, the frequency of the vertical oscillation (), so that further resonances are possible. For example if
| (2) |
with and = 2, then the orbit is at the vertical ILR, often named the 2:1 vertical resonance. Vertical resonances of the m:1 type are in general important since they can introduce families which are crucial for building the peanut structure.
Of course, in general orbits are not simple epicycles, yet working in action-angle variables (e.g. Binney and Tremaine, 1987) makes it possible to deal with the regular orbits in ways similar to those used for epicycles, and in particular to define resonances in a similar way. It is also possible to determine the principal frequencies of an orbit numerically Binney and Spergel (1982) and this can be made even for potentials which are not known in a closed analytical form, as e.g. those from -body simulations.

Acknowledgements.
In the past four years, during which I was working on the subject matters discussed in this paper, I benefitted from a number of interesting and motivating discussions with A. Bosma, M. Bureau, W. Dehnen, A. Misiriotis, P. Patsis, M. Tagger, G. Aronica, I. Berentzen, K. Freeman, B. Fuchs, A. Kalnajs, J. Kormendy, D. Lynden-Bell, F. Masset, and Ch. Skokos. I thank Jean-Charles Lambert for his invaluable help with the simulation software and the administration of the runs and W. Dehnen for making available to me his tree code and related programs. I also thank the Observatoire de Marseille, the region PACA, the INSU/CNRS and the University of Aix-Marseille I for funds to develop the computing facilities used for the calculations in this paper.References
- Aronica et al. (2003) Aronica, G., E. Athanassoula, M. Bureau, A. Bosma, R.-J. Dettmar, D. Vergani and M. Pohlen. Comparing peanut shaped “bulges” to -body simulations and orbital calculations. Astrophysics and Space Science, 284:753–756, 2003.
- Aronica et al. (2004) Aronica, G., M. Bureau, E. Athanassoula, A. Bosma, R.-J. Dettmar and K.C. Freeman. K-band observations of boxy bulges. I. Morphology and major-axis surface brightness profiles. In preparation, 2004.
- Athanassoula (1992) Athanassoula, E. The existence and shapes of dust lanes in galactic bars. Monthly Notices of the Royal Astronomical Society, 259:345–364, 1992.
- Athanassoula (1996) Athanassoula, E. Evolution of bars in isolated and interacting disk galaxies. In R. Buta, D.A. Crocker and B.G. Elmegreen Barred Galaxies, pages 309–321, Astron. Soc. Pac. Conf. Series 91, 1996.
- Athanassoula (2002) Athanassoula, E. Bar-halo interaction and bar growth. Astrophysical Journal Letters, 569:L83–L86, 2003.
- Athanassoula (2003a) Athanassoula, E. What determines the strength and the slowdown rate of bars? Monthly Notices of the Royal Astronomical Society, 341:1179–1198, 2003a.
- Athanassoula (2003b) Athanassoula, E. Isolated and interacting galaxies : simulations with GRAPE. In J. Makino and P. Hut, editors, Astrophysical supercomputing using particles, Astron. Soc. Pac. Conference Series, IAU Symp. 208, 208:177–188, 2003b.
- Athanassoula (2004a) Athanassoula, E. On the nature of bulges in general and box/peanut ‘bulges’ in particular. Input from -body simulations. Monthly Notices of the Royal Astronomical Society, submitted, 2004a.
- Athanassoula (2004b) Athanassoula, E. Existence and properties of a bar in the inner halo of barred galaxies. in preparation, 2004b.
- Athanassoula et al. (1983) Athanassoula, E., O. Bienaymé, L. Martinet and D. Pfenniger Orbits as building blocks of a barred galaxy model. Astronomy and Astrophysics 127:349–360, 1983.
- Athanassoula and Bureau (1999) Athanassoula, E. and M. Bureau. Bar diagnostics in edge-on spiral galaxies. II. Hydrodynamical simulations. Astrophysical Journal, 552:699–717, 1999.
- Athanassoula and Misiriotis (2002) Athanassoula, E. and A. Misiriotis. Morphology, photometry and kinematics of body bars. I Three models with different halo central concentrations. Monthly Notices of the Royal Astronomical Society, 330:35–52, 2002.
- Athanassoula and Sellwood (1986) Athanassoula, E. and J. A. Sellwood. Bi-symmetric instabilities of the Kuz’min/Toomre disc. Monthly Notices of the Royal Astronomical Society, 221:213–232, 1986.
- Berentzen et al. (2004) Berentzen, I., E. Athanassoula, C. H. Heller and K. J. Fricke. The regeneration of stellar bars by tidal interactions. Numerical simulations of fly-by encounters. Monthly Notices of the Royal Astronomical Society, 347:220–236, 2004.
- Binney and Spergel (1982) Binney J. and D. Spergel. Spectral stellar dynamics. The Astrophysical Journal, 252:308–321, 1982.
- Binney and Tremaine (1987) Binney J. and S. Tremaine. Galactic Dynamics. Princeton Univ. Press, 1987.
- Bureau and Athanassoula (1999) Bureau, M. and E. Athanassoula. Bar Diagnostics in Edge-on Spiral Galaxies. I. The Periodic Orbits Approach. The Astrophysical Journal, 552:686–698, 1999.
- Bureau and Athanassoula (2004) Bureau, M. and E. Athanassoula. Bar Diagnostics in Edge-on Spiral Galaxies. III. -body simulations of disks. The Astrophysical Journal, submitted, 2004.
- Bureau and Freeman (1999) Bureau, M. and K.C. Freeman. The Nature of Boxy/Peanut-Shaped Bulges in Spiral Galaxies. Astronomical Journal, 118:126–138, 1999.
- Buta (1986) Buta, R.J. The structure and dynamics of ringed galaxies I. The morphology of galaxy rings and statistics of their apparent shapes and apparent orientations with respect to bars. Astrophysical Journal Supplements, 61:609–630, 1986.
- Chandrasekhar (1943) Chandrasekhar, S. Dynamical friction. I. General considerations: the coefficient of dynamical friction. Astrophysical Journal, 97:255–262, 1943.
- Chung and Bureau (2004) Chung, A. and M. Bureau. Stellar kinematics of boxy bulges : Large-scale bars and inner disks. Astronomical Journal, 127:3192–3212, 2004.
- Combes and Sanders (1981) Combes, F. and R.H. Sanders. Formation and properties of persisting stellar bars. Astronomy and Astrophysics, 96:164–173, 1981.
- Combes et al. (1990) Combes, F., F. Debbasch, D. Friedli and D. Pfenniger. Box and peanut shapes generated by stellar bars. Astronomy and Astrophysics, 233:82–95, 1990.
- Contopoulos (1980) Contopoulos G. How far do bars extend. Astronomy and Astrophysics, 81:198–209, 1980.
- Contopoulos and Papayannopoulos (1980) Contopoulos G. and T. Papayannopoulos. Orbits in weak and strong bars. Astronomy and Astrophysics, 92:33–46, 1980.
- Debattista and Sellwood (2000) Debattista, V. P. and J. A. Sellwood. Constraints on dynamical friction on the dark matter content of barred galaxies. Astrophysical Journal, 543:704–721, 2000.
- Elmegreen et al. (1990) Elmegreen, D.M., B.G. Elmegreen and A.D. Bellin. Statitical evidence that galaxy companions trigger bars and change Hubble types. Astrophysical Journal, 364:415–419, 1990.
- Eskridge et al. (2000) Eskridge et al. The frequency of barred spirals in the near-infrared. Astronomical Journal, 119:536–544, 2000.
- Fuchs (2004) Fuchs, B. Density waves in the shearing sheet. IV Interaction with a live dark halo.. Astronomy and Astrophysics, 419:941–948, 2004.
- Gadotti and de Souza (2003) Gadotti, D. A. and R. E. de Souza NGC 4608 and NGC 5701: barred galaxies without disks ? Astrophysical Journal, 583:L75–L78, 2003.
- Grosbøl et al. (2002) Grosbøl P., E. Pompei, and P.A. Patsis. Spiral structure observed in the near-infrared. In E. Athanassoula, A. Bosma and R. Mujica Disks of galaxies : Kinematics, dynamics and perturbations, pages 305–310, Astron. Soc. Pac. Conf. Series 275, 2002.
- Hernquist and Weinberg (1992) Hernquist, L. and M. Weinberg. Bar-spheroid interaction in galaxies. Astrophysical Journal, 400:80–95, 1992.
- Hohl (1971) Hohl, F. Numerical experiments with a disc of stars Astrophysical Journal, 168:343–359, 1971.
- Holley-Bockelmann et al. (2003) Holley-Bockelmann, K., M. D. Weinberg, and N. Katz. Bar-induced evolution of dark matter cusps. astro-ph/0306374, 2003.
- Kalnajs (1971) Kalnajs, A. J. Dynamics of flat galaxies I Astrophysical Journal, 166:275–293, 1971.
- Kuijken and Merrifield (1995) Kuijken K. and M. R. Merrifield. Establishing the connection between peanut shaped bulges and galactic bars. Astrophysical Journal, 443:L13–L16, 1995.
- Little and Carlberg (1991a) Little, B. and R. G. Carlberg. The long-term evolution of barred galaxies. MNRAS, 250:161–170, 1991a.
- Little and Carlberg (1991b) Little, B. and R. G. Carlberg. Bar-disc angular momentum exchange. MNRAS, 251:227–242, 1991b.
- Lynden-Bell and Kalnajs (1972) Lynden-Bell, D. and A. J. Kalnajs. On the generating mechanism of spiral structure. Monthly Notices of the Royal Astronomical Society, 157:1–30, 1972.
- Merrifield and Kuijken (1999) Merrifield, M. R. and K. Kuijken. Hidden bars and boxy bulges. Astronomy and Astrophysics, 345:L47–L50, 1999.
- Miller et al. 1970 (1970) Miller, R. H., K. H. Prendergast and W. J. Quirk. Numerical experiments on spiral structure. Astrophysical Journal, 161:903–916,1970.
- O’Neill and Dubinski (2003) O’Neill, J. K. and J. Dubinski. Detailed comparison of the structures and kinematics of simulated and observed barred galaxies. Monthly Notices of the Royal Astronomical Society, 346:251–264, 2003.
- Ostriker and Peebles (1973) Ostriker, J. P. and P. J. E. Peebles. A numerical study of the stability of flattened galaxies : or can cold galaxies survive? Astrophysical Journal, 186:467–480,1973.
- Patsis (2002) Patsis, P.A. Orbital morphology of 3D bars. In E. Athanassoula, A. Bosma and R. Mujica Disks of galaxies : Kinematics, dynamics and perturbations, pages 161–168, Astron. Soc. Pac. Conf. Series 275, 2002.
- Patsis et al. (2002) Patsis, P.A., Ch. Skokos and E. Athanassoula. Orbital dynamics of three dimensional bars - III Boxy/peanut edge-on profiles. Monthly Notices of the Royal Astronomical Society, 337:578–596, 2002.
- Patsis et al. (2003) Patsis, P.A., Ch. Skokos and E. Athanassoula. Orbital dynamics of three dimensional bars - IV Boxy isophotes in face-on views. Monthly Notices of the Royal Astronomical Society, 342:69–78, 2003.
- Pfenniger (1984) Pfenniger, D. The 3D dynamics of barred galaxies. Astronomy and Astrophysics, 134:373–386, 1984.
- Raha et al. (1991) Raha, N., J. A. Sellwood, R. A. James and F. D. Kahn. A dynamical instability of bars in disk galaxies. Nature, 352:411–412, 1991.
- Skokos et al. (2002a) Skokos, Ch., P.A. Patsis and E. Athanassoula. Orbital dynamics of three dimensional bars - I The backbone of three dimensional bars. A fiducial case. Monthly Notices of the Royal Astronomical Society, 333:847–860, 2002.
- Skokos et al. (2002b) Skokos, Ch., P.A. Patsis and E. Athanassoula. Orbital dynamics of three dimensional bars - II Investigation of the parameter space. Monthly Notices of the Royal Astronomical Society, 333:861–870, 2002.
- Tremaine and Weinberg (1984) Tremaine, S. and M. Weinberg. Dynamical friction in spherical systems. Monthly Notices of the Royal Astronomical Society, 209:729–757, 1984.
- Valenzuela and Klypin (2003) Valenzuela, O. and A. Klypin. Secular bar formation in galaxies with significant amount of dark matter. Monthly Notices of the Royal Astronomical Society, 345:406–422, 2003.
- Weinberg (1985) Weinberg, M. Evolution of barred galaxies by dynamical friction. Monthly Notices of the Royal Astronomical Society, 213:451–471, 1985.
- Weinberg (2004) Weinberg, M. Time-dependent secular evolution in galaxies. Monthly Notices of the Royal Astronomical Society, astro-ph/0404169, 2004.