Chemical Constraints on the Water and Total Oxygen Abundances in the Deep Atmosphere of Saturn
Abstract
Thermochemical equilibrium and kinetic calculations for the trace gases CO, PH3, and SiH4 give three independent constraints on the water and total oxygen abundances of Saturn’s deep atmosphere. A lower limit to the water abundance of H2O/H2 (1.7)10-3 is given by CO chemistry while an upper limit of H2O/H2 (5.5)10-3 is given by PH3 chemistry. A combination of the CO and PH3 constraints indicates a water enrichment on Saturn of 1.9 to 6.1 times the solar system abundance (H2O/H2 = 8.9610-4). The total oxygen abundance must be at least 1.7 times the solar system abundance (O/H2 = 1.1610-3) in order for SiH4 to remain below the detection limit of SiH4/H2 <2. A combination of the CO, PH3, and SiH4 constraints suggests that the total oxygen abundance on Saturn is 3.2 to 6.4 times the solar system abundance. Our results indicate that oxygen on Saturn is less enriched than other heavy elements (such as C and P) relative to the solar system composition.
1 Introduction
Spectroscopic observations of water in the upper atmosphere of Saturn indicate a H2O/H2 mixing ratio (qH2O) of (2-200)10-9 (Larson et al. 1980; Winkelstein et al. 1983; Chen et al. 1991; de Graauw et al. 1997; Feuchtgruber et al. 1997), well below the solar system (i.e., protosolar) H2O/H2 ratio of . Measurements of H2O in the 5 m window probe the bar level in Saturn’s troposphere (Larson et al. 1980; de Graauw et al. 1997). However, H2O cloud condensation occurs deeper, near the 13 bar level, so the water abundance below the clouds and therefore the planetary inventory of water remains unknown. Observations of Saturn’s atmosphere show that CH4/H2, PH3/H2, and AsH3/H2 ratios are enhanced over protosolar values, suggesting a similar enrichment may exist for water. The total oxygen abundance of Saturn’s interior is expected to primarily consist of H2O and O bound in rock. Since oxygen is the third most abundant element in the solar system, water vapor is expected to be an important gas below the clouds of Saturn.
Here we consider the effects of water and oxygen on tropospheric chemistry to determine the water and total oxygen abundances of Saturn’s deep atmosphere. We specifically focus on the disequilibrium trace gases CO, PH3, and SiH4 because their chemistry is sensitive to the water and oxygen content of the troposphere. Using a similar approach as Fegley & Prinn (1988), we show that the observed abundance of CO and the upper limit for SiH4 are incompatible with significant planetary depletions in water and oxygen, while the PH3 abundance is incompatible with large enrichments. Taken together, our results indicate that water and total oxygen on Saturn are less enriched than heavy elements such as C and P relative to solar system composition. We begin with an overview of the observed composition of Saturn’s atmosphere (§2) and a brief description (§3) of our computational method. In §4, we present an overview of Saturn’s atmospheric chemistry and our results for the CO, PH3, and SiH4 chemical constraints, followed by discussion (§5) of their implications for the water and oxygen abundances of Saturn’s interior. A summary is given in §6.
2 Atmospheric Composition of Saturn
The observed mixing ratios for several compounds in Saturn’s atmosphere are listed in Table 1, along with computed enrichments over solar system abundances. Methane, PH3, and AsH3 are the major C-, P-, As-bearing gases in Saturn’s atmosphere (Lodders & Fegley 1998). It is generally assumed that the CH4, PH3, and AsH3 abundances represent the total elemental abundances of C, P, and As, respectively, in Saturn’s observable atmosphere (e.g., Courtin et al. 1984, Noll et al. 1989, Noll & Larson 1990, Bézard et al. 1989, Fegley & Lodders 1994; Hersant et al. 2004), and the same approach is taken here. Saturn’s atmospheric composition below the clouds is generally considered to be uniform because of convective mixing. However, the distribution of elements between different gases (e.g., H2O, CO, OH) and (in some cases) between gases and condensates (e.g., H2O, rock) is temperature and pressure dependent. Although similar within observational uncertainties, the enrichment factor for As is apparently less than that for C and P, possibly due to the formation of other As-bearing gases such as AsF3 (see Fegley & Lodders 1994). Ammonia is almost certainly the major N-bearing gas in Saturn’s atmosphere. However, the NH3 abundance is affected by cloud condensation and photolysis and cannot be used as a constraint on the nitrogen enrichment relative to protosolar composition. Likewise, the observed abundances of other gases such as H2S and GeH4 cannot be used as constraints because they are affected by condensation (solid NH4SH, Ge, GeTe), photolysis (H2S), and formation of other gases (GeS, GeSe, GeTe) (Fegley & Lodders 1994). Briggs & Sackett (1989) inferred a H2S abundance on Saturn of times the protosolar value. However, because it is difficult to distinguish the microwave opacity of H2S from other sources, this H2S abundance is an indirect estimate based on the brightness temperature spectrum for an assumed NH4SH cloud (Hersant et al. 2004). Thus at present we only use the observed enrichments in C and P to constrain the average enrichment of heavy elements on Saturn relative to the solar system composition.
Elemental abundances for the solar nebula (i.e., protosolar abundances) were taken from Lodders (2003). These are slightly different from photospheric abundances due to heavy element settling in the Sun (Lodders 2003). The protosolar elemental abundances represent the bulk elemental composition of the Sun and the solar nebula. Water vapor is expected to be the dominant O-bearing gas in the circum-Saturnian nebula and in Saturn’s deep atmosphere (e.g., see §4.1; Fegley & Prinn 1985; 1989), and the CO/H2O ratio in both environments is much less than unity. The protosolar H2O/H2 ratio is defined by taking the total oxygen abundance (O/H) and subtracting the portion that forms rock (see Lodders 2004). This is expressed as
| (1) |
where the amount of oxygen bound in rock (MgO+SiO2+CaO+Al2O3+Na2O+K2O+TiO2) is given by
| (2) |
In a gas with protosolar elemental abundances, the formation of rock effectively removes 23% of the total oxygen. Throughout the following, enrichments in water over the protosolar composition refer to a solar system H2O/H2 ratio of .
3 Method
Thermochemical equilibrium calculations were performed using a Gibbs free energy minimization code and an adiabatic temperature-pressure profile for Saturn’s troposphere calculated as described by Fegley & Prinn (1985) using T = 134.8 K at P = 1 bar (Lindal et al. 1985) and a total He/H2 ratio of 0.135. This value is the mean of the volume mixing ratio He/H2 = 0.11-0.16 determined by Conrath & Gautier (2000), considerably greater than the previously accepted value of 0.0340.024 (Conrath et al. 1984). The corresponding mole fraction of hydrogen (X) is 0.881. We adopted a nominal enrichment factor of 7.4 times the protosolar element/H2 ratios for elements heavier than He based upon the observed enrichments of CH4 and PH3 on Saturn, as described in §2 and shown in Table 1. We also varied the elemental abundances of C, P, Si, and O in order to study the resulting effects on Saturn’s tropospheric chemistry.
4 Results
4.1 Overview of Atmospheric Chemistry
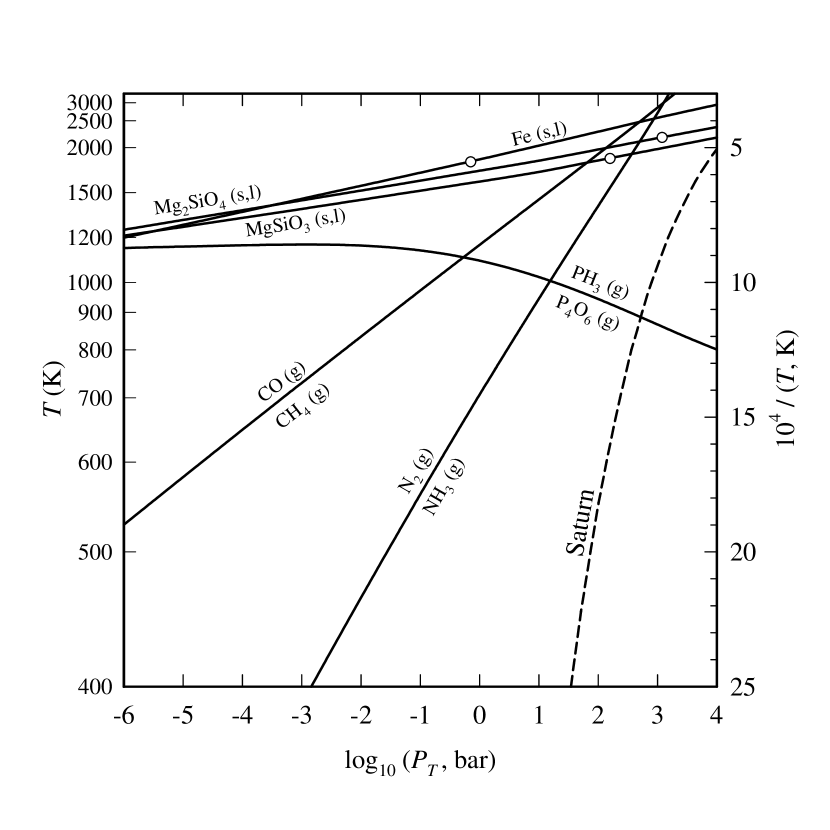
The model adiabatic profile for Saturn’s atmosphere is shown in Figure 1. This figure also shows the results of thermochemical equilibrium calculations for a gas with protosolar elemental abundances. The lines labelled Fe (s,l), Mg2SiO4 (s,l), and MgSiO3 (s,l) are the condensation curves for iron, forsterite (Mg2SiO4), and enstatite (MgSiO3), with open circles denoting their normal melting points. These three phases constitute most of the “rock” that is expected to condense in Saturn’s deep atmosphere. The curves labelled CO/CH4, N2/NH3, and PH3/P4O6 show where the partial pressures of these gases are equal, and they are interpreted as follows. Methane (CH4) is the major carbon-bearing gas to the right of the CO/CH4 curve, and carbon monoxide (CO) is the major carbon-bearing gas to the left of the CO/CH4 curve. However, CH4 is still present, but is less abundant than CO, inside the CO field and vice versa. Likewise ammonia (NH3) is the major nitrogen-bearing gas to the right of the N2/NH3 curve, and molecular nitrogen (N2) is the major nitrogen-bearing gas to the left of the N2/NH3 curve. Ammonia is still present, but is less abundant than N2, inside the N2 field, and vice versa. A comparison of the model Saturnian adiabat with the CO/CH4 and N2/NH3 curves shows that methane and ammonia are predicted to be the dominant C-bearing and N-bearing gases throughout Saturn’s atmosphere at temperatures below 3000 K.
At pressures characteristic of the deep atmospheres of Saturn and the other gas giant planets, phosphine (PH3) is the major phosphorus-bearing gas to the top of the PH3/P4O6 curve, and P4O6 gas is the major phosphorus-bearing gas to the bottom of the PH3/P4O6 curve. The partial pressures of the two gases are equal at about the 900 K level in Saturn’s atmosphere. This curve is extrapolated to lower pressures but at these pressures phosphorus chemistry becomes more complex and a number of phosphorus-bearing molecules are found in the gas at high temperatures (e.g., Fegley and Lewis 1980).
4.2 Carbon Monoxide
We first consider carbon monoxide (CO), which is observed in Saturn’s atmosphere at a mixing ratio (CO/H2) of (Noll et al. 1986; Noll & Larson 1990; de Graauw et al. 1997). This is 40 orders of magnitude higher than the CO abundance predicted by thermodynamic equilibrium in Saturn’s cool, visible atmosphere (e.g., see Fegley & Prinn 1985; Fegley & Lodders 1994). As discussed by Fegley & Prinn (1985, p. 1076), CO in Saturn’s observable atmosphere may result from a combination of internal and external sources. We consider the effects of an additional external source in §4.2.4. Carbon monoxide in Saturn’s deep atmosphere is produced from water via the net thermochemical reaction
| (3) |
The corresponding equilibrium constant expression for reaction (3) is
| (4) |
where is the equilibrium constant and is the total pressure along the adiabatic profile. Rearranging equation (4) and substituting mixing ratios for mole fractions for CO, CH4, and H2O (e.g., ), the CO mixing ratio is given by
| (5) |
We now rewrite equation (5) to explicitly show the dependence of the CO mixing ratio upon the CH4 and H2O enrichments relative to solar system composition. The protosolar mixing ratios for methane () and water () and the hydrogen mole fraction of X are constants, allowing us to write
| (6) |
Substitution into equation (5) gives
| (7) |
where and are enrichment factors over the protosolar composition for the methane (i.e., carbon) and water abundances in Saturn’s atmosphere. Examination of equation (7) shows that the CO mixing ratio is proportional to the product (). Thus for otherwise constant conditions, the water enrichment required to produce a given CO abundance varies inversely with the methane enrichment. The equilibrium CO mixing ratio as a function of temperature (expressed as ) along the Saturnian adiabat is given by the equation
| (8) |
from 300-6000 K, where from equation (6). Equation (4.2) has the form of a heat capacity polynomial to account for the strong temperature dependence of the equilibrium constant .
4.2.1 Thermodynamic Limit
At constant pressure, reaction (3) proceeds to the right with increasing temperature and yields more CO (Lodders & Fegley 2002). However, at constant temperature, reaction (3) proceeds to the left with increasing pressure and yields less CO. In other words, the equilibrium abundance of CO increases with increasing temperature and with decreasing pressure. Therefore a maximum occurs in the CO mixing ratio along the Saturnian adiabat, found by differentiating equation (4.2) and solving for the temperature at which the derivative is zero:
| (9) |
which gives the maximum at 2910 K. The greatest CO abundance is achieved at this temperature over a wide range of water enrichments and therefore it serves as a thermodynamic lower limit to the total water abundance in Saturn’s interior. Using K and the observed mixing ratio (see Table 1) in equation (4.2) gives
| (10) |
At the nominal carbon enrichment of of 7.4 times protosolar, the enrichment factor for water is . Using the lower bound of this value indicates that is necessary to produce the observed CO abundance, corresponding to a H2O/H2 mixing ratio of in Saturn’s troposphere. Thus, water cannot be depleted more than times the protosolar value if the observed amount of CO is produced in Saturn’s interior. This thermodynamic constraint gives a firm lower limit to the amount of water in Saturn’s deep atmosphere. However, it implies mixing of gas from an unrealistic depth (the 2910 K, 46 kbar level) up to the visible atmosphere. In order to better constrain a lower limit to the water abundance, the kinetics of CO destruction must be considered.
4.2.2 Kinetic Limit
As parcels of hot gas rise in Saturn’s atmosphere, CO is destroyed by conversion to CH4. Therefore the observable amount of CO depends on both the rate of vertical mixing and the kinetics of conversion (e.g., Fegley & Prinn 1985). In the kinetic scheme proposed by Prinn & Barshay (1977), CO is in equilibrium with formaldehyde and the rate-limiting step for CO destruction is the breaking of the CO bond in formaldehyde via
| (11) |
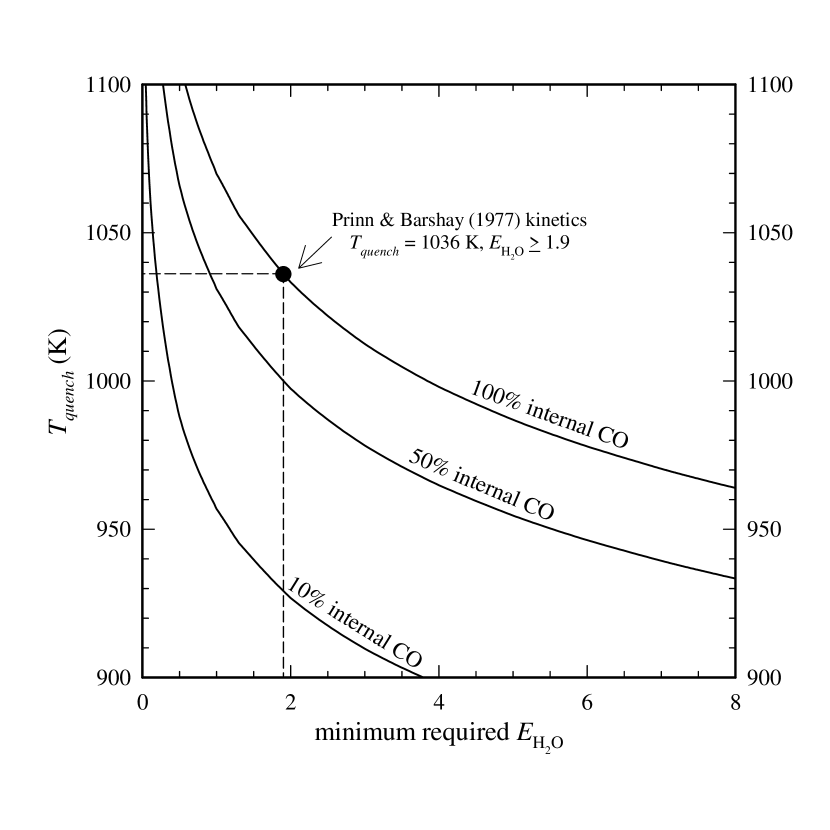
Assuming that the maximum plausible rate of vertical mixing is given by cm2 s-1, estimated from Saturn’s internal heat flux (see Prinn et al. 1984, p. 138), CO destruction is quenched at the 1036 K level on Saturn. Using K in equation (4.2) along with the observed CO abundance gives
| (12) |
Equation (12) defines the lower limit for enrichments in the carbon and water abundances on Saturn. At the nominal carbon enrichment of 7.4 times protosolar, the enrichment factor for water is . The lower bound of this value indicates that is required to produce the observed CO abundance. This corresponds to a H2O/H2 mixing ratio of qH2O in Saturn’s deep atmosphere.
4.2.3 Alternative Thermochemical Kinetics
An alternative kinetic scheme for CO destruction was proposed by Yung et al. (1988) where the rate limiting step involves the conversion of the CO bond in formaldehyde into a CO bond via
| (13) |
This alternative kinetic scheme gives significantly less CO at the same vertical mixing rate than the Prinn & Barshay (1977) model because the rate determining step is significantly faster (e.g., see Yung et al. 1988 and Bézard et al. 2002). Vertical mixing that is orders of magnitude more rapid than implied by observed heat fluxes or mixing lengths significantly smaller than pressure scale heights are required to match observed CO abundances on Jupiter and Saturn using this alternative kinetic scheme. Leaving these problems aside, we compute a quench temperature for reaction (13) of 816 K on Saturn. In this case, using K in equation (4.2) with the observed CO mixing ratio gives
| (14) |
The nominal value of 7.4 times protosolar requires , or a water abundance of in Saturn’s atmosphere. If we employ a mixing length of in place of the pressure scale height (Bézard et al. 2002, Smith 1998), the quench temperature is 922 K, which requires , and a water abundance of in Saturn’s atmosphere. However, as we discuss in §4.3, the observed PH3 abundance precludes a water enrichment that is this large. A detailed mechanistic examination of CO quenching kinetics is beyond the scope of this paper. Here we continue our use of the Prinn & Barshay (1977) kinetic scheme for CO destruction kinetics because it accurately reproduces the observed CO abundance on Jupiter, Saturn, and Neptune (Fegley & Lodders 1994; Lodders & Fegley 1994).
4.2.4 External CO Source
As suggested by Fegley & Prinn (1985), Saturn may also have a competing external source of CO. If present, an external CO source would lower the amount of tropospheric water required to produce the observed CO abundance. Possible external sources include direct delivery of CO or photolytic production via stratospheric water from interplanetary dust, cometary impacts, or infalling ring or satellite debris (e.g., Fegley & Prinn 1985; Moses et al. 2000).
Measurements of carbon monoxide on Saturn suggest, but are not diagnostic of, a primarily internal source that produces qCO in the upper troposphere (e.g., see Noll et al. 1986; Noll & Larson 1990; Moses et al. 2000; Ollivier et al. 2000), and most spectroscopic models for the observed CO abundance on Saturn include both an internal and external source. However, the relative strength of each source is currently unknown. We therefore considered scenarios which include both an internal and external source of CO.
Results are shown in Figure 2 for internal CO fluxes comprising 100%, 50%, and 10% of the lower bound of the observed CO mixing ratio. At higher quench temperatures (), CO originates deeper in the troposphere where it is thermodynamically more stable and thus smaller water enrichments are required to produce its observed abundance. At lower quench temperatures, CO originates higher in the troposphere where it is thermodynamically less stable and therefore requires larger water enrichments to achieve the observed abundance. However, the upper limit on the water enrichment given by PH3 chemistry (see §4.3) indicates that some of the observed CO in Saturn’s atmosphere must come from an external source if the CO quench temperature is less than 977 K.
At a constant quench temperature, less tropospheric water is required if some of the observed CO is external in origin. For example, in their model distribution S in Noll & Larson (1990) the observed CO is mostly stratospheric (external), and in the troposphere, or about 10% of the nominal CO abundance. At a quench temperature of 1036 K, model S requires a tropospheric water enrichment of , compared to when all of the observed CO comes from an internal source. For our present discussion, we assume a primarily internal source that produces a mixing ratio of and thus requires a water abundance of H2O/H in Saturn’s troposphere (see §4.2.2).
4.3 Phosphine
Phosphine (PH3) is observed in Saturn’s atmosphere at a mixing ratio (PH3/H2) of (5.11.6)10-6 (Table 1). Because it is destroyed by tropospheric water, PH3 constrains the upper limit of Saturn’s water abundance. The phosphine abundance is governed by the net thermochemical equilibrium
| (15) |
which shows that, according to LeChâtelier’s principle, the PH3 abundance decreases as the water abundance increases to maintain chemical equilibrium. Rearranging the equilibrium constant expression for reaction (15), the phosphine abundance is given by
| (16) |
At high temperatures and/or low water abundances, phosphine is the dominant P-bearing gas and qPHP. As parcels of hot gas rise in Saturn’s atmosphere, PH3 is oxidized to P4O6. The observed abundance of PH3 is orders of magnitude higher than that predicted by thermodynamic equilibrium and its presence is evidence of rapid vertical mixing from Saturn’s deep atmosphere (Fegley & Prinn 1985). Unlike CO, phosphine gives no inherent thermodynamic limit to water enrichment because the PH3 abundance generally increases with both temperature and pressure (cf. Figure 3, Fegley & Prinn 1985). Therefore we turn directly to PH3 quenching kinetics to constrain the upper limit on the water abundance.
The observable amount of phosphine depends on both the rate of vertical mixing and the kinetics of PH3 destruction. Prinn et al. (1984) proposed a mechanism for PH3 destruction where the rate-determining step is formation of the PO bond via:
| (17) |
Based on work by Twarowski (1995) we take the formation of the PO bond by direct reaction of PH3 with an OH radical as our rate-determining step:
| (18) |
The corresponding chemical lifetime for PH3 is
| (19) |
where the estimated rate constant is obtained from Twarowski’s (1995) kinetic study of phosphine combustion products and is given by
| (20) |
We again assume that the maximum plausible rate of vertical mixing is given by cm2 s-1, and find that using reaction (18) as the rate-determining step for phosphine destruction gives similar results as reaction (17). Solving equations (16) and (19) at a phosphorus enrichment of times protosolar shows that H2O in Saturn’s deep atmosphere cannot be enriched more than times the solar system abundance because greater water enrichments would reduce the PH3 abundance below the observed level. This water enrichment corresponds to a H2O/H2 mixing ratio of in Saturn’s troposphere.
4.4 Silane
Silane (SiH4) is destroyed by water in the deep atmosphere of Saturn and serves as a constraint on the total oxygen abundance of Saturn’s interior. Silicon is about 120, 8,300, and 164,000 times more abundant than P, Ge, and As, respectively, in protosolar composition gas. However, while PH3, GeH4, and AsH3 have each been observed on Saturn (see Table 1), SiH4 (predicted to be the dominant Si-bearing gas) remains undetected with an upper limit of qSiH4< (Larson et al. 1980; Noll & Larson 1990). This is because silicon is efficiently removed from Saturn’s atmosphere by the formation of silicates such as MgSiO3 (enstatite) and Mg2SiO4 (forsterite), exemplified by the net thermochemical reaction (Fegley & Prinn 1988):
| (21) |
which incorporates Si into rock. In order for reaction (21) to remove Si from the atmosphere it is evident that water vapor must be present to oxidize SiH4. This is only possible if the total oxygen abundance (O) is greater than or equal to the oxygen consumed by rock-forming oxides (O). This mass balance constraint can be written as
| (22) |
where the amount of oxygen bound in rock is given by equation (2). Protosolar composition gas (Lodders 2003) has
| (23) |
which clearly satisfies the mass balance criterion. Thus in order for reaction (21) to destroy all SiH4 on Saturn, the oxygen enrichment () in Saturn’s deep atmosphere must be
| (24) |
where , etc., that is, all rock-forming elements are assumed to be equally enriched. This assumption is not necessarily correct because it appears that P and As, both of which are rock-forming elements, may not be equally enriched on Saturn (e.g., Noll et al. 1989; Noll & Larson 1990; see Table 1 and §2). However, we explicitly assume equal enrichment of rock-forming elements and take by comparison with the observed enrichment in phosphorus. Equation (24) then gives a total oxygen enrichment of times the protosolar oxygen abundance and a mixing ratio of O/H in Saturn’s deep atmosphere. At lower enrichments, there is not enough oxygen available to effectively oxidize silicon and we would expect to see SiH4 abundances well above (up to five orders of magnitude) the observational upper limit.
5 Discussion
5.1 Constraints on Saturn’s Oxygen Inventory
The chemical constraints placed on the water and total oxygen abundance on Saturn are summarized in Table 2. The independent constraints given by CO and PH3 indicate a water abundance of in Saturn’s deep atmosphere, corresponding to a water enrichment of 1.9 to 6.1 times the solar system H2O/H2 ratio. We therefore expect water vapor to be the third or fourth most abundant gas (after H2, He, and CH4) below the clouds of Saturn.
The silane mass balance constraint by itself shows that the total oxygen abundance on Saturn must be enhanced by a factor of at least 1.7 times protosolar. However, this constraint neglects that after completely oxidizing Si and forming rock, enough oxygen must be left over (as H2O) to produce carbon monoxide in Saturn’s troposphere. But if too much oxygen remains, the observed amount of PH3 cannot form. We therefore combine the CO & SiH4 constraints and the PH3 & SiH4 constraints to estimate the lower and upper limit, respectively, of Saturn’s total oxygen abundance (cf. Fegley & Prinn 1988). Rewriting equation (1) using enrichment factors gives
| (25) |
where the terms in parentheses are the protosolar values. Replacing these terms with values from Lodders (2003), equation (25) can be rewritten as
| (26) |
which relates the enrichment factors for water, oxygen, and rock, and implicitly contains the silane mass balance constraint given in equation (24) (). Assuming in equation (26), the CO water constraint () gives an oxygen lower limit of , while the PH3 water constraint () gives an oxygen upper limit of . The upper and lower limits on the total oxygen abundance of Saturn are summarized in Table 2. Taken together, the chemical constraints indicate a total oxygen enrichment in Saturn’s interior of 3.2 to 6.4 times the solar system O/H2 abundance, similar to that observed for arsenic and less than the observed enrichments in carbon and phosphorus.
From equation (25) it is evident that estimates of the total oxygen enrichment depend on the assumed rock enrichment on Saturn, so that smaller or larger rock abundances require, respectively, smaller or larger enrichments in oxygen. However, the observed CO and PH3 mixing ratios along with the general mass balance given in equation (25) constrain the relative allowed abundances of water, oxygen, and rock over a range of rock enrichments in Saturn’s interior.
5.2 Oxygen Partitioning into Metallic H-He
The referee asked whether or not our chemical constraints on water and oxygen are valid for Saturn as a whole or apply only to its atmosphere. For example, one could ascribe the relative oxygen depletion in Saturn’s atmosphere to internal planetary fractionation processes (e.g., see Fortney & Hubbard 2003; 2004). However, the selective or preferential removal of oxygen (with respect to carbon and other heavy elements) from the molecular envelope into a metallic core is difficult to model with current knowledge about solution properties of C, N, O and other heavy elements in metallic H-He. In fact the P-T curve for the molecular to metallic hydrogen transition is unknown, as is the high pressure phase diagram for the H-He system. The hypothetical partitioning of oxygen into metallic H-He in Saturn’s interior is not our preferred model and we do not consider it further.
Instead we think that our chemical constraints are valid for Saturn as a whole. In support of this we note that the protosolar H2O/CH4 ratio explains the observed atmospheric chemistry of the brown dwarf Gliese 229b (e.g., Saumon et al. 2000). Although Gliese 229b apparently has subsolar metallicity (Saumon et al. 2000) there is no evidence from chemical models that the H2O/CH4 ratio itself is significantly smaller than the protosolar value.
5.3 The Nebular Snow Line
Our chemical constraints on Saturn’s water and total oxygen inventory also have implications for Saturn’s formation. Our results indicate that the ratio ranges from 0.26 to 0.82 and the ratio ranges from 0.43 to 0.86 on Saturn (see Table 2). On Jupiter, the observed methane abundance is 3.6 times protosolar while the observed water abundance is 0.67 times protosolar, so that and (Lodders 2004). In other words, both Jupiter and Saturn apparently have lower H2O/CH4 and O/C ratios than expected for uniform enrichments of carbon and oxygen (i.e., ). Lodders (2004) proposed that the water depletion and carbon enrichment on Jupiter can be explained by moving the water ice condensation front in the solar nebula (the nebular snow line) beyond Jupiter’s formation region. In this scenario, Jupiter never accreted much water ice. Instead, a carbonaceous matter condensation/evaporation front (the nebular tar line) was near Jupiter’s formation region and explains the carbon enrichment. This scenario may also explain the subsolar H2O/CH4 and O/C ratios that we have derived for Saturn, and account for the large water enrichments derived for Uranus and Neptune by Lodders & Fegley (1994). Further development of these ideas is beyond the scope of this paper and will pursued elsewhere (Lodders & Fegley 2005, in preparation).
6 Summary
We used CO, PH3, and SiH4 as chemical probes to provide reliable estimates of the water and total oxygen abundances in the deep atmosphere of Saturn. If the observed carbon monoxide mostly forms in the troposphere, water must be enriched at least 1.9 times the solar system abundance. The observed amount of phosphine requires a water enrichment less than 6.1 times the solar system abundance. The total oxygen abundance on Saturn must be enhanced 3.2 to 6.4 times the protosolar O/H2 ratio in order to completely oxidize Si and form rock and yet leave an appropriate amount of water to satisfy the CO and PH3 constraints. Thus oxygen on Saturn appears to be enriched relative to the solar system composition, but not to the same extent as other heavy elements such as carbon and phosphorus.
References
- Bézard et al. (1989) Bézard, B., Drosssart, P., Lellouch, E., Tarrago, G., & Maillard, J.P. 1989, ApJ, 346, 509
- Bézard et al. (2002) Bézard, B., Lellouch, E., Strobel, D., Maillard, J.P., & Drossart, P. 2002, Icarus, 159, 95
- Briggs and Sackett (1989) Briggs, F. H., & Sackett, P. D. 1989, Icarus, 80, 77
- Chen et al. (1991) Chen, F., Judge, D. L., Wu, C. Y. R., Caldwell, J., White, H. P., & Wagener, R. 1991, J. Geophys. Res., 96, 17519
- Conrath et al. (1984) Conrath, B. J., Gautier, D., Hanel, R. A., & Hornstein, J. S. 1984, ApJ, 282, 807
- Conrath & Gautier (2000) Conrath, B. J., & Gautier, D. 2000, Icarus, 144, 124
- Courtin et al. (1984) Courtin R., Gautier D., Marten, A., Bézard, B., & Hanel, R. 1984, ApJ, 287, 899
- Davis et al. (1996) Davis G. R., et al. 1996 A&A, 315, L393
- de Graauw, T., et al. (1997) de Graauw, T., et al. 1997, A&A, 321, L13
- Fegley & Prinn (1985) Fegley, B., Jr., & Prinn, R. G. 1985, ApJ, 299, 1067
- Fegley & Prinn (1988) Fegley, B., Jr., & Prinn, R. G. 1988, ApJ, 324, 621
- Fegley & Prinn (1989) Fegley, B., Jr., & Prinn, R. G. 1989, in The Formation and Evolution of Planetary Systems, ed. H.A. Weaver & L. Danly (New York: Cambridge), 171
- Fegley & Lewis (1980) Fegley, B., Jr., & Lewis, J. S. 1980, Icarus, 41, 439
- Fegley & Lodders (1994) Fegley, B., Jr., & Lodders, K. 1994, Icarus, 110, 117
- Feuchtegruber et al. (1997) Feuchtgruber, H., Lellouch, E., de Graauw T., Bézard, B., Encrenaz, T., & Griffin, M. 1997, Nature, 389, 159
- Fortney & Hubbard (2003) Fortney, J. J., & Hubbard, W. B. 2003, Icarus, 164, 228
- Fortney & Hubbard (2004) Fortney, J. J., & Hubbard, W. B. 2004, ApJ, 608, 1039
- Hersant et al. (2004) Hersant, F., Gautier, D., & Lunine, J.I. 2004, Planet. Space Sci., 52, 623
- Larson et al. (1980) Larson, H. P., Fink, U., Smith, H. A., & Davis, D. S. 1980, ApJ, 240, 327
- Lellouch et al. (2001) Lellouch, E., Bézard, B., Fouchet, T., Feuchtgruber, H., Encrenaz, T., & de Graauw, T. 2001, A&A, 670, 610
- Lindal et al. (1985) Lindal, G. F., Sweetnam, D. N., & Eshleman, V. R. 1985, AJ, 90, 1136
- Lodders & Fegley (1994) Lodders, K., & Fegley, B., Jr. 1994, Icarus, 112, 368
- Lodders & Fegley (1998) Lodders, K., & Fegley, B., Jr. 1998, The Planetary Scientist’s Companion (New York: Oxford), 213
- Lodders (2003) Lodders, K. 2003, ApJ, 591, 1220
- Lodders (2004) Lodders, K. 2004, ApJ, 611, 587
- Moses et al. (2000) Moses, J. I., Lellouch, E., Bézard, B., Gladstone, G. R., Feuchtgruber, H., & Allen, M. 2000, Icarus, 145, 166
- Noll et al. (1986) Noll, K. S., Knacke, R. F., Geballe, T. R., & Tokunaga, A. T. 1986, ApJ, 309, L91
- Noll et al. (1989) Noll, K.S., Geballe, T.R., & Knacke, R.F. 1989, ApJ, 338, L71
- Noll & Larson (1990) Noll, K. S., & Larson, H. P. 1990, Icarus, 89, 168
- Ollivier et al. (2000) Ollivier, J.L., Dobrijévic, M., & Parisot, J.P. 2000, Planet. Space Sci., 48, 699
- Prinn & Barshay (1977) Prinn, R.G., & Barshay, S. S. 1977, Science, 198, 1031
- Prinn & Fegley (1981) Prinn, R.G., & Fegley, B., Jr. 1981 ApJ, 249, 308
- Prinn et al. (1984) Prinn, R. G., Larson, H. P., Caldwell, J. J., & Gautier, D. 1984, in Saturn, ed. T. Gehrels & M.S. Matthews (Tucson: University of Arizona Press), 88
- Saumon et al. (2000) Saumon, D., et al. 2000 ApJ, 541, 374
- Smith (1998) Smith, M.D. 1998, Icarus, 132, 176
- Twarowski (1995) Twarowski, A. 1995, Combust. Flame, 102, 41
- Winkelstein et al. (1983) Winkelstein, P., Caldwell, J., Kim, S. J., Combes, M., Hunt, G. E., & Moore, V. 1983, Icarus, 54, 309
- Yung et al. (1988) Yung, Y. L., Drew, W. A., Pinto, J. P., & Friedl, R. R. 1988, Icarus, 73, 516
| Gas | Observed Mixing RatioaaMixing ratios for a gas M (qM) are defined as M/H2. | Enrichment FactorbbEnrichment factor () for a gas M is defined as (qM)/(qM). |
|---|---|---|
| H2 | 1 | 1 |
| He | 0.135 0.025 | 0.700 0.129 |
| CH4 | 7.4 2.3 | |
| SiH4 | <(0.2-1.2) | <10-5-10-6 |
| GeH4 | 0.04 0.04 | |
| NH3 | 1.1 0.8 | |
| PH3 | 7.4 2.3 | |
| AsH3 | 4.8 3.0 | |
| H2O | (2-200) | 10-4-10-6 |
| H2S | < | <0.01 |
| CO |
Note. — Saturn abundance data from Lodders & Fegley 1998; Davis et al. 1996; de Graauw et al. 1997; Feuchtgruber et al. 1997; Conrath & Gautier 2000; Lellouch et al. 2001. Solar abundance data from Lodders 2003.
| Constraint | Mixing Ratio | Enrichment Factor |
|---|---|---|
| Water | ||
| CO | ||
| PH3 | ||
| Total Oxygen | ||
| SiH4 | ||
| SiH4 & CO | ||
| SiH4 & PH3 | ||
Note. — Constraints on the water abundance are calculated assuming . Constraints on the total oxygen abundance are calculated assuming a rock enrichment of .