Observations of the Transient X-ray Pulsar KS 1947+300 by the INTEGRAL and RXTE Observatories
Astronomy Letters, Vol. 31, No. 2, 2005, pp. 88-97. Translated from Pis’ma v Astronomicheskii Zhurnal, Vol. 31, No. 2, 2005, pp. 99-109. Original Russian Text Copyright © 2005 by Tsygankov, Lutovinov.
1 Space Research Institute, Russian Academy of Sciences, Profsoyuznaya ul. 84/32, Moscow 117810, Russia
We analyze the observations of the X-ray pulsar KS 1947+300 performed by the INTEGRAL and RXTE observatories over a wide (3-100 keV) X-ray energy range. The shape of the pulse profile was found to depend on the luminosity of the source. Based on the model of a magnetized neutron star, we study the characteristics of the pulsar using the change in its spin-up rate. We estimated the magnetic field strength of the pulsar and the distance to the binary. © 2005 Pleiades Publishing Inc.
Key words: pulsars, neutron stars, X-ray sources.
∗ E-mail: st@hea.iki.rssi.ru
INTRODUCTION
The transient X-ray source KS 1947+300 was discovered in June 1989 during the observations of the Cyg X-1 region by the TTM telescope aboard the Kvant module of the Mir space station (Borozdin et al. 1990). The flux recorded from it was mCrab in the energy range 2-27 keV, and the spectrum was fitted by a power law with an index of and low-energy photoabsorption with an atomic hydrogen column density of cm-2. In April 1994, the BATSE monitor of the ComptonGRO observatory discovered the X-ray pulsar GRO J1948+32 with a period of 18.7 s in the same region of the sky. The spectrum of this source in the energy range 20-120 keV was described by a power law with a photon index of (Chakrabarty et al. 1995). Subsequently, KS 1947+300 and GRO J1948+32 were found to be the same object, a transient X-ray pulsar (Swank and Morgan 2000).
Until recently, no abrupt changes in pulsation period (the so-called glitches) were known in accreting X-ray pulsars. However, having analyzed the RXTE data, Galloway et al. (2004) pointed out that the pulsation period of KS 1947+300 changes over a very short time. Thus, in January 2001, its pulsation frequency increased by about Hz in less than 10 h (the rate of change is Hz s-1), while the X-ray flux exhibited no significant increase. The fractional change in frequency in this case was , which is much larger than that observed during glitches in radio pulsars (Krawczyk et al. 2003) and anomalous X-ray pulsars (Kaspi and Gavriil 2003). At the same time, a comparison with the BATSE data reveals a spin-down of the pulsar at a mean rate of Hz s-1 on a time scale of several years. Based on the behavior of the pulsation period during the outburst of 2000-2001, Galloway et al. (2004) determined the parameters of the binary: the orbital period d, the projected semimajor axis of the relativistic object sin light seconds, and the eccentricity . The optical counterpart in the binary is a B0 Ve star. If the true luminosity of the star is typical of stars of this spectral type, then the distance to it is estimated as kpc (Negueruela et al. 2003). In this paper, we present the results of our spectral and timing analyses of the pulsar KS1947+300 based on INTEGRAL and RXTE data in a wide (3- 100 keV) energy range.
OBSERVATIONS
The INTEGRAL International observatory (Winkler et al. 2003) placed in orbit by a Russian Proton launcher on October 17, 2002, carries four scientific instruments that allow the emission from astrophysical objects to be studied over a wide wavelength range (from optical to hard -rays). Here, we used mainly data from the ISGRI detector of the IBIS gamma- ray telescope (Ubertini et al. 2003), which includes two layers of position-sensitive detectors (ISGRI and PICsIT) and a coded mask. The ISGRI detector is effectively sensitive to photons in the energy range 20 to 200 keV (the energy resolution is 7% at 100 keV) and can image the sky region within a 2929∘ field of view (the full coding zone is 99∘) with a nominal spatial resolution of 12 arcmin (the angular size of the mask element). See Lebrun et al. (2003) for a more detailed description of the detector.
The X-ray pulsar KS 1947+300 occasionally falls within the field of view of the scientific instruments when the Galactic plane is scanned as part of the INTEGRAL Main Observing Program. In this paper, we analyze the INTEGRAL observations performed from December 2002 through April 2004. About 700 pointings were made over this period in which the object under study fell within the field of view of the INTEGRAL instruments; the total exposure time was s.
We performed the image reconstruction and the spectral analysis of the IBIS data using the methods described by Revnivtsev et al. (2004) and Lutovinov et al. (2003). An analysis of the large set of calibration observations for the Crab Nebula revealed a systematic error of 10% in the measured absolute flux from the source over a wide energy range; the spectral shape was reconstructed with an accuracy as high as 3-5%. This was taken into account in the spectral analysis by adding a systematic error of 5%. All of the errors given in this paper are purely statistical and correspond to one standard deviation. The standard OSA software of version 3.0 was used for our timing analysis of the source on time scales of the pulsation period and for our spectral analysis of the JEM-X data.
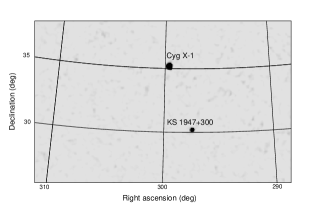
Figure 1 shows the sky map with the X-ray pulsar KS 1947+300 obtained by the IBIS telescope in the energy range 18-60 keV. This map was constructed when the Galactic plane was scanned on May 11, 2003 (MJD 52770). The detection significance of the source was 29 at a total exposure of 6 ks.
Since the object under study was not within the field of view of the JEM-X X-ray monitor (Lund et al. 2003) aboard the INTEGRAL observatory in the overwhelming majority of the cases, we failed to analyze its behavior in the standard X-ray energy range. Therefore, we used simultaneous data from the ASM monitor of the RXTE observatory (http://xte.mit.edu/ASM-lc.html) to make up for the lack of information in this range (1.3-12.2 keV). In addition, based on publicly available RXTE data, we traced the evolution of the emission from the source over a wide energy range during one of its previous outbursts in 2000-2001 (Obs. ID 50068, 50425, and 60402). The main instruments of the RXTE observatory (Bradt et al. 1993) are the PCA and HEXTE spectrometers with the operating energy ranges 3-20 and 15-250 keV, respectively. The PCA spectrometer is a system of five xenon/propane proportional counters with an effective area of 6400 cm2 at 6-7 keV; its energy resolution at these energies is 18%. The HEXTE spectrometer is a system of two independent packages of NaI(Tl)/CsI(Na) phoswich detectors swinging with an interval of 16 s for the observations of background areas at a distance of 1.5∘ from the source. At each specific time, the source can be observed only by one of the two detector packages; thus, the effective area of the HEXTE detectors is 700 cm2.
The standard FTOOLS/LHEASOFT 5.3 software package was used to process the RXTE data.
TIMING ANALYSIS
As was mentioned above, the source KS 1947+300 exhibits strong outburst activity. Figure 2 shows its light curve in the energy range 18-60 keV constructed from the IBIS/INTEGRAL data in 2002- 2004 (Fig. 2a) and the corresponding light curve in the energy range 1.3-12.2 keV constructed from the ASM/RXTE data (Fig. 2b).
As we see from the light curve, the source was in a low state during the first series of INTEGRAL observations in December 2002 (MJD 52600-52650); its intensity was 4.5 mCrab in the energy range 18- 60 keV. At the end of this period, the flux from the source began to increase and reached 30 mCrab, but we failed to observe the outburst in full.
During the subsequent observations, the pulsar KS 1947+300 was within the IBIS field of view much more rarely, which, however, allowed several intense outbursts to be detected from it. The first began in mid-April 2003 (MJD 52750) and lasted about 50 days, and the peak flux from the source was about 80 mCrab in the energy range 18-60 keV. Subsequently, we detected two more outbursts from this object in December 2003 and April 2004 with peak fluxes of 70 (MJD 52985) and 100 (MJD 53102) mCrab in the energy range 18-60 keV, respectively. Figure 2 shows a clear correlation between the hard and soft X-ray fluxes from the source.
Table 1 gives the fluxes from the pulsar KS 1947+300 measured in the energy range 18- 60 keV, the orbital phases during the observations under consideration calculated using MJD from Galloway et al. (2004), and its pulsation periods determined by an epoch-folding technique after the photon arrival times were corrected for the motion of the Earth, the spacecraft, and the neutron star in the binary. As we see from Table. 1, the pulsation frequency of the source near the peak of the April 2003 (MJD 52760-52780) outburst is proportional to the flux from it. Since the observational data and the statistics are scarce (see, e.g., the measurements of the pulsation period during the December 2003 outburst), the significance of this result is low. However, it agrees with the ComptonGRO and RXTE measurements of the pulsation period during previous outbursts.
An analysis of the emission from X-ray pulsars indicates that their pulse profiles can strongly depend on the energy and intensity of the source (see, e.g., White et al. 1983; Nagase 1989; Lutovinov et al. 1994; and references therein). We studied the behavior of the pulse profile and the pulse fraction for KS 1947+300 as a function of its state. Figure 3 shows the phase light curves for the pulsar obtained from the IBIS/INTEGRAL data and averaged at different intensities: the flux from the source in the energy range 18-60 keV is (a) mCrab (MJD 52770), (b) mCrab (MJD 52994), and (c) mCrab (MJD 526005-52615). In the first case, the pulse profile is a single broad peak whose intensity decreases insignificantly with increasing phase. A finer profile structure (separation into several individual peaks) begins to show up as the intensity of the source decreases. During the observations on April 7, 2004 (MJD 53102), when the peak flux from the source in the energy range 18-60 keV was about 96 mCrab, the pulse profile had a shape identical to that shown in Fig. 3a.
For the subsequent analysis of the results obtained and their comparison with theoretical models, we should pass from fluxes to luminosities over a wide energy range. However, in most cases, this is difficult to do, because we have only hard X-ray data at our disposal. Therefore, to roughly estimate the bolometric luminosity of the pulsar during the INTEGRAL observations of the April-May 2003 outburst, we used the following method: assuming the main energy release to be in the energy range 2-100 keV and the distance to the object to be kpc, we determined its bolometric luminosity during the observations on April 7, 2004, when the source under study was also within the JEM-X field of view. The luminosity of the object can then be estimated from simple proportionality considerations by comparing the IBIS hard X-ray fluxes at this point and the point of interest. However, it should be understood that this estimate is valid only if the spectral shape is constant at the two points being compared. Thus, the pulse profiles shown in Fig. 3 correspond to the following approximate bolometric luminosities of the source: (a) , (b) , and (c) erg s-1, respectively.
For comparison, Fig. 4 shows the HEXTE/RXTE pulse profiles for KS 1947+300 in the energy range 18-60 keV. The observations were performed during the outburst of the source under study that began in December 2000. Each panel of this figure corresponds to the source’s mean bolometric luminosities of (a), (b), (c), (d), (e) erg s-1. A significant difference between this outburst and the outbursts detected by the INTEGRAL observatory is a factor of 3 longer duration and a factor of 4 higher intensity. Nevertheless, the behavior of the pulse profiles in this case is similar to that observed by INTEGRAL (Fig. 3). In the brightest state, the pulse profile is a single broad peak with its separation into two subpeaks at the vertex, one of which is much narrower than the other; the intensity of the profile decreases with increasing phase. As the luminosity of the source decreases, the separation into several subpeaks becomes increasingly distinct. When the luminosity of the object reaches erg s-1, the profile again becomes double peaked, with the mean peak shifting backward by approximately a quarter of the phase. This behavior of the profile may be attributable to different emission regimes, depending on the source’s luminosity (Basko and Sunyaev 1976). The PCA/RXTE data in the softer energy range also reveal such a dependence of the pulse shape on the source’s intensity, but it is not so distinct (see Fig. 3 from Galloway et al. 2004).
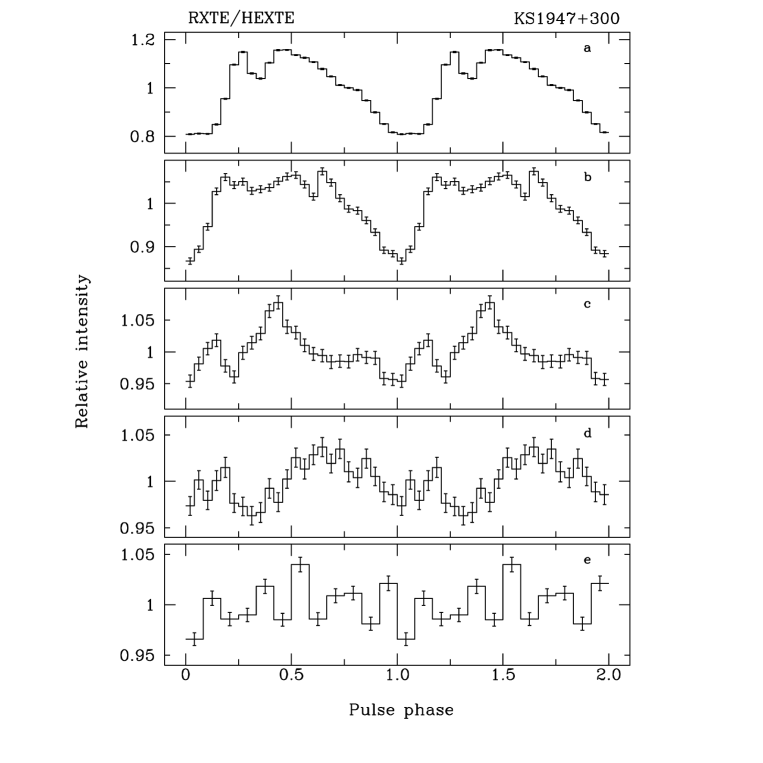
Figure 5 shows how the pulse profile for the object under study changes with energy range. Figures 5a and 5b present the phase light curves obtained from the PCA/RXTE observations on February 10, 2001 (MJD 51950); Fig. 5c shows the same light curves obtained from the HEXTE data averaged over the period during which the source was near maximum light (MJD 51941-51959). The relative intensity of the first peak increases with energy, but no significant changes in the shape were found.
Since the background cannot be properly determined at this time, we were unable to analyze the behavior of the pulse fraction using the IBIS/INTEGRAL data. Therefore, we used data from the HEXTE and PCA spectrometers of the RXTE observatory for such an analysis. In Fig. 6a, the pulse fraction, which is defined as , where and are the background-corrected count rates at the maximum and minimum of the pulse profile, is plotted against orbital phase; this dependence was obtained from the HEXTE data in the energy range 18-60 keV near the peak of the 2000-2001 outburst. We see that there is a minimum near a phase of 0.5. A similar, but slightly less distinct dependence is also typical of the PCA data in the energy range 3-20 keV (Fig. 6b). The small scatter of data points in pulse fraction at close orbit phases is attributable to the dependence of this parameter on the source’s intensity.
SPECTRAL ANALYSIS
As we showed in the previous section, the source KS 1947+300 exhibits a luminosity dependence of the pulse profile during X-ray outbursts. Therefore, it is of particular interest to study the spectral behavior of the object as a function of the outburst phase.
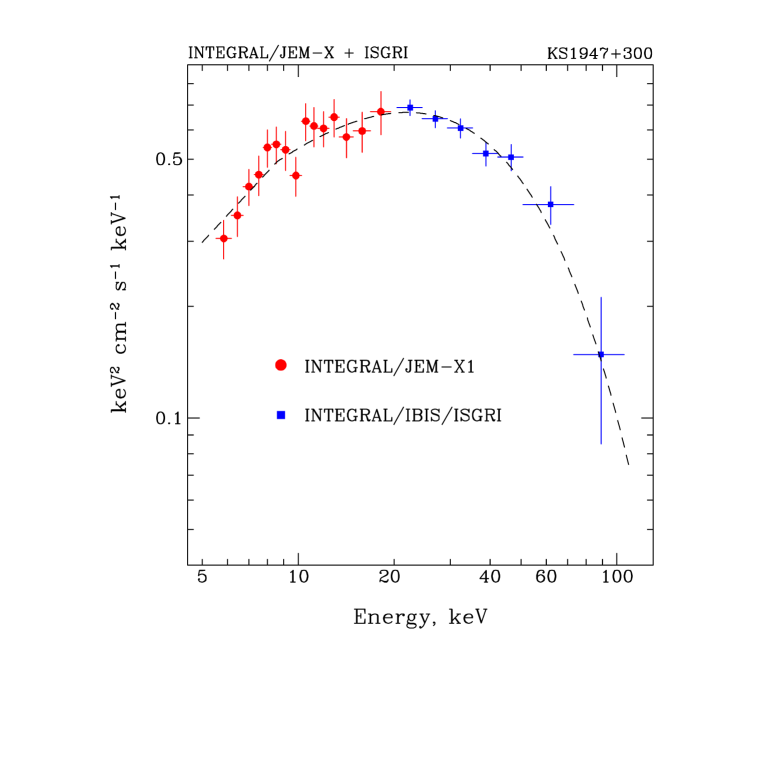
In the standard X-ray energy range, the pulsar KS 1947+300 was recorded at a statistically significant level by the JEM-X telescope of the INTEGRAL observatory only once, during the observations on April 7, 2004, when its bolometric luminosity was erg s-1. The spectrum of the source over a wide energy range is well described by a typical (for this class of objects) model that includes a simple power law with an exponential cutoff at high energies:
| (1) |
where is the photon energy in keV, is the normalization of the power-law component, is the photon spectral index, is the cutoff energy, and is the e-folding energy in the source’s spectrum. This model has long and widely been used to fit the spectra of X-ray pulsars (White et al. 1983). The energy spectrum of KS 1947+300 reconstructed from the JEM-X and IBIS data is shown in Fig. 7, and its best-fit parameters are given in Table 2.
During the remaining INTEGRAL observations, the pulsar was recorded at a statistically significant level only by the ISGRI detector of the IBIS telescope, and its spectrum could be reconstructed at energies above 18 keV. When the spectra of the source in these sessions were described by the bremsstrahlung model in all three cases (where the spectrum could be reconstructed), its temperature remained approximately the same, within the error limits, and equal to keV. Table 2 gives the best-fit parameters for the same spectra based on the model that was used above to describe the broad-band spectrum, but we fixed the parameters whose values were outside the ISGRI energy range at the values that we obtained when analyzing the spectrum measured on April 7, 2004. We see that the e-folding energy in the source’s spectrum (which is determined in this approach) remains almost constant. The relatively large value for some of the spectra is attributable to the poor statistics in these observations.
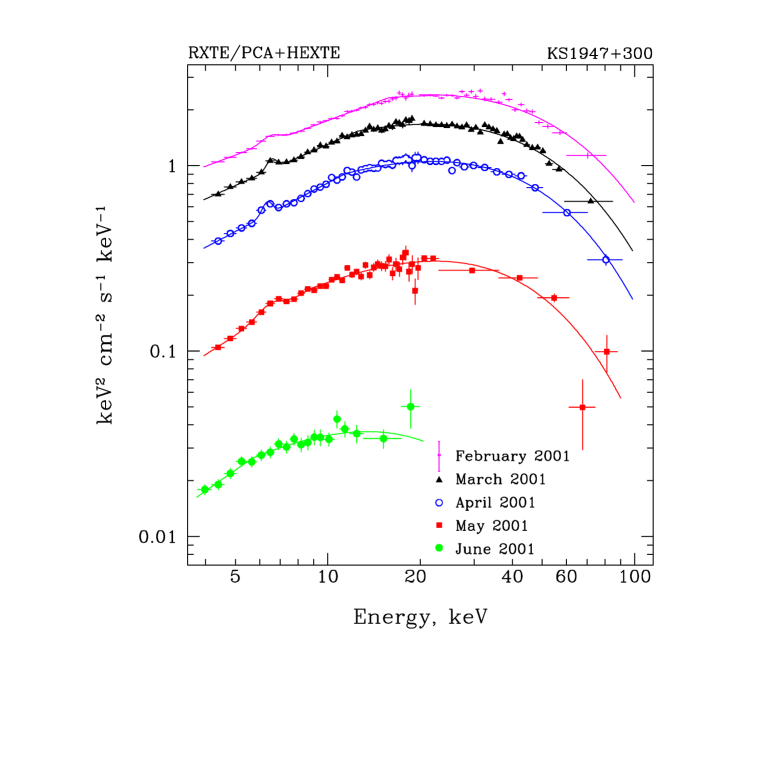
We used the RXTE data obtained during the 2000-2001 outburst to analyze the spectral behavior of the source over a wide energy range in mode detail. Figure 8 shows the energy spectra averaged over the same periods as those in which the pulse profiles were obtained (i.e., February, March, April, and May 2001, respectively); in June, the luminosity of the source was too low to reconstruct its spectrum from the HEXTE data, and only its soft part derived from the PCA data is shown in the figure. We used the PCA and HEXTE data for the energy ranges 4-20 and 20-100 keV, respectively. The RXTE data revealed a feature in the source’s spectrum related to the emission line of neutral iron (6.4 keV). The best-fit parameters for the pulsar’s spectra in different states are given in Table 2. Interestingly, as the intensity of the source decreases, its spectrum becomes slightly harder, while the characteristic energies and decrease (for the observations in June 2001, the fit is based only on the PCA data). A comparison of the data from the two observatories shows that the best-fit parameters for the INTEGRAL data obtained in April 2004 also fall on this dependence.
DISCUSSION
Evolution of the Pulse Profile
Basko and Sunyaev (1976) showed the existence of a critical luminosity ( erg s-1) that separates two accretion regimes: the regime in which the effect of radiation on the falling matter may be disregarded and the regime in which this effect is significant. For , the free-fall zone extends almost to the neutron-star surface, and the polar cap radiates mainly upward. In the opposite case (), accretion columns that are elongated along the magnetic field lines and that radiate predominantly sideways are formed at the poles.
Based on this model, Parmar et al. (1989) first explained the luminosity dependence of the pulse profile for the transient X-ray pulsar EXO 2030+375. These authors modeled the pulse profile using a simple geometric model where the radiation is emitted from the magnetic poles of a rotating neutron star displaced from its spin axis. The study was carried out over a wide luminosity range: from to erg s-1. It was pointed out that the upward-directed radiation becomes dominant as the source’s luminosity decreases.
For the pulsar KS 1947+300, the behavior of its pulse shape is similar to that described above. For our analysis, we took the IBIS and HEXTE data for two different outbursts with luminosity ranges and erg s-1, respectively. We consider the pulse profiles in the hard energy ranges due to their relative independence of external factors, in particular, the weaker dependence of the shape on the absorption far from the stellar surface. In both series of observations, the luminosity passes through its critical value of , which is reflected in the change of the pulse profile shape (see Figs. 3 and 4). At high luminosities (i.e., during the formation of accretion columns), one might expect the spectrum to be softer than that in the low state, as confirmed by our spectral analysis.
The Cyclotron Lines and the Magnetic Field
In searching for features in the source’s spectrum related to the resonance cyclotron absorption line, we added the corresponding component to the model fit in our spectral analysis. The energy of the line center was varied over the range 5-90 keV at a 5-keV step, and its width was fixed at 5 keV. Using the test, we found the most probable position of the possible cyclotron line at an energy of about 70 keV, but the significance of this feature does not exceed . Thus, we can presently conclude that either the sensitivity and effective exposure time of the modern INTEGRAL and RXTE instruments are not enough to detect the cyclotron line in the spectrum of KS 1947+300 or it lies outside the energy range 5-100 keV. If the latter is true, then the surface magnetic field of theneutron star must be either or G.
Evolution of the Pulsation Period
During outbursts in X-ray pulsars, the rate of accretion onto the neutron star increases significantly. In this case, a spin-up of the pulsar attributable to the increase in the amount of angular momentum transferred by the accreted matter to the neutron star can be observed, with the magnetic field strength of the neutron star playing an important role. A correlation between the rate of change in the pulse period and the X-ray luminosity during outbursts has now been found for seven transient sources (Galloway et al.2004; Baykal et al.2002, and references therein). As was noted above, during one of the outbursts observed by INTEGRAL (April 2003), there is a direct correlation between the flux from the source and its pulsation frequency similar to that observed by RXTE during the 2000-2001 outburst.
Based on the observed parameters of the pulsar KS 1947+300 during its outbursts, we can attempt to estimate its magnetic field strength and the distance to the binary using the model of a magnetized neutron star (Ghosh and Lamb 1979). The following relation must hold in the case of accretion from the disk:
| (2) |
where is the magnetic moment of the neutron star with a magnetic field and radius , is a dimensionless function that depends on the fastness parameter , is the distance to the binary, and is the X-ray flux from it.
In Fig. 9, the rate of change in the pulsation frequency is plotted against the flux recorded from KS 1947+300. The circles in the figure correspond to the measured spin-up and spin-down rates of the pulsar near the peak of the April-May 2003 outburst, as inferred from INTEGRAL data, and the spin-up rate of the pulsar during the outburst of 2000-2001, as inferred from the RXTE data. When fitting these data by the function given by Eq. (2), we fixed the mass and radius of the neutron star at and cm, respectively. As a result, we obtained the following values: the distance to the source kpc and the magnetic field of the neutron star G, which corresponds to the position of the cyclotron feature in the object’s spectrum at an energy of about 220 keV. The derived values agree with the distance to the binary estimated from optical observations (Negueruela et al. 2003) and with the magnetic field strength estimated by analyzing the source’s spectra (see above). It should be noted that we used the expression for the dimensionless angular momentum from the paper by Li and Wang (1996). When the function suggested by Ghosh and Lamb (1979) is used as a fit to , the magnetic field strength proves to be slightly smaller, G, but the distance to the binary increases significantly, kpc. If the latter parameter is fixed at 10 kpc, then the surface magnetic field of the neutron star decreases to G, but the quality of the fit to the data points in Fig. 9 deteriorates significantly.
As was noted in the Introduction, the mean spin-down rate of the pulsar KS 1947+300 is low enough for its pulsation period to be considered close to the equilibrium value. In the case of disk accretion, this period is then related to the parameters of the neutron star as follows: s (Lipunov 1987). Assuming that the the source’s luminosity is erg s-1 and the pulsation period is s, we obtain a magnetic field strength of G, in good agreement with the above estimates.
ACKNOWLEDGMENTS
We wish to thank E.M. Churazov, who developed the methods and software for analyzing the data from the IBIS telescope of the INTEGRAL observatory. We also wish to thank M.G. Revnivtsev for help in processing the RXTE data and valuable remarks and discussions. This work was supported by the Ministry of Industry and Sciences (grant no. NSh-2083.2003.2 from the President of Russia and project no. 40.022.1.1.1102) and the Russian Foundation for Basic Research (project nos. 02-02-17347 and 04-02-17276). We used the data retrieved from the High-Energy Astrophysics Archive at the Goddard Space Flight Center of NASA and the data retrieved from the Archive of the INTEGRAL Science Data Center (Versoix, Switzerland) and the Russian INTEGRAL Science Data Center (Moscow Russia).
REFERENCES
1. M. M. Basko and R. A. Sunyaev, MNRAS 175, 395 (1976).
2. A. Baykal, M. J. Stark, and J. H. Swank, Astrophys. J. 569, 903 (2002).
3. K. N. Borozdin, M. R. Gilfanov, R. A. Sunyaev, et al.Sov. Astron. Lett. 16, 345 (1990) [Pis’ma Astron. Zh. 16, 804 (1990)].
4. H. V. Bradt, R. E. Rothschild, and J. H. Swank, Astron. Astrophys. Suppl. Ser. 97, 355 (1993).
5. D. Chakrabarty, T. Koh, L. Bildsten, et al., Astrophys. J. 446, 826 (1995).
6. D. K. Galloway, E. H. Morgan, and A. M. Levine, Astrophys. J., (2004) (in press); astro-ph/0401476.
7. P. Ghosh and F. Lamb, Astrophys. J. 234, 296 (1979).
8. V. M. Kaspi and F. P. Gavriil, Astrophys. J. 596, L71 (2003).
9. A. Krawczyk, A. G. Lyne, J. A. Gil, et al., MNRAS 340, 1087 (2003).
10. F. Lebrun, J. P. Leray, P. Lavocat, et al., Astron. Astrophys. 411, L141 (2003).
11. X.-D. Li and Z.-R. Wang, Astron. Astrophys. 307, L5 (1996).
12. V. M. Lipunov, Astrophysics of Neutron Stars (Nau- ka, Moscow, 1987)[in Russian].
13. N. Lund, S. Brandt, C. Budtz-Joergesen, et al., As- tron. Astrophys. 411, L231 (2003).
14. A. A. Lutovinov, S. A. Grebenev, R. A. Sunyaev, et al., Astron. Lett. 20, 538 (1994) [Pis’ma Astron. Zh. 20, 631 (1994)].
15. A. A. Lutovinov, S. V. Molkov and M. G. Revnivstev, Astron. Lett. 29, 713 (2003) [Pis’ma Astron. Zh. 29, 803 (2003)].
16. F. Nagase, Publ. Astron. Soc. Japan 41, 1 (1989).
17. I. Negueruela, G. L. Israel, A. Marco, et al., Astron. Astrophys. 397, 739 (2003).
18. A. N. Parmar, N. E. White, and L. Stella, Astrophys. J. 338, 373 (1989).
19. M. G. Revnivstev, R. A. Sunyaev, D. A. Varshalovich, et al., Astron. Lett. 30, 382 (2004) [Pis’ma Astron. Zh. 30, 430 (2004)].
20. J. Swank and E. Morgan, IAU Circ. No. 7531 (2000).
21. P. Ubertini, F. Lebrun, G. Di Cocco, et al., Astron. Astrophys. 411, L131 (2003).
22. N. White, J. Swank, and S. Holt, Astrophys. J. 270, 771 (1983).
23. C. Winkler, T. J.-L. Courvoisier, G. Di Cocco, et al., Astron. Astrophys. 411, L1 (2003).
Table 1. IBIS observationsa of the pulsar KS 1947+300
| Time of observations, MJD | Orbital phase | Flux, mCrab | Period, s |
|---|---|---|---|
| 52605–52615 | 0.33–0.58 | 4.50.3 | 18.6690.001 |
| 52723 | 0.25 | 6.92.1 | – |
| 52746 | 0.82 | 12.12.3 | – |
| 52761 | 0.19 | 64.02.8 | 18.7210.005 |
| 52770 | 0.42 | 77.82.7 | 18.7180.002 |
| 52782 | 0.71 | 67.82.3 | 18.7210.002 |
| 52797 | 0.08 | 15.32.0 | – |
| 52806 | 0.31 | 6.32.5 | – |
| 52821 | 0.68 | 7.72.3 | – |
| 52970 | 0.36 | 31.013.9 | – |
| 52985 | 0.74 | 69.83.4 | 18.7270.002 |
| 52994 | 0.96 | 47.52.4 | 18.7250.002 |
| 53019 | 0.58 | 6.32.1 | – |
| 53102 | 0.65 | 96.12.9 | 18.7300.002 |
| In the energy range 18-60 keV. | |
| Cannot be determined due to the poor statistics. |
Table 2. Best-fit parameters for the spectrum of KS 1947+300
| Date | , keV | , keV | , keV | ||
| Based on INTEGRAL (IBIS) data | |||||
| MJD 52605–52630 | – | 2.91(7) | |||
| MJD 52770 | – | 2.30(7) | |||
| MJD 52985 | – | 0.66(7) | |||
| Based on INTEGRAL (JEM-X + IBIS) data | |||||
| MJD 53102 | – | 1.18(104) | |||
| Based on RXTE (PCA + HEXTE) data | |||||
| February 2001 | 1.33(98) | ||||
| March 2001 | 1.34(112) | ||||
| April 2001 | 0.99(117) | ||||
| May 2001 | 1.03(117) | ||||
| June 2001 | – | 0.63(35) | |||
| All errors are given at the 1 level. | |
| The position of the line center. | |
| The value normalized to the number of degrees of freedom N. | |
| The parameters are fixed. | |
| Based only on PCA (3-20 keV) data. |