HIGHLY IONIZED HIGH-VELOCITY CLOUDS: HOT INTERGALACTIC MEDIUM OR GALACTIC HALO?
Abstract
We use spectroscopic data from HST and FUSE to study the wide range of ionization states of the “highly ionized high-velocity clouds”. Studied extensively in O VI absorption, these clouds are usually assumed to be infalling gas in the Galactic halo at distances less than 50 kpc. An alternative model attributes the O VI (and O VII X-ray absorption) to cosmological structures of low-density, shock-heated intergalactic gas, distributed over 1–3 Mpc surrounding the Milky Way. The latter interpretation is unlikely, owing to the enormous required mass of gas (). Our detection, in 9 of 12 sight lines, of low ionization stages (C II/III/IV; Si II/III/IV) at similar high velocities as O VI requires gas densities far above that ( cm-3) associated with the warm-hot intergalactic medium (WHIM). These HVCs are probably cooling, multiphase gas in the Galactic halo, bow-shocks and interfaces between clouds falling through a hot, rotating gaseous halo. The velocity segregation of these HVCs in Galactic coordinates is consistent with a pattern in which infalling clouds reflect the sense of Galactic rotation, with peculiar velocities superposed.
Subject headings:
Galaxy: halo — ISM: clouds — ISM: abundances — quasars: absorption lines1. INTRODUCTION
This paper deals with a select population of highly ionized Galactic high-velocity clouds (HVCs), originally discovered in C IV (Sembach et al. 1999) and studied in considerable detail in O VI and other ions (Sembach et al. 2003; Collins, Shull, & Giroux 2004 – hereafter denoted S03 and CSG04). Most observers assume that this high-velocity O VI is associated with infalling clouds in the Galactic halo, including well-known objects such as the Magellanic Stream and Complex C. However, in an alternative interpretation, Nicastro et al. (2002, 2003) suggest that the high-velocity O VI, together with the X-ray absorption from O VII, arise in the warm-hot intergalactic medium (WHIM) surrounding the Galaxy. In their model, the O VI and O VII co-exist in a filament of shock-heated intergalactic medium (IGM), distributed over 1–3 Mpc from the Local Group at very low hydrogen densities, cm-3, and high temperatures, K.
The HVCs possess velocities incompatible with differential Galactic rotation (Wakker & van Woerden 1997) and are normally detected through their H I 21-cm emission. They display a variety of different morphologies, ranging from large cloud complexes such as HVC Complex C (Wakker et al. 1999; Gibson et al. 2001; Richter et al. 2001; Collins et al. 2003; Tripp et al. 2003) to objects with small angular sizes such as the compact HVCs (CHVCs; Putman et al. 2002). The recent Far Ultraviolet Spectroscopic Explorer (FUSE ) survey (S03) of O VI reveals that high-velocity gas can be detected in O VI resonance absorption lines in % of quasar sight lines. Although some of the O VI correlates with H I-detected HVCs with column densities (H I) cm-2, the S03 survey catalogs a new class of HVCs with H I column densities below the detection threshold of single-dish radio telescopes. Following the convention established in early studies of such objects, we refer to the O VI HVCs without H I 21-cm detections as the “highly ionized HVCs”. Sembach et al. (1995, 1999) analyzed HST-Goddard High Resolution Spectrograph (GHRS) data and found that these absorbers are characterized by strong C IV absorption, accompanied by little or no absorption in low ions, hence the term “highly ionized.” Studies of the O VI HVCs have recently been reviewed by Sembach (2004).
As is the case with most of the larger population of HVCs, the origin of the highly ionized HVCs is uncertain because their distances are unknown. Although the more extended HVC complexes must reside in or near the Galactic halo ( kpc), one theory posits that the smaller-angular-size CHVCs could be located at large distances ( Mpc) within the Local Group (Blitz et al. 1999; Braun & Burton 1999). Since the highly ionized HVCs are isolated absorbers, unconnected to extended objects mapped in H I, it is possible that such objects share a similar distribution as proposed for the CHVCs within the Local Group. In fact, when the absorption in these objects in species ionized to C IV and below has been modeled with single-phase photoionization models, the inferred densities ( cm-3) and pressures ( cm-3 K) suggest a Local Group location (Sembach et al. 1999; CSG04). However, the simultaneous O VI and C IV detections in HVCs imply a significant collisionally ionized component, arising from immersion in a surrounding hotter medium (CSG04; Fox et al. 2004, hereafter F04). When we attribute both the O VI and C IV absorption in the highly-ionized HVCs to the collisionally ionized component, the photoionized component can be considerably denser ( cm-3), with pressures more indicative of a Galactic halo location in which cm-3 K.
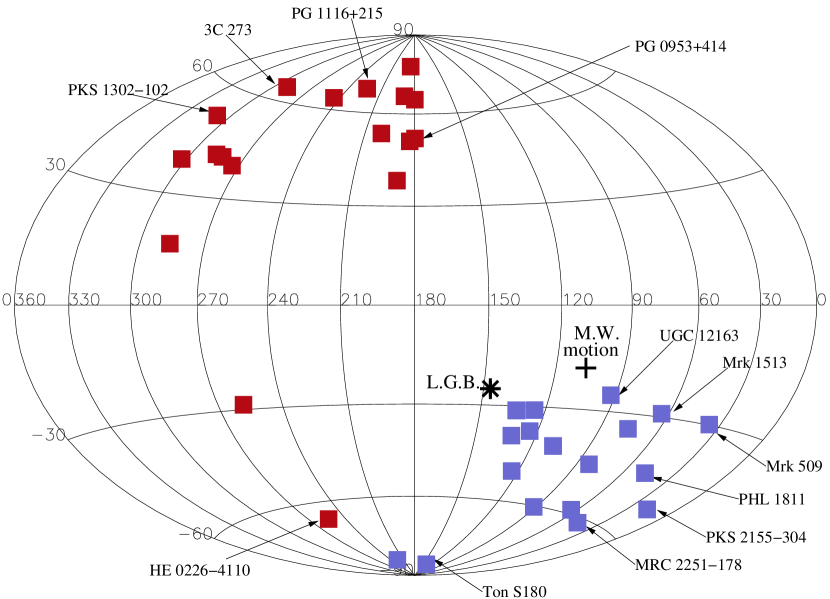
In contrast, Nicastro et al. (2002, 2003) suggest that the high-velocity O VI absorbers trace large-scale (Local Group) filaments of the low-density ( cm-3) WHIM. Cosmological simulations predict that a large fraction of the baryons in the low-redshift IGM are in the form of shock-heated ( K) low-density structures (Cen & Ostriker 1999; Davé et al. 1999). The Nicastro et al. (2003) model for the absorbers is based on an interpretation of two observations. The first comes from the kinematics of the high-velocity O VI absorbers, which suggest a preferred reference frame relative to the Local Group barycenter instead of the Galaxy. We discuss this issue in depth in § 4.1 (see also Fig. 1 for the locations and redshifts/blueshifts of the highly-ionized HVC sight lines, including the 12 we have studied). The second important observation is the detection of poorly-resolved O VII and O VIII X-ray absorption lines at towards PKS 2155304, 3C 273, H 1821+643, and Mrk 421 (Fang et al. 2002; Fang, Sembach, & Canizares 2003; Mathur, Weinberg, & Chen 2003; Nicastro et al. 2004) and the speculation that this absorption can be associated with the O VI HVCs in those sight lines. McKernan, Yaqoob, & Reynolds (2004) recently discussed O VII absorption at towards 15 AGN.
A number of important astrophysical issues are at stake in these two models, which for simplicity we classify as the WHIM and the Galactic halo. Among these issues are: (1) the total mass in HVCs, which depends on the square of the assumed distance; (2) the role of HVCs in Galaxy assembly, gaseous infall, and chemical evolution; and (3) the possible connection between UV tracers of K gas (O VI, Ne VIII) and X-ray tracers of much hotter gas at K (O VII, O VIII, etc). The last issue could provide a connection between O VI studies of Galactic HVCs and cosmological measurements of the baryon content in the multiphase IGM at low redshift (Shull 2003; Nicastro et al. 2003; Stocke, Shull, & Penton 2004).
The Nicastro et al. (2002, 2003) conclusions have been disputed (CSG04; Sembach 2004), since many O VI HVCs are correlated in velocity and space with known Galactic-halo HVCs mapped in H I 21 cm emission. More significantly, HST and FUSE detections (CSG04) of low ions at the same velocities as O VI require gas densities much higher than those in the WHIM. For example, the existence of C II and Si II in the highly ionized HVCs towards PKS 2155304 suggests a characteristic hydrogen density cm-3, and models of the HVC Complex C (Collins, Shull, & Giroux 2003, hereafter CSG03) suggest 0.01–0.1 cm-3. CSG04 argue that the data are best explained if the PKS 2155304 highly ionized HVCs are low total-hydrogen column density analogs of the Galactic halo HVCs detected in 21 cm emission, rather than diffuse WHIM filaments.
In order to assess possible origins for the highly ionized HVCs, it is important to consider the population as a whole, instead of focusing on individual sight lines. We consider the statistics of a sample of 12 highly ionized HVCs, none of which is directly associated with known nearby 21 cm structures (S03). From these sight lines, we can better investigate whether the population traces the WHIM, or instead is a low-column version of the Galactic halo HVCs. Our previous study (CSG04) investigated highly ionized HVCs in two sight lines, PKS 2155304 and Mrk 509, and found low-ionization absorbers in both cases. In this paper, we present FUSE and HST Space Telescope Imaging Spectrograph (STIS) data for ten more sight lines containing highly ionized HVCs detected in the S03 survey. We have now analyzed 12 such sight lines, nine of which show low-ionization species at the same velocity as O VI.
The FUSE mission and instrument are discussed in Moos et al. (2000) and Sahnow et al. (2000). In § 2, we present the sight-line selection criteria and data-reduction procedures. The ion species detections and column density measurements for each sight line are reported in § 3. In § 4, we discuss the results and investigate the ionization pattern in the HVCs via photoionization and collisional ionization models. We present our conclusions in § 5.
2. SIGHT LINE SELECTION AND DATA
The ten sight lines selected for this work were chosen from the FUSE survey of high-velocity O VI absorption (S03). In this work, we include all sight lines from that survey with good quality STIS E140M and G140M data that are publicly available as of early April 2004. Using this criterion, we can analyze a variety of resonance lines beyond those available in the FUSE data alone. Absorption lines of O I, C II, and Si II in the STIS bandpass are typically much stronger111The strength of a resonance line is quantified by the product, , of oscillator strength and wavelength (Morton 2003). than lines in the FUSE bandpass, and thus are more sensitive for measurement of the low column densities typical of highly ionized HVCs. We include only the sight lines with FUSE data quality of per 20 km s-1 resolution element (those with a data quality factor in Table 1 of S03). This requirement eliminates only one sight line, Mrk 926, from this study. For Mrk 926, we detect high-velocity Si III in the STIS G140M data associated with the reported high-velocity O VI detection from S03. However, we are unable to measure (O VI) of this absorber above the 3 threshold. A summary of the FUSE and HST observations is given in Table 1.
| FUSE | FUSE | HST-STIS | HST | HST-STIS | ||
|---|---|---|---|---|---|---|
| Sightline | Program ID | (ks)aaEffective exposure time for the LiF1a channel. | Grating | Program ID | (ks) | |
| 3C 273 | P101 | 43.2 | E140M | 8017 | 18.7 | |
| HE 0226-4110 | P101, D027 | 192.6 | E140M | 9184 | 43.8 | |
| MRC 2251-178 | P111 | 51.4 | G140M | 7345 | 6.0, 4.6bbThe G140M observations are taken at two separate grating tilts. The two listed exposure times are for central wavelengths of 1222 Å and 1272 Å, respectively. | |
| Mrk 1513 | P101 | 22.5 | G140M | 7345 | 6.2, 7.3bbThe G140M observations are taken at two separate grating tilts. The two listed exposure times are for central wavelengths of 1222 Å and 1272 Å, respectively. | |
| PG 0953+414 | P101 | 74.4 | E140M | 7747 | 24.5 | |
| PG 1116+215 | P101 | 76.7 | E140M | 8097, 8165 | 39.9 | |
| E230M | 8097 | 5.6 | ||||
| PHL 1811 | P108, P207 | 75.7 | E140M | 9418 | 18.4 | |
| G230MB | 9128 | 1.2 | ||||
| PKS 1302-102 | P108 | 145.9 | E140M | 8306 | 22.1 | |
| Ton S180 | P101 | 16.9 | G140M | 7345 | 4.1, 3.5bbThe G140M observations are taken at two separate grating tilts. The two listed exposure times are for central wavelengths of 1222 Å and 1272 Å, respectively. | |
| G230MB | 9128 | 1.2 | ||||
| UGC 12163 | B062 | 60.9 | E140M | 8265 | 10.3 |
Calibrated FUSE spectra were extracted by passing raw data through the CALFUSE Version 2.4 reduction pipeline. In order to improve the signal-to-noise ratio (S/N), both “day” and “night” photons were included in the final calibrated FUSE spectra. The inclusion of day photons leads to strong airglow contamination of certain neutral interstellar lines near the local standard of rest (LSR). Such airglow contamination is irrelevant for the purpose of investigating high-velocity absorption in this study. Individual exposures were then co-added and weighted by their exposure times, to yield a final FUSE spectrum. The FUSE spectra have a resolution over the FUSE bandpass (912-1187 Å) of about 20 km s-1 ( pixels), and as a result the data are oversampled at that resolution. In order to further improve S/N, the data were rebinned over 5 pixels. To set the absolute wavelength scale, the centroid of Galactic H I 21-cm emission was compared and aligned to various Galactic absorption lines in the FUSE bandpass, such as Si II (1020.70), O I (1039.23), Ar I (, ), Fe II (, ), N I (1134.17), and various H2 Lyman bands.
The HST STIS data consist of observations taken with several different gratings. The E140M echelle mode, which provides 7 km s-1 resolution, is the preferred grating for this work owing to its bandpass, 1150 – 1700 Å, which covers resonance lines of several important ion species. Seven of the ten sight lines in this survey were observed in the E140M mode. The PG 1116+215 sight line was observed in both the E140M and E230M echelle modes. The E230M observations of this sight line provide 10 km s-1 resolution over 2010 – 2820 Å, which covers several Fe II and Mg II lines. The rest of the data consist of observations taken with the first-order G140M grating at 25 km s-1 resolution. The G140M data were all taken for Program 7345, which investigated the low- Ly forest in sight lines of quasars at (Penton, Stocke, & Shull 2004). In each case, the G140M observations were taken at two separate tilts, resulting in a wavelength coverage, 1195 – 1299 Å, which includes resonance lines of N I, Si III, N V, S II, and Si II. In two cases, we supplement the E140M and G140M data with observations taken with the G230MB grating, covering Å including the Mg II doublet at 2800 Å at a resolution of km s-1. Final STIS spectra were obtained by co-adding individual exposures, weighted by their exposure times. The E140M and E230M echelle data were rebinned over 3 pixels, while no rebinning was used for the first-order G140M and G230MB spectra. Absolute wavelength scales were obtained as for the FUSE spectra, matching the Galactic H I emission peak to absorption features of N I (1199.55, 1200.71), S II (1250.58, 1253.80, 1259.52), Fe II (1608.45, 2374.46, 2586.65), and Mg II (2796.35, 2803.53). We estimate that, with our technique of registering interstellar lines to 21 cm emission, the absolute wavelength scales of both the STIS and FUSE data are accurate to km s-1 (Penton et al. 2000; Indebetouw & Shull 2004; Savage et al. 2005).
3. COLUMN DENSITY MEASUREMENTS
In the following subsections, we discuss results for HVCs in the ten sight lines considered in this survey. Since the goal of this study is to ascertain the physical conditions of these absorbers and their environments, it is crucial to determine column densities of ion species using UV resonance lines. From the full FUSE and HST STIS spectra, we extract individual line profiles and normalize them by fitting low-order polynomials to the continuum immediately surrounding the line in question. Typically, we fit the continuum Å about the rest wavelength of the line, although in a number of cases spurious absorption near the line required the use of a much larger wavelength band for continuum measurement. There are many useful resonance lines in the FUSE and HST STIS bandpass. However, given the column densities typical of the highly-ionized HVCs and the sensitivity of the observations, the ion species that could provide reliable constraints on the HVC characteristics include O VI, N V, C IV, Si IV, Si III, C III, N III, C II, Si II, Fe II, Mg II, N II, and O I. We have not detected any N V, which is typically weak relative to the other high ions.
Because the HVC line profiles typically become broader at higher ionization states, we generally use the velocity extent of the high-velocity O VI to establish the HVC integration range. We use the apparent optical depth (AOD) method, valid for unsaturated lines (Savage & Sembach 1991), to measure column densities from the line profiles. Line saturation can be difficult to detect, particularly if such saturation is unresolved. For these absorbers, most of the profiles are consistent with the optically thin limit for the AOD method. The exceptions are the strong lines of C III and Si III , which are frequently saturated. In those cases, resulting AOD column density measurements are taken as lower limits. We have taken care that none of the measured absorption features include IGM contamination. In several cases, the negative high-velocity O VI profiles are contaminated by weak absorption from the Lyman [L(6-0)P(3)] Galactic H2 line at 1031.19 Å. To remove this contamination, we determine the optical depth, , of other H2 () lines in the FUSE bandpass and infer the optical depth of L(6-0)P(3) based on its relative value of (Abgrall et al. 1993a,b). The line widths of the various lines are then used to subtract off the appropriate integrated for the contaminating absorption.
The FUSE bandpass covers H I Lyman lines from Ly down to the Lyman limit, which can be used to constrain the H I column density of the HVC under certain circumstances. In our previous study (CSG04), the measured HVC column densities based on Lyman-line absorption were crucial in constraining photoionization models. In this work, however, we are unable to measure H I Lyman lines for the HVCs, except in the case of PG 1116+215. The two factors preventing these measurements include the common occurrence of poor quality in the SiC channels and blending of HVC with Galactic H I absorption.
3.1. 3C 273

| aaWavelengths and oscillator strengths are from Morton (2003). | log bbAll column densities are calculated through the apparent optical depth method. The HVC occupies the velocity range km s-1 based on the O VI profile. All upper limits are 3 levels. | |||
|---|---|---|---|---|
| Species | (Å) | (mÅ) | ( in cm-2) | |
| O VI | 1031.926 | |||
| N V | 1238.821 | |||
| C IV | 1548.203 | |||
| Si III | 1206.500 | |||
| C II | 1334.532 | |||
| Si II | 1260.422 |
Owing to its bright UV flux and flat continuum, 3C 273 is a showcase spectrum for FUSE and HST studies of absorption from interstellar, intergalactic, and high-velocity gas. Sembach et al. (2001) detect a positive-velocity wing to Galactic O VI absorption, but no corresponding absorption in other ion species in their FUSE and HST GHRS data. They conclude that the O VI wing most likely traces hot gas flowing from the Galactic disk in a Galactic fountain. Since that study, Tripp et al. (2002) presented STIS E140M data for their study of absorbers within the Virgo Cluster. Using the FUSE and STIS E140M data, we searched for the positive velocity wing in other absorption lines besides O VI.
Line profiles for several key absorption lines are shown in Figure 2. The positive velocity wing can be detected only in O VI. We use the O VI absorption range km s-1 as the range of integration to establish 3 upper limits on column densities involving other species, with results of these measurements shown in Table 2. It is possible that some of the high-velocity O VI absorption arises from the H2 L(6-0)R(4) line at 1032.35 Å. The spectrum shows strong interstellar H2 lines from rotational levels, but no absorption from lines. Thus, we can be reasonably confident that nearly all of the absorption wing arises from high-velocity O VI. The integration range in the C II profile is partially contaminated by the C II∗ line. Since the velocity range km s-1 shows no high-velocity C II absorption, we can say with confidence that the optical depth over km s-1 is entirely from interstellar C II∗. As a result, we use the measured optical depth over the entire integration range to establish a conservative upper limit on (C II). We could not measure C III 977 because of contamination from Ly in an intergalactic absorber at .
3.2. HE 0226-4110

| aaWavelengths and oscillator strengths from Morton (2003). | log bbAll column densities are calculated through the apparent optical depth method. The HVC occupies the velocity range km s-1 based on the various line profiles. All upper limits are 3 levels. | |||
|---|---|---|---|---|
| Species | (Å) | (mÅ) | ( in cm-2) | |
| O VI | 1031.926 | |||
| N V | 1238.821 | |||
| C IV | 1550.770 | |||
| Si IV | 1393.755 | |||
| C III | 977.020 | ccBecause some saturation is indicated in the line profile, the total column density may be slightly higher. | ||
| Si III | 1206.500 | ccBecause some saturation is indicated in the line profile, the total column density may be slightly higher. | ||
| C II | 1334.532 | |||
| Si II | 1260.422 |
High-quality FUSE and HST STIS E140M data exist for the HE 02264110 sight line. A very detailed study of high-velocity gas in this sight line is presented by Fox et al. (2005, in preparation). Line profiles for several absorption lines (Fig. 3) clearly show a high-velocity component over the velocity range, km s-1 . There is evidence for a component centered at km s-1, just below what is formally considered “high velocity”. It is detected in O VI, C III, Si III, C II, and Si II. Absorption at this velocity in C IV is due to contamination by O VI absorption intrinsic to the QSO. Because this feature is probably blended with low-velocity and Galactic absorption, we concentrate our effort on the truly high velocity absorption. The high-velocity feature is detected in O VI, C IV, Si IV, C III, Si III, C II, and Si II. Column density measurements involving these species are shown in Table 3. This HVC is detected in C IV, since high-velocity absorption is detected over the appropriate velocity range for both lines of the doublet. We measured C IV from only, since the profile of is contaminated by the AGN intrinsic O VI. The C III profile shows evidence of saturation, indicating that the measured column density is likely a lower limit. While the profile for Si III binned to 3 pixels (Fig. 3) does not seem saturated, the unbinned data do suggest that saturation over a narrow velocity range is likely. We take the measured (Si III) as a lower limit for the modeling in § 4. Although the integration range in the C II profile is badly contaminated by Galactic C II∗ absorption, the 1334.53 Å profile is contaminated only at km s-1 . As a result, the column density of C II for the HVC can easily be measured.
3.3. MRC 2251178

| aaWavelengths and oscillator strengths are from Morton (2003). | log bbAll column densities are calculated through the apparent optical depth method. The HVC occupies the velocity range km s-1 based on the various line profiles. All upper limits are 3 levels. | |||
|---|---|---|---|---|
| Species | (Å) | (mÅ) | ( in cm-2) | |
| O VI | 1031.926 | |||
| N V | 1238.821 | |||
| Si III | 1206.500 | |||
| C II | 1036.337 |
The MRC 2251178 sight line has been observed both with FUSE and the G140M grating on HST STIS. Figure 4 shows line profiles for several absorption lines. Two negative-velocity O VI HVCs were identified (S03) in this sight line, centered at and km s-1. The HVC at km s-1 is clearly detected in Si III and C II. If the km s-1 trough is indeed an HVC, it is difficult to assign a minimum velocity cutoff since the absorption is blended with Galactic O VI. Absorption at the same velocity cannot be detected in Si III, although weak absorption in the C II profile may be attributed to an HVC at such a velocity. Fluctuations in the spectrum over 1035–1038 Å make the continuum in this part of the profile somewhat uncertain. Since the O VI absorption cannot be conclusively distinguished from Galactic absorption at km s-1 , we concentrate our efforts on the HVC at km s-1 . Column density measurements for the HVC detected in O VI over the range km s-1 are shown in Table 4. Although there is H2 in the spectrum, we can rule out H2 contamination of the O VI and C II profiles, since absorption in lines of and cannot be detected in other parts of the spectrum. Because of poor data in the FUSE SiC channels, we cannot properly analyze the C III line.
3.4. Mrk 1513

| aaWavelengths and oscillator strengths are from Morton (2003). | log bbAll column densities are calculated through the apparent optical depth method. The HVC occupies the velocity range km s-1 based on the various line profiles. All upper limits are 3 levels. | |||
|---|---|---|---|---|
| Species | (Å) | (mÅ) | ( in cm-2) | |
| O VI | 1031.926 | |||
| N V | 1238.821 | |||
| C III | 977.020 | |||
| Si III | 1206.500 | |||
| C II | 1036.337 |
Markarian 1513 has been observed with FUSE , as well as with the STIS G140M grating. Profiles for several important absorption lines are shown in Figure 5. The high-velocity O VI component is strong and extends over a width of nearly 200 km s-1 . The O VI profile shows evidence of a two-component structure, though S03 identify the narrow trough centered near km s-1 as arising from the H2 L(6-0)P(3) line at 1031.19 Å. However, our analysis of other H2 lines in the FUSE bandpass indicates that some of that absorption must arise from high-velocity O VI. The C III and Si III profiles show absorption at this velocity and seem to confirm the presence of the lower-velocity component. The absorption attributed to high-velocity O VI after H2 removal is shown in the shaded regions in Figure 5.
Column density measurements for the HVC detected in O VI over the range km s-1 are shown in Table 5. The C III profile clearly indicates saturation for the high-velocity component, which extends beyond the velocity width of the O VI absorption. We take the measured column density over the integration width of the high-velocity O VI as the lower limit on (C III). We do not detect high-velocity absorption in C II . The feature at km s-1 is likely from H2 L(6-0)P(4) at 1035.18 Å. The low-significance absorption at km s-1 cannot be conclusively identified as high-velocity C II, since the feature cannot be detected in both LiF channels. We note, however, that the FUSE data for Mrk 1513 are among the worst in our sample. Comparing to the results for MRC 2251178, where we measure an identical high-velocity (Si III), the data for Mrk 1513 would be of insufficient quality to measure a high-velocity C II component comparable to that in the MRC 2251178 sight line. The nondetection of high-velocity C II in this sight line is not surprising, given the data quality. The other key single-ion resonance line, Si II , cannot be analyzed, owing to severe contamination from Galactic S II . It would certainly help the modeling of this HVC to obtain data for C IV and Si IV.
3.5. PG 0953+414

| aaWavelengths and oscillator strengths are from Morton (2003). | log bbAll column densities are calculated through the apparent optical depth method. The HVC occupies the velocity range km s-1 based on the various line profiles. All upper limits are 3 levels. | |||
|---|---|---|---|---|
| Species | (Å) | (mÅ) | ( in cm-2) | |
| O VI | 1031.926 | |||
| N V | 1238.821 | |||
| C IV | 1548.203 | |||
| Si IV | 1393.755 | |||
| Si III | 1206.500 | |||
| C II | 1334.532 | |||
| Si II | 1260.422 |

High-quality FUSE and STIS E140M data exist for the PG 0953+414 sight line. Fox et al. (2005, in preparation) presents a very detailed study of high-velocity gas in this sight line. Profiles of absorption lines for several ion species are shown in Figure 6. The O VI profile shows positive high-velocity absorption extending to a maximum velocity of km s-1 . Based on its O VI profile, S03 identify the high-velocity component as a positive-velocity wing to Galactic absorption, possibly tracing hot Galactic fountain gas. Detections of lower ions in the STIS bandpass indicate that this identification is not likely and suggest that the high-velocity absorption traces a discrete HVC. Absorption is clearly detected in C IV and Si III, extending over a more narrow velocity range than the high-velocity O VI absorption. We use the minimum velocity cutoff for the C IV and Si III absorption to establish O VI integration limits of km s-1 . High-velocity absorption is detected in C II as well, although some contamination from C II is likely at km s-1 . Since the absorption features up to km s-1 are also detected in Si III and C IV, we can attribute absorption in this velocity range to high-velocity C II with high confidence. We do not believe the absorption centered at km s-1 in the Si II profile is from high-velocity gas, since the feature is not detected in other profiles. Because of blending from saturated Galactic absorption, this HVC has not been studied in C III . Column density measurements for the HVC detected in O VI over the range km s-1 are shown in Table 6.
Finally, we note the new detection of a negative-velocity HVC in this sight line centered at km s-1 , possibly from an extended atmosphere of HVC Complex M. Although the HVC cannot be detected in H I 21-cm emission (Wakker et al. 2003), it is clearly detected in Si II, C II, and Si III. Interestingly, this HVC is not detected in O VI.
3.6. PG 1116+215

High-quality data for PG 1116+215 from both FUSE and HST are now publicly available. The IGM absorbers have been analyzed by Sembach et al. (2004). The HST STIS observations include data using the E140M grating, as well as the E230M grating covering a wavelength range Å. The O VI profile indicates a high-velocity component spaning the velocity range km s-1 . In addition to O VI, high-velocity absorption from this component can be detected in at least 22 resonance lines of C IV, Si IV, C III, Si III, N III, C II, Si II, Fe II, N II, Mg II, and O I. Profiles for several key absorption lines are shown in Figure 7. We include this sight line in our sample only to present the fact that this HVC can be detected in lines of various ionization stages. If the HVC is characterized by a metallicity of in an abundance pattern of Grevesse & Sauval (1998), then the optical depth of the high-velocity O I feature suggests a column density (H I) cm-2. Such a value of (H I) is barely below the detection limit for single-dish radio observations. Ganguly et al. (2005) report that some of the O I profile is contaminated by Ly at , although they do confirm that at least half of the absorption feature’s optical depth arises from high-velocity O I. The O I would be useful for confirming the detection, but the column density is too low to detect the HVC in this line.
The H I can be measured for the HVC in saturated Lyman lines from Ly to Ly (), where absorption from the HVC begins to deblend from Galactic absorption. The measured (H I) from a curve-of-growth fit is poorly constrained; using the observed equivalent widths of the Lyman lines, we find log (H I), based on error bars. Ganguly et al. (2005) find a range from 16.72 (from direct integration of Ly at 918.13 Å) to 18.3 (from the Wakker et al. [2003] non-detection of 21 cm emission). Their best-fit value is log (H I) = 17.82, with a metallicity [O/H] from O I .
3.7. PHL 1811
PHL 1811 has good quality FUSE data (Jenkins et al. 2003), as well as HST STIS E140M and G230MB data. At the time of our analysis, some of the STIS E140M data was proprietary (program ID 9418). The data we present includes only half of the total exposure in the archive. Data for several important resonance lines are shown in Figure 8. The O VI profile shows a broad, high-velocity component with a width km s-1 . Contamination from interstellar H2 L(6-0)P(3) is present, although some of the underlying absorption arises from high-velocity O VI. In lower ionization species, the high-velocity component is detected in C IV, Si IV, Si III, C II, Si II, Mg II, and O I. Several of the profiles indicate velocity structure for the HVC, with evidence for as many as four high-velocity sub-components. This sightline analysis will benefit from the additional exposures in the HST archive, to better study the complicated sub-component absorption. We defer a thorough analysis of this sight line until the full dataset is available. We include the sight line in our sample to present the positive detection of low ion absorption associated with the O VI HVC. The O I detection suggests that the HVC has a column density of (H I) cm-2.
3.8. PKS 1302102

| aaWavelengths and oscillator strengths are from Morton (2003). | log bbAll column densities are calculated through the apparent optical depth method. The HVC occupies the velocity range km s-1 based on the O VI profile. All upper limits are 3 levels. | |||
|---|---|---|---|---|
| Species | (Å) | (mÅ) | ( in cm-2) | |
| O VI | 1031.926 | |||
| N V | 1238.821 | |||
| C IV | 1548.203 | |||
| Si III | 1206.500 | |||
| Si II | 1260.422 |
The FUSE and HST STIS data for the PKS 1302102 sight line are of high quality, with line profiles for several absorption lines shown in Figure 9. Absorption is detected in the O VI profile at Å, which would cover the velocity range km s-1. Absorption in the C II profile in the HVC velocity range is contaminated by IGM absorption. The feature centered near km s-1 arises from C II*, while the broader feature at higher velocity shows little correlation with the O VI profile and is intergalactic Ly at , confirmed by the detection of Ly at 1127.2 Å. The feature at km s-1 in the N V profile is not likely an HVC, since it is considerably stronger than the Galactic absorption and cannot be detected in the weaker line of the doublet, N V . The upper limit is N(N V)/N(O VI) . Corresponding absorption cannot be detected in lower ions, raising the possibility that the high-velocity feature may arise from IGM absorption in a resonance line other than the O VI. There are several low-redshift Ly features detected in the STIS spectrum, which we use to assess this possibility. We find that, for the redshifts of the observed Ly absorbers, the data are inconsistent with the feature at Å arising from other resonance lines at the those redshifts. We therefore confirm that this is a high-velocity O VI detection. PKS 1302102 and 3C 273 are the only cases where a discrete high-velocity O VI absorber cannot be detected in other ion species. Column density measurements and upper limits for this HVC are shown in Table 7.
3.9. Ton S180

| aaWavelengths and oscillator strengths are from Morton (2003). | log bbAll column densities are calculated through the apparent optical depth method. The HVC occupies the velocity range km s-1 based on the various line profiles. All upper limits are 3 levels. | |||
|---|---|---|---|---|
| Species | (Å) | (mÅ) | ( in cm-2) | |
| O VI | 1031.926 | |||
| C III | 977.020 | |||
| Si III | 1206.500 | |||
| C II | 1036.337 | |||
| Mg II | 2796.352 |
The Ton S180 sight line has good quality FUSE and HST STIS G140M data. STIS G230MB observations also exist, although the low quality of that data allows only upper limits to be established on the column density of Mg II. The raised continuum near km s-1 in the Mg II profile indicates that contamination may be present, although it does not appear sufficiently significant to dominate any possible high-velocity absorption, which should be cenetered near km s-1 . Line profiles for several ion species are shown in Figure 10. We detect high-velocity absorption in O VI, C III, Si III, and C II. Some of the absorption near km s-1 in the O VI profile could arise from H2 L(6-0)P(3), although an analysis of other H2 lines indicates that the contribution should be negligible.
The O VI high-velocity component appears well separated from the Galactic component, although blending is apparent in the Si III profile. Based on the various absorption profiles, we adopt an integration range of km s-1 for the high-velocity component. Column density measurements for the HVC are presented in Table 8. There is also O VI absorption at 200–280 km s-1 (S03), which we do not measure because it may be associated with three galaxies in the Coma-Sculptor Group (Wakker et al. 2003). The strong feature in the N V profile, which occupies a nearly identical velocity range as the high-velocity component, is actually IGM Ly absorption at (Penton et al. 2004). This identification is confirmed by a corresponding Ly detection at this redshift near 1044.6 Å. Since saturation is clearly present in the C III profile, we can establish only a lower limit on (C III). The high-velocity range of the Si II profile is contaminated by Galactic S II . Blending makes it impossible to accurately measure (Si II) for the HVC, although the feature near km s-1 is probably high-velocity Si II. With the current data, we do not have access to strong Si II lines (e.g., 1190.416, 1193.290, 1526.707).
3.10. UGC 12163

Although FUSE and HST STIS data exist for UGC 12163, the low flux of this target produces the lowest S/N data in our sample. In spite of the poor data quality, high-velocity absorption can be detected in several ion species, ranging in ionization state from O I to O VI, including C II, C III, and C IV. Profiles of resonance lines where high-velocity absorption can be detected are shown in Figure 11. We have subtracted off contamination from H2 L(6-0)P(3), despite the poor data quality. Although the resulting profile indicates an imprecise subtraction, it is a useful exercise in demonstrating that some of the underlying absorption must be from O VI. After H2 subtraction, the high-velocity O VI is detected primarily over the velocity range km s-1 , while the lower ionization species show a more complicated high-velocity structure. We detect with certainty absorption in C III, C II, and O I at similar velocity as the O VI, although over a much narrower velocity width. Additionally, we detect high-velocity C IV, Si III, C III, and C II over a velocity range km s-1 , with no corresponding O VI absorption. This complicated absorption structure underscores the need for better quality FUSE and HST data for this sight line since many features are difficult to distinguish from noise. Because of the noisy data and the difficulty in establishing the velocity range of the absorption features, we do not attempt to measure column densities. The data are included solely to present the detection of lower ionization species associated with the O VI HVC.
4. DISCUSSION
4.1. Kinematics and Spatial Distribution
Given the similar ionization characteristics of most HVCs in our sample, it is instructive to consider the spatial distribution of the sight lines. In Figure 1, we showed the locations of the sight lines in our sample on an all-sky map of the highly ionized HVCs from the S03 survey. Also labeled are the Local Group barycenter at (Karachentsev & Makarov 1996) and the direction of the Milky Way’s motion, at km s-1 (Einasto & Lynden-Bell 1982) with respect to the Local Group barycenter. The HVCs in the figure are classified as either “Local Group” (PKS 2155304, Mrk 509, MRC 2251178, PHL 1811, Ton S180), “extreme positive (north)” (PG 0953+414, PG 1116+215, 3C 273, PKS 1302102), or “Magellanic Stream extension” (Mrk 1513, UGC 12163, HE 02264110) in S03’s identification system. None of the HVCs shown are detected in H I emission. The 12 sight lines discussed in this paper do not cluster in a restricted portion of the sky and probably represent the spatial distribution of the full population.
The segregation of the positive- and negative-velocity highly ionized HVCs and the apparent symmetry of this pattern with regard to the location of the Local Group barycenter led Nicastro et al. (2003) to propose that the O VI HVCs trace the local WHIM filament. The kinematics of the population could be explained if the Galaxy is drifting through a hot gaseous medium in the Local Group, although there are other models that are consistent with the observations. For example, an infalling shell of gas, spherically symmetric about the Galactic center, produces a similar velocity segregation in the LSR. This model is not unique, and it could be refined by including additional features: (1) the range of O VI velocities rather than just the centroid; (2) asymmetric infall velocities and shell radii; and (3) peculiar motions from SNRs and the Galactic fountain. Nevertheless, the model illustrates the basic features of gaseous infall encountering the enhanced pressure of a rotating halo, without including details of shocks and deceleration of the flow.
As a simple illustration, we examined the all-sky velocity distribution of a toy model of a radially infalling shell at Galactocentric radius, kpc, km s-1 , and assuming standard Galactic rotation, km s-1 towards at kpc. Such a model can explain the general trend of positive velocities at and negative velocities at , although an anomaly is the clustering of positive velocity HVCs near , the direction of the Galactic anti-center. Because the LSR velocities of clouds in this direction are unaffected by Galactic rotation, they should measure velocities with respect to the Galactic disk. However, the clouds near are clearly not infalling. A recent analysis (Savage et al. 2005) of a highly ionized HVC toward Mrk 421, at concludes that the HVC most likely traces outflowing gas in a Galactic fountain or H I supershell (Heiles 1979). The redshifted clouds near (Fig. 1) are at high Galactic latitude, so an association with such features would not be surprising. There is also the more exotic possibility that some of this gas is falling toward the Local Group barycenter.
The locations of the sight lines and kinematics of the HVCs can also be compared to the distribution of known high-velocity objects in all-sky H I maps (e.g., Figure 16 from Wakker et al. 2003 and Figure 11a from S03). The negative-velocity HVCs in our sample are clustered in the southern Galactic hemisphere between . All the negative-velocity HVCs in the sample except Mrk 1513 (detected in C III and Si III) are detected in singly-ionized species. These sight lines lie within of either the H I-detected portions of the Magellanic Stream222The Magellanic Stream has an average angular width of , running from , through the south Galactic pole, to . or the Galactic Center Negative (GCN)333The GCN clouds are a collection of negative-velocity HVCs bounded by and . clouds and they share similar kinematics to those objects. These negative-velocity, highly ionized HVCs may trace extended low column density “atmospheres” of the Magellanic Stream or GCN clouds, produced by photoionization or interfaces arising from thermal conduction or turbulent mixing (Indebetouw & Shull 2004). Evidence from studies of high and low ions in Complex C (Fox et al. 2004) as well as the correlation between OVI and mapped HI HVCs (S03) indicate that halo HVCs have hot, highly ionized outer skins or interfaces, although the extent of these atmospheres is unknown. These blueshifted highly ionized HVCs are not associated with the Anti-Center Complex at km s-1 seen in 21-cm emission in the southern Galactic hemisphere (Mirabel 1982).
The positive-velocity, highly ionized HVCs in the northern Galactic hemisphere present a more difficult problem, since few of these objects are kinematically related to H I structures in their regions of sky. Only the positive-velocity HVC toward HE 02264110, which lies within of the Magellanic Stream, shares a kinematic connection to an extension of the Magellanic Stream. As stated previously, several of these clouds do not conform to a simple infall model and may represent Galactic fountain material. The 3C 273 O VI wing is consistent with a Galactic fountain (Sembach et al. 2001), since the sightline passes near Galactic Radio Loops I and IV of the North Polar Spur (Burks et al. 1994). The PKS 1302102 HVC is also detected only in O VI and lies from 3C 273. The large positive velocity of this HVC (200 – 340 km s-1 ) and the lack of a connection to Galactic absorption suggest that a fountain origin is unlikely. The HVCs near in the PG 0953+414 and PG 1116+215 sight lines have significant low-ion detections associated with the O VI. It is unlikely that these clouds trace a Galactic fountain, unless large amounts of singly ionized and neutral gas are entrained in the fountain and are somehow able to maintain temperatures as low as K. The low metallicity of this HVC, [O/H] = (Ganguly et al. 2005), suggests that such a scenario is unlikely, as the metallicity of fountain gas is likely to be near solar. While the origin of the positive-velocity, highly ionized HVCs is unknown, we note that a simple infall model can reproduce some of the general kinematics of the full population. We are undertaking more detailed modeling of the range of O VI velocities, and allowing some of the model parameters to vary.
4.2. Ion Detections in Highly Ionized HVCs
| Sightline | [C,Si] IV | [C, Si] III | [C, Si] II |
|---|---|---|---|
| 3C 273 | |||
| HE 02264110 | |||
| MRC 2251-178 | n/cbb“n/c” denotes no spectral coverage for the sight lines observed only with the HST-STIS G140M grating. | ||
| Mrk 509 aaFrom Collins et al. (2004) | |||
| Mrk 1513 | n/c | ||
| PG 0953+414 | |||
| PG 1116+215 | |||
| PHL 1811 | |||
| PKS 1302-102 | |||
| PKS 2155-304aaFrom Collins et al. (2004) | |||
| Ton S180 | n/c | ||
| UGC 12163 |
Including the two sight lines from CSG04, we have now surveyed highly ionized HVCs in 12 QSO sight lines. These sight lines, selected from the detection of high-velocity O VI and the availability of HST STIS data, are investigated primarily through detections of single, double, and triple ions of C and Si. Some of these HVCs are detected in O I as well. We made no definite detection of N V, a weak ion whose measurement is almost always difficult (Indebetouw & Shull 2004). In Table 9 we summarize the ion detections for the HVCs in these sight lines. In the 12 sight lines, we detect low ions (C II or Si II) in 9 (75%) of the cases, and either C III or Si III in 10 of 12 sight lines. In one of the three cases where low ions cannot be detected, the HVC toward Mrk 1513, absorption is detected in doubly-ionized species; Si III and C III are detected in the Mrk 1513 HVC, while the 3 detection limit for C II is well above all but one measured (C II) for the HVCs in this sample. In better quality data, it is likely that the absorption characteristics for the Mrk 1513 HVC would be similar to the other HVCs detected in low ions.
Two HVCs in the sample, toward 3C 273 and PKS 1302102, are not detected in any other ion besides O VI. The high-velocity O VI towards 3C 273 is a positive-velocity wing to Galactic absorption, and can be explained as cooling gas from a Galactic fountain (Sembach et al. 2001) or SNR radio shells (Burks et al. 1994). The PKS 1302102 high-velocity O VI absorption is well separated from the Galactic component; one possible interpretation is that it traces a low- filament of the WHIM. X-ray observations of O VII or O VIII in this sight line would be useful in investigating this possibility, although the source is probably too faint for current X-ray spectrographs.
4.3. Modeling the Column Density Pattern

As demonstrated in the previous section, most of the HVCs discussed in this work exhibit a similar ionization pattern to the HVCs studied by CSG04 in the PKS 2155304 and Mrk 509 sight lines. A key result from modeling those HVCs was that the column density pattern cannot be replicated by a single-phase photoionization model. Although low-ionization species, defined here as C II/III/IV and Si II/III/IV, can be produced simultaneously by such a model, the observed columns of O VI are several orders of magnitude larger than predicted. By assuming that the low ions are photoionized, the models place a lower limit on the hydrogen density, cm-3, some 20–100 times larger than the predicted WHIM gas density, cm-3. This WHIM has an overdensity (Cen & Ostriker 1999; Davé et al. 1999) relative to the mean density of the low redshift universe, .
At K, the cooling time for hot, low-density WHIM gas at 10% solar metallicity is over 100 Gyr (Shull 2003; CSG04), much longer than the Hubble time. Thus, it is implausible to suggest that the observed low ions arise in cooled portions of WHIM filaments. The cooling estimates assume approximate pressure equilibrium throughout the clouds. Since the sound crossing time is yr across 1 kpc, constant pressure is only an approximation.
Here, we take a similar approach as CSG04 and attempt to model the observed ionization pattern in this sample of HVCs as arising from an incident ionizing radiation field. We can immediately rule out a stellar spectrum, since such fields are too soft to produce significant fractions of ions higher than doubly ionized. The most successful CSG04 model used the integrated radiation from background QSOs and AGNs. Such ionizing fields best reproduce the observed column density ratios in the highly ionized HVCs, where typically (C II)(C III)(C IV). As in CSG04, we generated a grid of photoionization models using the code CLOUDY (Ferland 1996), making the simplifying assumption that the absorbing gas can be treated as plane-parallel slabs illuminated by incident AGN background radiation. There are three basic free parameters that go into these models: H I column density, gas number density, and gas metallicity. We assume the gas metallicity to be 10% solar, similar to that observed (CSG03) in other HVCs (), with a relative abundance pattern assumed to be solar. In CSG04, we worked with a smaller parameter space, since the H I column densities in the PKS 2155304 HVCs were accurately determined. In this sample, where none of the HVCs has accurate values of (H I), the metallicity assumption is useful in restricting parameter space and producing reasonable computing times. Such an assumption does not dramatically affect the predicted run of ion column density versus gas density. Since these clouds are optically thin, with presumably subsolar metallicities, all models with the same product, N(H I), produce essentially the same results. We adopt a typical extragalactic radiation field with log (photons cm-2 s-1), where is the normally-incident ionizing photon flux, and we assume a power-law spectrum, , with spectral index (Zheng et al. 1997; Telfer et al. 2002). Since the intensity of the radiation field is fixed, we ran models for a range of different ionization parameter, , by varying the hydrogen number density within the cloud ().
In two sight lines, 3C 273 and PKS 1302102, we only have measurements of O VI. With just one ion species, we cannot constrain the ionization parameter or the gas density. Thus, we concentrate our efforts on the five sight lines for which we have measurements of multiple ion species, and we attempt to determine model parameters that fit these observations. As in the models of CSG04, the observed columns of O VI are far greater than can be explained in a photoionization model that produces roughly equal amounts of lower ion species. The ionization pattern in these HVCs clearly indicates a multiphase structure arising from several ionization sources. However, these clouds will be immersed in an ionizing radiation field, minimally the extragalactic background, so considering the HVC observations in the context of a photoionization model is useful for constraining their physical conditions. For this reason, we begin by constraining the models with the lowest ionization species observed. This effectively places an upper limit on the ionization parameter, or a lower limit on the gas density. From this information, we also compute the gas pressure, (assuming a fully ionized gas with HeH), and the cloud size, . For the comparisons of models to observations, we adopt 2 error bars for the measured column densities. Allowing this flexibility in the comparisons is useful, given the simplicity of the models and the complexity of the actual situation. In several cases, the Si III and C III profiles indicate line saturation, and we adopt the measured value as a lower limit to the column density.

We show three grids of photoionization models in Figures 12–14, with constraints provided by the observed ion column densities indicated by the shaded regions. The three figures shown, for HVCs towards HE 02264110, MRC 2251178, and Mrk 1513, are chosen to illustrate the range of ionization characteristics within the five modeled HVCs. Figure 12 shows the constraints on (H I) and log for the HVC towards HE 02264110 based on its ion column densities. Since some saturation is present in the C III and Si III profiles, we adopt the measured column densities as lower limits and plot only the more restrictive Si III lower limit. The constraints on the column densities of C II, Si II, C III, and Si III are consistent with a photoionization model characterized by log (H I) and an ionization parameter log (log ). These values correspond to a pressure, cm-3 K, and cloud size, kpc. In this model, the predicted (Si IV) is slightly below and the predicted (C IV) well below the range allowed by the observations. However, the excess Si IV and C IV could arise in a warmer, collisionally ionized layer. This model predicts a negligible amount of O VI, indicating once again that non-photoionizing sources must play a prominent role in ionizing gas in this HVC.
Figure 13 shows the model constraints based on the ion column density measurements of the HVC toward MRC 2251178. Because this sight line was not observed with the STIS E140M grating, lines of C IV and Si IV were not measured. The FUSE data are of mediocre quality, so the 2 limits on (C II) from do not provide stringent constraints on the photoionization models. Based on C II and Si III, we find acceptable models characterized by parameters ranging from log (H I) and log to (log to ). These values correspond to a wide range of pressures, cm-3 K, and cloud sizes, 0.9–3.9 kpc. As in the case of the other sight lines, the observed (O VI) is far larger than predicted by this model.

The Mrk 1513 sight line shows different characteristics than the other sight lines in this study. Besides O VI, the HVC in this sight line can be detected in both Si III and C III. The C III profile is saturated, and the measured value is taken as the lower limit. The HST STIS G140M data do not cover C II , and the high-velocity Si II profile is contaminated. Therefore, we are forced to move to the poorer-quality FUSE data to search for low ions. As discussed in § 3.4, the FUSE data for Mrk 1513 are among the worst in the sample, and we are unable to make a 3 detection of the HVC in C II . Figure 14 shows the photoionization model constraints based on the Mrk 1513 HVC column density measurements. The upper limits on (C II) and (N V), as well as the lower limit on (C III), provide reasonable constraints. Using the measurement of (Si III), we find a best-fit model characterized by log (H I) and log to (log to ), suggesting a less dense medium than the HVCs with single-ion detections. These values indicate lower pressures, cm-3 K, and larger cloud sizes, kpc, than the HVCs with C II or Si II detections. We note, however, that this result is highly dependent on the C III lower limit, where we have assumed that there is no contamination (the C III profile appears different than the O VI and Si III profiles). If the profile were sufficiently contaminated, the model parameters would be poorly constrained. For example, if the lower limit were log (C III) (i.e., 30% of the profile optical depth arising from a contaminant line), then the ionization parameter could be as low as log , and the gas density nearly an order of magnitude higher.
| log (H I) | log | log | aaFor a fully ionized gas with He/H, . | Size | Ions | |
|---|---|---|---|---|---|---|
| Sight Line | (cm-2) | (cm-3) | (cm-3 K) | (kpc) | for fitbbRefers to the measured ions which provide the best constraints on the fit. | |
| HE 02264110 | 17.2 | 24.8 | 5.9 | C II, Si II | ||
| MRC 2251178 | 16.2-16.8 | to | to | 11.4-37.6 | 0.9-3.9 | C II, Si III |
| MRK 1513 | 15.8 | to | to | 2.4-3.5 | 28-73 | Si III, C IIIccThe C III constraint is a lower limit. |
| PG 0953414 | 16.4 | 20.6 | 1.5 | C II , Si III | ||
| TON S180 | 16.6 | 16.9 | 3.9 | C II , Si III |
The results of the modeling are shown in Table 10. The models indicate that HVCs with single-ion detections made in data of FUSE and HST STIS quality (S/N per resolution element) have gas densities of at least log , pressures cm-3 K, and cloud sizes kpc. Since highly ionized HVCs with low ions (C II, Si II) represent 75 of our sample, the characteristic gas density in this population seems to be significantly larger than expected for filaments of the WHIM. The calculated sizes suggest discrete clouds, rather than an extended hot medium in the Local Group. It is therefore difficult to reconcile these results with the WHIM interpretation of the high-velocity O VI absorbers.
Nicastro et al. (2003) propose that cooled, higher-density regions could arise in WHIM filaments by compression against virialized structures in the Local Group. However, as noted in § 4.1, the cooling time of the WHIM is much longer than the Hubble time. In addition, there is little direct kinematic evidence for a 90 km s-1 drift of the Local Group relative to the WHIM on Mpc distance scales. Instead, observations (Méndez et al. 2002) show that random motions among galaxies out to 550 km s-1 redshift are small, and large infall velocities only appear on halo scales. However, even if there were large-scale drift of the Local Group, the kinematic similarities between the O VI and low-ion profiles (C II, Si II, C III, Si III) suggest that the O VI absorbers detected with FUSE are more likely associated with discrete cloud-like objects than with hot WHIM filaments. We cannot rule out a WHIM origin for the two HVCs toward 3C 273 and PKS 1302-102, where the density cannot be constrained since they are detected only in O VI.
4.4. Collisional Ionization
In the previous section, we showed that the ubiquitous detections of low ions in the highly ionized HVCs are consistent with a scenario where the absorbers trace photoionized clouds with densities, log , and pressures cm-3 K. Although the high ion column densities are underpredicted in the photoionization models, the kinematic similarities between the low ion and high ion (O VI, C IV, Si IV) profiles suggest that these species arise in the same clouds. The HVCs must be a multiphase medium, where the low- and high-ion components trace photoionization and collisionally ionization, respectively. In this section, we compare the column densities of high ions to various collisional ionization scenarios, that are physically consistent with the observed multicomponent HVC structure. In Table 11, we list column density ratios involving O VI, N V, C IV, and Si IV for the highly ionized HVCs. We consider only cases where existing data cover the C IV and Si IV lines.
F04 recently converted several common collisional ionization models into the case appropriate for the low-metallicity HVC Complex C. They adopted a metallicity based on [O I/H I] , as well as a depleted nitrogen abundance, [N/H] , a feature common to low-metallicity absorbers because of a differing nucleosynthetic history between nitrogen and -process elements (Gibson et al. 2001; Pettini 2004; Matteucci 2004). Although the absolute metallicities of these objects are unknown, the ion column densities in the PKS 2155304 HVCs are consistent with a subsolar abundance pattern. We therefore use the predictions (F04, Table 7) to make a rough comparison to our observed column density ratios.
| Sight Line | (C IV)(O VI) | ( Si IV)(O VI) | (N V)(O VI) |
|---|---|---|---|
| 3C 273 | |||
| HE 02264110 | |||
| MRK 509bbFrom CSG04. Although the reported values are for the full high-velocity absorption range, the HVCs toward PKS 2155304 and Mrk 509 can be resolved into two components. | |||
| PG 0953414 | |||
| PKS 1302102 | |||
| PKS 2155304bbFrom CSG04. Although the reported values are for the full high-velocity absorption range, the HVCs toward PKS 2155304 and Mrk 509 can be resolved into two components. |
The upper limits on the column density ratios for the two HVCs detected only in O VI (3C 273 and PKS 1302102) can be explained by several collisional models, including radiative cooling of hot gas (Edgar & Chevalier 1986). The 3C 273 absorber is a positive-velocity (105–240 km s-1 ) wing to the Galactic O VI profile and suggests an outflow from the Galaxy. The sightline also passes near Galactic Radio Loops I and IV near the North Polar Spur (). Radiative cooling would be expected if these absorbers trace a Galactic fountain, although mechanisms appropriate to cloud interfaces are consistent with the ratios as well. We find that the 2 error bars on the high-ion ratios for the low-ion detected HVCs (HE 02264110, Mrk 509, PG 0953+414, and PKS 2155304) are roughly consistent with ionization in turbulent mixing layers (Slavin, Shull, & Begelman 1993) or conductive interfaces (Borkowski et al. 1990). Such ionization sources would be expected at the cloud boundary as the HVC interacts with a surrounding hotter medium. For HVC Complex C, F04 reached a similar conclusion based on data from the PG 1259+593 sight line. The column density ratios towards PG 1259+593 listed in Table 11 are quite similar to those observed in the highly ionized HVCs, suggesting that these objects reside in similar environments. Complex C is a known halo HVC, characterized by relatively high densities cm-3 (CSG03). Because the ionization patterns in Complex C are similar to those of the highly ionized HVCs, the latter may be low column density analogs to the Galactic halo HVCs mapped in H I emission.
5. Conclusions
In this paper, we have compiled HST STIS and FUSE data for 12 quasar sight lines that intercept highly ionized high-velocity clouds. We measured column densities of key ions and investigated the nature of these objects through modeling of their observed ionization patterns. Using these results, we arrive at the following conclusions:
-
1.
We detect low ions (C II or Si II) in 9 of 12 sight lines, and doubly-ionized species (Si III or C III) in 10 of 12 sight lines. These statistics indicate that the highly ionized HVCs are multiphase structures with significant column densities of low ions, in addition to high ions (C IV, Si IV, O VI). For two absorbers detected only in O VI, we cannot rule out a WHIM origin. However, one of them is kinematically consistent with hot gas entrained in a Galactic fountain. The high velocities, O VI line widths, and O VI/O VII column densities are consistent with shock-heating and radiative cooling, with post-shock temperatures .
-
2.
Photoionization modeling of the low ions suggests that the clouds with low-ion detections are characterized by densities log , several orders of magnitude larger than that expected for WHIM gas. The kinematic similarity between the low-ion and high-ion profiles suggests that the high-velocity O VI is more likely associated with higher density clouds in the Galactic halo than with a WHIM filament.
-
3.
Collisional ionization at interfaces with infalling clouds can explain the presence of high ions in multiphase HVCs. High-ion line ratios in the HVCs are similar to those observed in HVC Complex C towards PG 1259+593. Instead of tracing the WHIM, the highly ionized HVCs may trace Galactic halo HVCs, albeit at low column density.
-
4.
The presence of low ions in the (HVC) O VI absorbers, together with mass constraints described below, suggest that both the O VI and () O VII absorbers reside in the Galactic halo ( kpc). The O VII may come from a reservoir of up to gas at K (at 10-30% solar metallicity), while the O VI more likely arises in denser, cooler interfaces ( K).
We close by returning to the three major issues enumerated in § 1. These issues hinge on understanding physical properties of these HVCs (density, temperature, metallicity) and also their distances and locations relative to the Galaxy and Local Group barycenter. Our work suggests that the O VI HVCs do not reside in low-density gas 1–3 Mpc from the Milky Way. The wide range of ionization stages suggests instead that they reside in the Galactic halo. The implications of the IGM vs. Galactic halo debate are profound.
(1) HVC Mass Problem. The location and mass of the high-velocity O VI absorbers remain controversial, since a major reservoir of hot baryons would be required to explain the O VI and ( O VII) absorbers if they were located at Mpc distances. Local O VII has been seen with Chandra and XMM/Newton toward a number of AGN: PKS 2155-304, 3C 273, H1821+643, Mrk 421, etc. (Rasmussen et al. 2003; Mathur et al. 2003; Fang et al. 2003; Nicastro et al. 2002, 2004; McKernan et al. 2004). The typical O VII column density ( cm-2) is ten times that seen in O VI ( cm-2). This difference is somewhat offset by the maximum ionization fractions of these ions: at K, versus at K. If the O VI (and O VII) absorbers are distributed in a spherical shell of WHIM (Nicastro et al. 2003), centered around the Local Group at mean radius and typical column density N, then the total baryonic mass would need to be,
| (1) |
We have assumed that (O/H) has a metallicity and that the ionization fraction of O VII is 0.40–0.98 at log . Similarly large estimates are required for O VI, with at log . This is far too much baryonic mass to be consistent with gravitational models of the Local Group (Kahn & Woltjer 1959; Peebles 1995) which find a total mass . The disagreement becomes much worse if one multiplies the above baryon mass by a factor of 6 to account for the accompanying dark matter [ and ; Spergel et al. 2003].
(2) Infalling Gas Clouds in the Halo. In hierarchical (CDM) models of Local Group assembly (Kravtsov, Klypin, & Hoffman 2002), clumps of gas and dark matter are still falling into the Galactic halo. We believe the highly ionized HVCs seen in O VI and lower ions may represent bow shocks and wakes produced at the interfaces of these gas clumps falling into a hot gaseous halo (CSG04). To produce significant interactions, including ram-pressure stripping, requires halo gas densities cm-3 (Maloney 2003). Such densities and pressures do not occur in the WHIM, and instead require that the HVCs lie within kpc. The amount of shock-heating will depend on the Mach number of the infalling cloud relative to the hot virialized halo or warm photoionized clouds. Even without shocks, the infalling gas may be subject to viscous entrainment or turbulent mixing layers.
(3) Kinematic Signatures of Infall. As discussed earlier, a simple kinematic model of infall relative to the rotating disk and halo can reproduce some of the observed signatures of the highly ionized HVCs. The HVC velocity pattern (Fig. 1) suggests that this gas reflects the underlying sense of Galactic rotation, with strong segregation of red-shifted and blue-shifted absorbers on different sides of the rotation axis. One should not place too much emphasis on the apparent dipole pattern, since we have eliminated sight lines in the top-right and lower-left regions, which pass through HVC Complexes A, C, and M, the Magellanic Stream, and other known H I structures. Whether the Local Group might drift relative to the large-scale WHIM on supercluster length scales depends on the existence of large-scale flows and peculiar velocities, as well as the nature of gaseous infall at kpc. Recent observations of the local Hubble flow (Méndez et al. 2002) suggest a remarkably quiet flow, with random motions of galaxies exhibiting little deviation from a pure Hubble flow out to km s-1 . Small-scale infall within the Local Group is more likely, as shown by the relative motion of M31 and the theoretically predicted clumpy infall to the Milky Way (Kravtsov et al. 2002).
To make further progress in understanding the physical state of hot gas in the Galactic halo will require new information on the distances to the UV and X-ray absorbers. An additional challenge will be to relate the hot gas (O VII at ) with the UV absorbers (O VI, C IV, lower ions). We noted above the physical difficulties of placing the O VII absorbers in the WHIM, at Mpc distances around the Galaxy. Not only does the gas mass exceed dynamical limits for the Local Group, but the low required densities in the WHIM do not allow this hot gas to cool. It is far more plausible that the O VII arises in a reservoir of hot gas ( K) in an extended Galactic halo at kpc. Equation (1) then suggests a total mass of for hot gas ( K) with 25% solar metallicity. Such hot halos are a natural consequence of halo virialization. If galaxies typically have 100-kpc hot halos, their presence could be detected through O VII absorption lines in the X-ray spectra of bright AGN, at a frequency .
References
- (1) Abgrall, H., Roueff, E., Launay, F., Roncin, J. Y., & Subtil, J. L, 1993a, A&AS, 101, 273
- (2) Abgrall, H., Roueff, E., Launay, F., Roncin, J. Y., & Subtil, J. L, 1993b, A&AS, 101, 323
- (3) Borkowski, K. J., Balbus, S. A., & Fristrom, C. C. 1990, ApJ, 355, 501
- (4) Blitz, L., Spergel, D. N., Teuben, P. J., Hartmann, D., & Burton, W. B. 1999, ApJ, 514, 818
- (5) Braun, R., & Burton, W. B. 1999, A&A, 341, 437
- (6) Burks, G. S., et al. 1994, ApJ, 437, 630
- (7) Cen, R., & Ostriker, J. P. 1999, ApJ, 514, 1
- (8) Collins, J. A., Shull, J. M., & Giroux, M. L. 2003, ApJ, 585, 336 (CSG03)
- (9) Collins, J. A., Shull, J. M., & Giroux, M. L. 2004, ApJ, 605, 216 (CSG04)
- (10) Davé, R., Hernquist, L., Katz, N., & Weinberg, D. H. 1999, ApJ, 511, 521
- (11) Edgar, R. J., & Chevalier, R. A. 1986, ApJ, 310, L27
- (12) Einasto, J., & Lynden-Bell, D. 1982, MNRAS, 199, 67
- (13) Fang, T., Marshall, H. L., Lee, J. C., Davis, D. S., & Canizares, C. R. 2002, ApJ, 572, L127
- (14) Fang, T., Sembach, K. R., & Canizares, C. R. 2003, ApJ, 586, L49
- (15) Ferland, G. J. 1996, HAZY, A Brief Introduction to CLOUDY (Univ. Kentucky Dept. Astron. Internal Rep.)
- (16) Fox, A. J., Savage, B. D., Wakker, B. P., Richter, P., Sembach, K. R., & Tripp, T. M. 2004, ApJ, 602, 737 (F04)
- (17) Fox, A. J., Savage, B. D., Wakker, B. P., Tripp, T. M., & Sembach, K. R., ApJ, 2005, in preparation
- (18) Ganguly, R., Sembach, K. R., Tripp, T. M., & Savage, B. D., ApJ, 2005, submitted
- (19) Gibson, B. K., Giroux, M. L., Penton, S. V., Stocke, J. T., Shull, J. M., & Tumlinson, J. 2001, AJ, 122, 3280
- (20) Grevesse, N., & Sauval, A. J. 1998, SSRv, 85, 161
- (21) Heiles, C. 1979, ApJ, 229, 533
- (22) Indebetouw, R., & Shull, J. M. 2004, ApJ, 607, 309
- (23) Jenkins, E. B., Bowen, D. V., Tripp, T. M., Sembach, K. R., Leighly, K. M., Halpern, J. P., & Lauroesch, J. T. 2003, AJ, 125, 2824
- (24) Kahn, F. D., & Woltjer, L. 1959, ApJ, 130, 705
- (25) Karachentsev, I. D., & Makarov, D. A. 1996, AJ, 111, 794
- (26) Kravtsov, A. V., Klypin, A., & Hoffman, Y. 2002, ApJ, 571, 563
- (27) Maloney, P. R. 2003, in The IGM/Galaxy Connection, eds. J. L. Rosenberg & M. E. Putman (Kluwer: Dordrecht), 299
- (28) Mathur, S., Weinberg, D. H., & Chen, X. 2003, ApJ, 582, 82
- (29) Matteucci, F. 2004, in Cosmochemistry: The Melting Pot of Elements, ed. C. Esteban, A. Herrero, R. Garcia-Lopez, & F. Sanchez (Cambridge: Cambridge Univ. Press), 217
- (30) McKernan, B., Yaqoob, T., & Reynolds, C. S. 2004, ApJ, 617, 232
- (31) Méndez, B., Davis, M., Moustakas, J., Newman, J., Madore, B. F., & Freedman, W. L. 2002, AJ, 124, 213
- (32) Mirabel, I. F. 1982, ApJ, 256, 120
- (33) Moos, H. W., et al. 2000, ApJ, 538, L1
- (34) Morton, D. C. 2003, ApJS, 149, 205
- (35) Nicastro, F. 2003, in Maps of the Cosmos, IAU Symp. 216, 170
- (36) Nicastro, F., et al. 2002, ApJ, 573, 157
- (37) Nicastro, F., et al. 2003, Nature, 421, 719
- (38) Nicastro, F., et al. 2004, ApJ, submitted
- (39) Peebles, P. J. E. 1995, ApJ, 449, 52
- (40) Penton, S. V., Shull, J. M., & Stocke, J. T. 2000, ApJ, 544, 150
- (41) Penton, S. V., Stocke, J. T., & Shull, J. M. 2004, ApJS, 152, 29
- (42) Pettini, M. 2004, in Cosmochemistry: The Melting Pot of Elements, ed. C. Esteban, A. Herrero, R. Garcia-Lopez, & F. Sanchez (Cambridge: Cambridge Univ. Press), 257
- (43) Putman, M. E., et al. 2002, AJ, 123, 873
- (44) Rasmussen, A., Kahn, S. M., & Paerels, F. 2003, in The IGM/Galaxy Connection, eds. J. L. Rosenberg & M. E. Putman (Kluwer: Dordrecht), 109
- (45) Richter, P., et al. 2001, ApJ, 559, 318
- (46) Sahnow, D. J., et al. 2000, ApJ, 538, 7
- (47) Savage, B. D., & Sembach, K. R., 1991, ApJ, 379, 245
- (48) Savage, B. D., Wakker, B. P., Fox, A. J., & Sembach, K. R. 2005, ApJ, in press (Feb. 2005)
- (49) Sembach, K. R. 2004, in The Local Group as an Astrophysical Laboratory, 2003 STScI May Symposium, in press
- (50) Sembach, K. R., et al. 2003, ApJS, 146, 165 (S03)
- (51) Sembach, K. R., Tripp, T. M., Savage, B. D., & Richter, P. 2004, ApJS, 155, 351
- (52) Sembach, K. R., Howk, J. C., Savage, B. D., Shull, J. M., & Oegerle, W. R. 2001, ApJ, 561, 573
- (53) Sembach, K. R., Savage, B. D., Lu, L., & Murphy, E. M. 1995, ApJ, 451, 616
- (54) Sembach, K. R., Savage, B. D., Lu, L., & Murphy, E. M. 1999, ApJ, 515, 108
- (55) Shull, J. M. 2003, in The IGM/Galaxy Connection, eds. J. L. Rosenberg & M. E. Putman (Kluwer: Dordrecht), 1
- (56) Slavin, J. D., Shull, J. M., & Begelman, M. C. 1993, ApJ, 407, 83
- (57) Spergel, D. N., et al. 2003, ApJS, 148, 175
- (58) Stocke, J. T., Shull, J. M., & Penton, S. V. 2004, in Planets to Cosmology: Essential Science in Hubble’s Final Years, 2004 STScI May Symposium, in press (astro-ph/0407352)
- (59) Telfer, R. C., Zheng, W., Kriss, G. A., & Davidsen, A. F. 2002, ApJ, 565, 773
- (60) Tripp, T. M., et al. 2002, ApJ, 575, 697
- (61) Tripp, T. M., et al. 2003, AJ, 125, 3122
- (62) Wakker, B. P., & van Woerden, H. 1997, ARA&A, 35, 217
- (63) Wakker, B. P., et al. 1999, Nature, 402, 388
- (64) Wakker, B. P., et al. 2003, ApJS, 146, 1
- (65) Zheng, W., Kriss, G. A., Telfer, R. C., Grimes, J. P., & Davidsen, A. F. 1997, ApJ, 475, 469