Low-frequency constraints on the spectra of the lobes of the microquasar GRS 1758258
I present low-frequency observations of the lobes of the microquasar GRS 1758258, which, together with earlier radio observations, provide the best constraints yet on the lobe spectra, and show that they are consistent with the electron energy indices expected from standard shock acceleration models. There is no statistically significant evidence for synchrotron ageing along the length of the lobes, which is consistent with expectation if the magnetic field strength is close to the minimum-energy value. If the environment of the lobes has typical ISM properties, the lobes will dissipate on timescales of thousands of years or less, long before synchrotron ageing can become significant.
Key Words.:
stars: individual: GRS 1758258 – stars: winds, outflows – radio continuum: stars1 Introduction
Galactic ‘microquasar’ sources, driven by relativistic outflows from close to the accretion discs of neutron star or black hole binaries (Mirabel & Rodríguez 1999) are of great interest, not just for the insights they provide into the properties of accreting binary systems but as analogues of the much more powerful and distant extragalactic radio sources, radio galaxies and radio-loud quasars. About 10% of known X-ray binary systems have detected radio emission which may be associated with jets, and a significant fraction of these show, or have at some stage shown, clear jet-related extended radio emission (Mirabel & Rodríguez). However, there is one crucial difference between microquasars and their extragalactic counterparts. Essentially all powerful AGN-related radio sources, when observed at sufficient dynamic range, show extended ‘lobes’ of radio emission, which are thought to be the repository for a significant fraction of the jet’s overall luminosity integrated over the radio source’s lifetime (e.g. Scheuer 1974) and which very often dominate the radio luminosity of the source by many orders of magnitude. By contrast, there are only two known microquasars that have so far been found to exhibit persistent lobe-like radio emission: the two Galactic-centre black hole candidates 1E 1740.72942 (Mirabel et al. 1992) and GRS 1758258, the subject of this paper. Heinz (2002) has argued that this difference arises because of the (relatively) low-density environments generally inhabited by microquasars, which mean that any lobes formed have short lifetimes against adiabatic losses; this might suggest that there is something special about the environments of the sources that show lobes. However, because of the very low radio flux from the lobed objects, it has been difficult so far to make quantitative statements about their dynamics. In this paper I present new observations that allow more definite statements to be made about GRS 1758258.
GRS 1758258 is a bright persistent hard X-ray source lying 5 degrees away from the Galactic centre, originally discovered with the SIGMA instrument on Granat (Sunyaev et al. 1991). (Throughout this paper I shall follow previous work in adopting a distance of 8.5 kpc to the source.) Because of the high extinction towards GRS 1758258 in the optical, searches for the companion star have been carried out in the infrared (e.g. Martí et al. 1998, Rothstein et al. 2002): the most likely counterpart, based on radio and X-ray positions, is a K-III-type giant star. The associated extended radio structure was originally discovered by Rodríguez, Mirabel & Martí (1992) and subsequently imaged in more detail at two frequencies by Martí et al. (2002: hereafter M02). M02 used the fact that the spectral indices between 5 and 8.4 GHz were consistent with being steep (, where is defined throughout the paper in the sense that flux ) to argue that the lobe emission was definitely optically thin synchrotron radiation. The new radio observations presented in this paper, combined with the data of discussed by M02, provide much tighter constraints on the radio spectral properties of the lobes, and allow me to discuss their implications for the dynamics of the radio source.
Throughout the paper errors quoted are , unless otherwise stated.
2 Observations and analysis
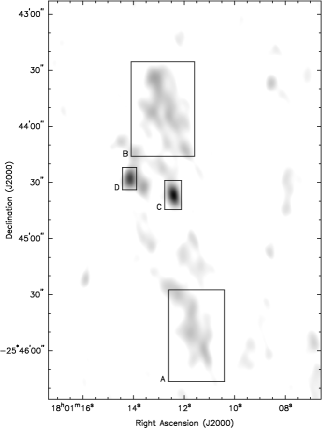
GRS 1758258 was observed twice with the NRAO Very Large Array (VLA) in B configuration, using two standard observing frequencies (1385.1 and 1464.9 MHz) with a bandwidth of 50 MHz at each frequency. The first observation, made on 2002 August 11, was badly compromised by radio frequency interference, and accordingly I re-observed the source with the same observational parameters on 2004 Jan 13. The total usable on-source integration time was about 3h. 3C 286 was used as the primary flux calibrator and the phase was calibrated using observations of the nearby source 1751253 every 15 minutes. The data were calibrated in the software package AIPS in the standard manner, and the task IMAGR was used to produce images of the source at an effective frequency of 1425 MHz. Because there was no evidence for significant changes in the structure of the source over the 16-month interval between observations (see below for more discussion of this point) I combined the two observations to make a final image. The off-source noise on this image (35 Jy beam-1) was significantly above the expected thermal level, but was sufficient for a significant detection of all the previously known components of the radio source (Fig. 1).
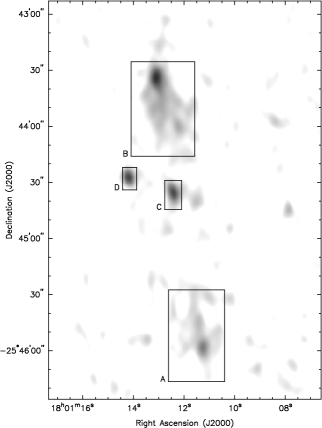
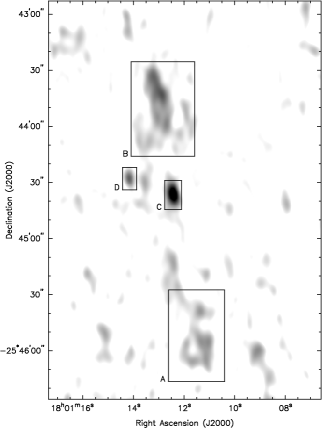
In order to make reliable multi-frequency measurements, I retrieved the data discussed by M02 from the VLA archives. This consists of 9 observations at C and X bands in the C configuration of the VLA taken between 1997 August 03 and 1997 August 24 as part of a multi-wavelength variability campaign (see Lin et al. 2000 for the observational details). Following M02, I calibrated each of the C and X-band datasets separately and concatenated them to make images at effective frequencies of 4860 and 8460 MHz. The -plane coverage of my new L-band data is well matched to that of the 1997 C-band data, but the X-band data are obviously not as well matched; at the time of writing, there are no publicly accessible D-configuration X-band observations of useful length that could be used to provide short baselines at 8 GHz. Accordingly, I elected to image all three datasets with a shortest baseline of 0.7 k, matched to the shortest baseline of the 8-GHz dataset, to ensure that the same largest angular size was sampled by each. As this short-baseline cutoff has significant effects on spatial scales above 2.5 arcmin, it should not affect the images produced. The weighting of the plane was tapered in imaging the X-band data to produce a similar beam area, and primary beam correction was applied to both the C- and X-band images using the AIPS task PBCOR.
I then measured flux densities from four regions of the source, corresponding to the components denoted VLA A, B, C and D by Rodríguez et al. (1992). A is the south lobe, B the north lobe, C is coincident with the Chandra position of the X-ray source (Heindl & Smith 2002) and seems likely to be analogous to the ‘core’ of an extragalactic radio source (see below) while D is thought to be an unrelated object. Flux densities were measured in rectangles around each component using the AIPS verb IMSTAT. The regions used to extract the fluxes are shown in Fig. 1, and the flux densities listed in Table 1. Errors on the flux densities were determined from the off-source noise in each image in the standard way. Note that the flux densities for C and X bands are systematically higher than the values tabulated by M02: this seems likely to be because I have used larger measurement regions, in an attempt to measure all the lobe-related flux.
| Component | Flux density (mJy) | ||
|---|---|---|---|
| (1.4 GHz) | (4.9 GHz) | (8.4 GHz) | |
| A | |||
| B | |||
| (B north) | |||
| (B south) | |||
| C | |||
| D | |||
The flux densities were then fitted with a power law in frequency using standard least-squares fitting (Fig. 2). The lobe regions (A and B) are both well fitted with a power law, with spectral indices of and respectively, in good agreement with the expectation from synchrotron radiation from a population of particles accelerated at a strong shock (). There is no evidence for any high-frequency spectral steepening. The central source, C, is not well fitted with a power-law model because of the upturn in the flux density between 5 and 8 GHz, but this may well be due to the effects of variability (see section 3.1 below). Component D is well fitted with a power law of slope , which would be a plausible value for a background radio galaxy.
Finally, in view of the differences between the images in L and C band, suggesting that the source is more strongly edge-brightened at higher frequencies, I measured fluxes for two sub-regions of component B, obtained by dividing the region shown in Fig. 1 into two equal halves. The fitted spectral indices for these two regions are and . There is thus little statistically significant evidence for spectral index variation along the length of the northern lobe.

3 Discussion
3.1 Source variability
An important question is whether the radio source components have varied on timescales of years, and, in particular, whether there could have been significant variability between 1997 and 2002/2004, the respective epochs of the C and X band measurements and my new L-band measurements. Strong variability would invalidate the spectral index results presented above. The images show no evidence for motion of the lobes, and this is also the case for the 1992 and 1997 C-band images (M02). There is no detectable variability in the 1.4-GHz lobe fluxes (or the fluxes of the other components) between 2002 and 2004, but the errors are comparatively large because the 2002 data are poor: M02 comment that they were unable to determine whether there was variability between 1992 and 1997. We know that component C is variable on comparatively short timescales (Rodríguez et al. 1992) although there was little evidence for strong variability in the monitoring campaign of Lin et al. (2000): if the L-band flux in 1997 was consistent with the flat spectral index they measured between 4.9 and 8.4 GHz, however, then it must have increased by a factor 2–3 between 1997 and 2002/4. Variability would certainly explain the peculiar spectrum of this component. Component D appears to have varied between 1992 and 1997 (Lin et al.), which is perhaps surprising in view of its steep spectrum. In the absence of any detected variability in the lobes, I will assume in what follows that the measured spectra for the lobes are valid. Data (at the time of writing, still proprietary) exist in the VLA archive that should allow a definitive answer to this question.
3.2 Synchrotron lobes
The agreement between the measured lobe spectral indices and the standard spectral index for shock-accelerated synchrotron emission is striking. It allows us to assume a synchrotron model with a good deal of confidence, but it also suggests strongly that the lobes are generated in a manner similar to that of powerful extragalactic radio sources. A low-frequency spectral index of 0.5 is often observed in the hotspots of such objects (e.g. Meisenheimer et al. 1989).
If we adopt a synchrotron model, then we can obtain revised versions of the standard derived quantities. I model the electron spectrum as a power law with energy spectral index of 2, corresponding to , and assume that the electron energies extend down to and up to , and that there are no relativistic protons. The derived energy density is only logarithmically dependent on the assumed low and high-energy cutoffs in the electron spectrum. The N lobe (B), which I model as an ellipsoid with major axis 55 arcsec and minor axis 25 arcsec, then has a minimum-energy magnetic field strength of 2.7 nT; the minimum lobe energy density is J m-3, and the minimum pressure in the lobe is Pa. The minimum total energy stored in the lobe is J, comparable to the earlier estimate by Rodríguez et al. (1992).
If we assume that the dominant loss mechanism for the electrons is synchrotron radiation111The magnetic field energy density, assuming minimum-energy conditions, appears to dominate over the photon energy density from the central star and X-ray source at the distance ( pc) of the lobes. An estimate of the overall photon energy density near the Galactic centre is hard to obtain., then standard results (e.g. Leahy 1991), assuming that particle acceleration initially produces an electron energy spectrum that extends to well above the energies being observed at GHz frequencies, show that, for the minimum-energy magnetic field strength, the effects of ageing will not become apparent at 8 GHz until years, after particles in that field were last accelerated. (The similarity between this and the ‘radiative loss’ timescale quoted by Heindl & Smith (2002) is coincidental.) Since these timescales are very much longer than the characteristic timescales of the jet source, we cannot expect to be able to use spectral ageing at GHz frequencies as a probe of lobe dynamics, as is often done for extragalactic radio sources (e.g. Alexander & Leahy 1987) unless the magnetic fields are very much stronger than the minimum energy estimate. In extragalactic sources, there is independent evidence from inverse-Compton emission that the field strengths are close to the minimum-energy values (e.g. Hardcastle et al. 2002) but we have no such independent constraints in microquasars, nor are they likely to be easy to obtain. However, the long synchrotron lifetimes are consistent with the observed lack of any significant spectral gradient along the northern lobe.
3.3 Dynamics and expansion
I begin this section by noting that it is not clear whether there is continuing energy supply to the lobes of GRS 1758258. The observed radio variability in component C suggests ongoing jet activity, but this may be at a very low level. The long lifetimes of the lobes derived above mean that we cannot rule out the possibility that they are the result of an outburst of efficient jet activity at some time in the past (to be determined, but years ago). As Heindl & Smith (2002) point out, the entire stored energy of the lobes can be supplied in a relatively short time (a few years) if the accretion luminosity is tapped efficiently. For this reason, I consider below models of the lobes in which the energy supply from the jet can be neglected and the dynamics of the lobes are driven by their internal energy. In this case the evolution of the radio flux density of the lobes is determined by adiabatic expansion; we expect flux density to go as (e.g. Longair, Ryle & Scheuer 1973).
The minimum pressure in the lobes is very similar to that of the dense molecular material found near the Galactic centre (e.g. Martin et al. 2003), so that the lobes could be confined (and therefore not evolving) if they lay inside a molecular cloud. A molecular cloud is known to lie in the direction of the source (Lin et al. 2000) but the comparatively low absorbing column ( cm-2: Lin et al. and references therein) would require the source to lie relatively close to the surface of the cloud. This is by no means impossible, and the similarity between the minimum pressure and the available external pressure is interesting. However, if the external pressure is lower than this, the lobes cannot be confined. In discussing this case we take (for simplicity, rather than out of any belief that these conditions obtain near the Galactic centre) a fiducial external density cm-3. A lower limit on the expansion speed at the present time, using ram pressure balance, is then around km s-1. Assuming expansion according to a Sedov law, this would give a timescale for a significant drop in flux density, say by a factor , of years — less if the lobe pressure exceeds the minimum value. Adiabatic expansion, not synchrotron losses, would determine the timescale on which the lobe can be detected in this scenario (and this is true for any plausible magnetic field strength in the lobes). This would again be in contrast to the situation for extragalactic sources, where the minimum-energy pressures in lobes routinely fall below the external thermal pressure (e.g. Hardcastle & Worrall 2000), and where approximate pressure balance (with moderate departures from the minimum-energy condition) can be inferred based on X-ray emission (e.g. Croston et al. 2004).
The lobes do not appear to be moving relativistically; M02 estimate an expansion speed . If we assume that the lack of detectable variability between 2002 and 2004 implies that the lobes do not vary, the synchrotron model allows us to place constraints on any adiabatic expansion that may be taking place: a radial expansion of 10% on a timescale of years (corresponding to expansion speeds of the order of ) would give rise to a decrease in flux density of a factor 1.5, which should have been detectable even in the existing poor-quality two-epoch data. We can conclude from this only that the lobes are not grossly overpressured (by factors , for ) with respect to the ambient medium. Longer temporal baselines and more accurate flux density monitoring would provide much stronger constraints.
4 Conclusions
To summarize, the main conclusions that can be drawn from the accurate measurement of the spectral index of the lobes of GRS 1758258 presented here are as follows:
-
1.
The good agreement between the spectral indices and the expected value for synchrotron emission from shock-accelerated electrons strongly reinforces earlier conclusions that the radio emission process is synchrotron radiation.
-
2.
The lack of significant difference between the spectral indices at different regions in the N lobe suggests that synchrotron losses are not important at GHz frequencies: this is consistent with expectation if the magnetic field strengths are close to the minimum-energy values and the source has an age years.
-
3.
The lobe minimum pressures on a synchrotron model are comparable to the internal pressures in Galactic centre molecular clouds, and so the lobes could be confined by such a system. If the lobes lie in a less dense environment they will have a lifetime of the order of at most thousands of years before adiabatic losses render them undetectable, assuming there is no further energy supply from the jet.
Acknowledgements.
I thank the Royal Society for a Research Fellowship, and Christian Kaiser for originally pointing out to me the existence of double-lobed microquasars. J. Martí kindly supplied me with a version of the map of Martí et al. (2002) in support of this work. I am grateful to John Benson for help in retrieving the archival VLA data. I thank the anonymous referee for comments that allowed me to improve the paper significantly. The National Radio Astronomy Observatory is a facility of the National Science Foundation operated under cooperative agreement by Associated Universities, Inc.References
- (1) Alexander, P., Leahy, J.P., 1987, MNRAS, 224, 1
- (2) Croston, J.H., Birkinshaw, M., Hardcastle, M.J., Worrall, D.M., 2004, MNRAS, 353, 879
- (3) Hardcastle, M.J., Birkinshaw, M., Cameron, R., Harris, D.E., Looney, L.W., Worrall, D.M., 2002, ApJ, 581, 948
- (4) Hardcastle, M.J., Worrall, D.M., 2000, MNRAS, 319, 562
- (5) Heindl, W.A., Smith, D.M., 2002, ApJ, 578, L125
- (6) Heinz, S., 2002, A&A, 388, L40
- (7) Leahy, J.P., 1991, in Hughes P.A., ed., Beams and Jets in Astrophysics, Cambridge University Press, Cambridge, p. 100
- (8) Lin, D., Smith, I.A., Liang, E.P., Bridgman, T., Smith, D.M., Martí, J., Durouchoux, P., Mirabel, I.F., Rodríguez, L.F., 2000, ApJ, 532, 548
- (9) Longair, M.S., Ryle, M., Scheuer, P.A.G., 1973, MNRAS, 164, 243
- (10) Martí, J., Mereghetti, S., Chaty, S., Mirabel, I.F., Goldoni, P., Rodrígues, L.F., 1998, A&A, 338, L95
- (11) Martí, J., Mirabel, I.F., Rodríguez, L.F., Smith, I.A., 2002, A&A, 386, 571 [MO2]
- (12) Martin, C.L., Walsh, W.M., Xiao, K., Lane, A.P., Walker, C.K., Stark, A.A., 2003, Astron. Nachrichten, 324(S1), 93
- (13) Meisenheimer, K., Röser, H.-J., Hiltner, P.R., Yates, M.G., Longair, M.S., Chini, R., Perley, R.A., 1989, A&A, 219, 63
- (14) Mirabel, I.F., Rodríguez, L.F., Cordier, B., Paul, J., Lebrun, F., 1992, Nat, 358, 215
- (15) Mirabel, I.F., Rodríguez, L.F., 1999, ARA&A, 37, 409
- (16) Rodriguez, L.F., Mirabel, I.F., Martí, J., 1992, ApJ, 401, L15
- (17) Rothstein, D.M., Eikenberry, S.S., Chatterjee, S., Egami, E., Djorgovski, S.G., Heindl, W.A., 2002, ApJ, 580, L61
- (18) Scheuer, P.A.G., 1974, MNRAS, 166, 513
- (19) Sunyaev, R., Gilfanov, M., Churazov, E., Pavlinsky, M., Babalyan, G., Dekhanov, I., Kuznetsov, A., Grebenev, S., Yunin, S., Yaburenko, N., Cordier, B., Lebrun, F., Laurent, P., Ballet, J., Mandrou, P., Roques, J.P., Vedrenne, G., 1991, Soviet Astron. Lett., 17, 50