Active Galactic Nuclei in the Sloan Digital Sky Survey: II. Emission-Line Luminosity Function
Abstract
The emission line luminosity function of active galactic nuclei (AGN) is measured from about 3000 AGN included in the main galaxy sample of the Sloan Digital Sky Survey within a redshift range of . The and [OIII] luminosity functions for Seyferts cover luminosity range of in H and the shapes are well fit by broken power laws, without a turnover at fainter nuclear luminosities. Assuming a universal conversion from emission line strength to continuum luminosity, the inferred B band magnitude luminosity function is comparable both to the AGN luminosity function of previous studies and to the low redshift quasar luminosity function derived from the 2dF redshift survey. The inferred AGN number density is approximately 1/5 of all galaxies and about of the total light of galaxies in the -band comes from the nuclear activity. The numbers of Seyfert 1s and Seyfert 2s are comparable at low luminosity, while at high luminosity, Seyfert 1s outnumber Seyfert 2s by a factor of 2-4. In making the luminosity function measurements, we assumed that the nuclear luminosity is independent of the host galaxy luminosity, an assumption we test a posteriori, and show to be consistent with the data. Given the relationship between black hole mass and host galaxy bulge luminosity, the lack of correlation between nuclear and host luminosity suggests that the main variable that determines the AGN luminosity is the Eddington ratio, not the black hole mass. This appears to be different from luminous quasars, which are most likely to be shining near the Eddington limit.
1 Introduction
Active Galactic Nuclei (AGN), including high-luminosity quasars and low-luminosity Seyferts or LINERs, are among the most intriguing objects in the universe. The optical luminosity functions of AGN overall, as well as different types of AGN, hold important clues about the demographics of the AGN population, which in turn provide strong constraints on physical models and evolutionary theories of AGN. Many attempts have been made to derive the luminosity function of quasars (Schmidt & Green 1983; Marshall et al. 1983; Boyle et al. 1988, 1990, 2000; Hewett, Foltz & Chaffee 1993; Schmidt, Schneider & Gunn 1995; Hawkins & Veron 1995; Koehler et al. 1997; Goldschmidt & Miller 1998; La Franca & Cristiani 1997, 1998; Fan et al. 2001). The largest study to date is that of Croom et al. (2004), who evaluate the QSO luminosity function and its cosmological evolution from the combined 2dF QSO Redshift Survey and 6dF QSO Redshift Survey. Their luminosity function covers a luminosity range of (with ) and redshift range of . However, selecting AGN via their colors requires that the nuclear luminosity be at least comparable to the host galaxy luminosity to be detected. Therefore this method is biased against low luminosity AGN.
To extend the AGN optical luminosity function to low luminosities, where the contribution of the host galaxy can equal or exceed that of the AGN, we must select AGN via their spectroscopic features in a galaxy redshift survey. Huchra & Burg (1992) selected 25 Seyfert 1s and 23 Seyfert 2s from the CfA redshift survey (Huchra et al. 1983), and used these AGN to measure their luminosity functions. More recently, Ho et al. (1997a) carried out a careful and uniform spectroscopic survey of 486 nearby galaxies selected from the RSA catalog (Sandage & Tammann 1981) using very small apertures centered on the nuclei. From these galaxies they found 211 AGN, including 94 LINERs, 65 transition objects and 52 Seyferts. Ulvestad & Ho (2001) obtained an optical AGN luminosity function from their sample. Vila-Vilaro (2000) used this sample as well as the starforming galaxy sample to estimate the shape of the luminosity functions for Seyferts, LINERs, transition objects and starforming galaxies. The luminosity functions obtained from these analyses extended to much lower AGN luminosities, , than that obtained from color-selected AGN samples, but they suffer from two disadvantages: 1) the AGN samples are small, therefore the luminosity functions obtained from these samples are subject to large uncertainties, and 2) previous studies all used the B band magnitude of the entire galaxy instead of the nuclear luminosity as the variable in their luminosity functions. As a result, the luminosity functions are severely contaminated by the AGN host galaxies. In order to overcome these disadvantages, large redshift surveys and careful evaluation of the luminosity functions are needed. The Sloan Digital Sky Survey (SDSS), with its large number of high quality spectra available, provides us a great opportunity to finally fulfill this.
The SDSS (York et al. 2000; Stoughton et al. 2002; Abazajian et al. 2003, 2004) is an imaging (Gunn et al. 1998) and spectroscopic survey that will eventually cover approximately one-quarter of the Celestial Sphere and collect spectra of galaxies and quasars. Software pipelines automatically perform the data processing: astrometry (Pier et al. 2003); source identification, deblending and photometry (Lupton et al. 2001); photometric calibration (Fukugita et al. 1996; Smith et al. 2002); spectroscopic target selection (Eisenstein et al. 2001; Strauss et al. 2002; Richards et al. 2002); spectroscopic fiber placement (Blanton et al. 2003a) and spectroscopic data reduction. The SDSS spectra are of high quality with spectral resolution of about 2000 and typical signal to noise ratio of 16 per pixel for the galaxy sample. This allows construction of a uniform large sample of AGN identified from their spectroscopic features.
Hao et al. (2005) (Paper I) described the selection of AGN from the SDSS spectroscopic data. We start from a low-redshift () galaxy sample that is complete in band Petrosian magnitude at 17.77 (Strauss et al. 2002) over 1151 square degrees (see Zakamska et al. 2003 for a selection of high redshift type II quasars from the SDSS). To properly measure the emission-line properties of these galaxies, we applied a stellar-subtraction procedure to each galaxy in the sample with a set of absorption templates developed from a Principal Component Analysis (PCA) of SDSS absorption-line galaxies. The broad-line AGN are identified by their broad emission line width: they all satisfy Full Width at Half Maxima of (FWHM())1,200 km s-1, a natural break point in the distribution of line widths. The narrow-line AGN are selected via their locations in the emission-line ratio diagnostic diagrams (Veilleux & Osterbrock 1987). Kewley et al. (2001) developed theoretical upper-limits for starburst galaxies in the diagrams and proposed them to be used as the criteria to separate narrow-line AGN from the usual star-forming galaxies. Kauffmann et al. (2003) plot the SDSS galaxies in the [OIII]/ [NII]/ diagram and noticed that the galaxies naturally separate into two branches. They suggest classifying the galaxies in the second branch with higher [NII]/ value as AGN. The separation point of the two branches lies well below Kewley’s separation line in the diagram. Therefore, the Kauffmann criterion selects many more narrow-line AGN than Kewley’s criteria. In Paper I, we applied both criteria and compiled an AGN sample containing 1317 broad-line AGN, 3074 narrow-line AGN via Kewley’s separation and 10,700 narrow-line AGN via Kauffmann’s criteria. Because they are basically low-luminosity AGN, in this paper we will sometimes call these AGN Seyferts and refer to the broad-line AGN sample as the Seyfert 1 sample, the narrow-line AGN sample selected via Kewley’s separation as the Seyfert 2 sample and that selected via Kauffmann’s criteria as the Seyfert 2∗ sample.
To measure the luminosity function, we first need to evaluate the selection function; this is discussed in . We define our emission line AGN luminosity functions and describe our method to measure them in . In we show the luminosity function results. In , we apply several a posteriori checks on our luminosity function results and the assumptions used in deriving them. We further compare our results with the AGN luminosity functions obtained from previous studies in . In we discuss issues related to the reddening correction and we summarize in . Throughout this paper, we will be using a cosmology with and .
2 Selection Function
SDSS spectra are taken with a fixed aperture, thus the observed spectra represent the sum of both the nuclear light and part or all of the host galaxy light. The continuum component of the low-luminosity AGN are difficult to separate from the host galaxy spectrum. Therefore we choose to use the emission-line luminosities to represent the nuclear luminosities and as variables in the AGN luminosity function. Emission lines, such as [OIII], and [OII] are good representatives of nuclear activity, except that in some galaxies the emission lines also include a contribution from star-forming activity. As explained in Paper I and further in Section 4, this contamination is not severe for AGN identified via Kewley’s criteria, since they are galaxies that are dominated by AGN components. AGN selected via Kauffmann’s criteria, however, might suffer this contamination since many of them are AGN + starburst galaxies. As demonstrated in Kauffmann et al. (2003), the [OIII] emission lines for these galaxies, however, include little contamination from star formation. Thus, the [OIII] luminosity function derived from the narrow-line AGN sample using the Kauffmann et al. criteria will also be a good indicator of AGN activity. In this paper, we will obtain the , [OIII] and [OII] luminosity functions for samples obtained by the criteria both of Kewley et al. (2001) and Kauffmann et al. (2003).
As described in Paper I and Section 1, the selection criteria for our AGN include both an overall galaxy magnitude cut and selection via certain spectral features. Thus the detection probability will depend not only on the emission line luminosity, but also the spectral features of the host galaxy, associated noise, and the overall galaxy luminosity, which are different for each AGN. Therefore we will use Monte-Carlo simulations that include all these factors to obtain the detection probability function for each AGN.
The basic idea of the simulation is to evaluate the probability of classifying a given object in our sample as an AGN, as a function of the nuclear luminosity. We make a simplifying assumption to allow us to continue: we assume that the nuclear luminosity of an AGN (as represented by emission-line luminosity) is independent of its host galaxy luminosity. Therefore, as the nuclear luminosity changes in the simulation, the properties of the host galaxy and its associated noise are kept unchanged. This assumption is not obviously true and has significant physical implications of its own. We will show in that our data are consistent with this assumption.
Based on the selection criteria described above, there are several possible reasons that an AGN will not be identified as the nuclear luminosity is decreased. First, if the nuclear luminosity is too weak, the emission lines will be undetectable. Second, as the emission line strength is decreased, the noise in the measurement of the emission line ratios and the emission line width will increase. For AGN near the limit of the selection criteria, this noise will sometimes cause them to be no longer identified as AGN. Third, as the nuclear luminosity is decreased, the overall flux of the galaxy, which is the sum of contributions from the nucleus and the host galaxy, is decreased as well. When the total brightness reaches the galaxy target magnitude limit ( band Petrosian magnitude equal to 17.77) the AGN will drop out of our sample. Therefore, the detection probability increases as the nuclear luminosity increases. The detailed behavior depends on the spectral features of individual spectra, which are different from object to object. Therefore our simulations are carried out on an object to object basis.
If we denote the original spectrum of an AGN observed in a aperture as and the emission line spectrum obtained after the continuum subtraction (Paper I) as , then we can build a pure emission-line spectrum from that contains only the emission lines relevant to the AGN identification by multiplying by a window function:
| (1) |
Here, the are the central wavelengths corresponding to , H, [OIII] [OIII], [NII], [SII] and [OI]. , where is the Gaussian width of the line . If two components are preferred in the fitting for or , we use the width of the broader component (Paper I).
We use to represent the nuclear spectrum and represents the host galaxy spectrum. During the simulation, we evaluate the corresponding detection probability while changing the nuclear luminosity, i.e., the flux of the emission line spectrum , by scaling by a constant . Based on our assumption of no correlation between AGN and galaxy luminosity, the host galaxy spectrum and the associated noise should be kept unchanged. However, when is decreased, the noise within the relevant emission line range is scaled down accordingly, even though the host galaxy, which may dominate the spectrum, is unchanged. Therefore to keep the noise within the emission line range unchanged, we generate a noise spectrum. The noise associated with each wavelength pixel is randomly generated following a Gaussian distribution. The amplitude of the noise is chosen to be comparable to the noise of the original spectrum at each pixel. The noise spectrum is multiplied by the emission-line window function of Equation 1, thus the host galaxy spectrum outside of the emission-line range is unchanged. If we denote the final noise spectrum as , we can build a new spectrum with decreased nuclear luminosity and emission line strength as:
The whole process of AGN identification, including stellar subtraction, is applied to this new spectrum to check if it still identified as an AGN, i.e., for broad-line AGN, if its emission line has FWHM larger than 1,200 km s-1 and for narrow-line AGN, if its emission-line ratios satisfy the AGN emission line ratio criteria (Kewley et al. 2001; Kauffmann et al. 2003; Paper I).
For each specific nuclear luminosity tested, i.e., for each value of , the whole process is repeated ten times, each with a different randomly generated noise spectrum . The detection probability associated with this nuclear luminosity and therefore this coefficient is given by the number of times the new spectrum is identified as an AGN, divided by the total number of tests, namely ten.
The detection probability as a function of nuclear luminosity therefore can be obtained by carrying out this simulation for a series of nuclear luminosities, i.e., a series of coefficients . The values of are chosen to allow luminosities between and in logarithmic steps of .
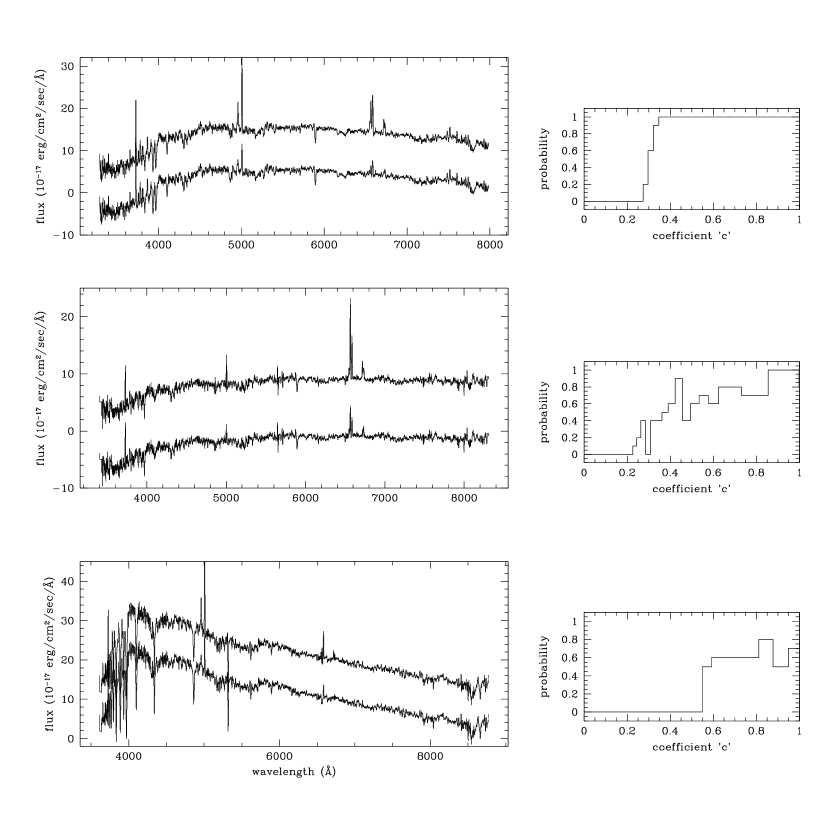
The simulation is done for each AGN in our sample, resulting in a detection probability function as a function of . For most AGN, the detection probability function is a monotonic function of AGN luminosity, from zero at low nuclear luminosity, to unity when the nuclear luminosity is equal to or less than the original nuclear luminosity, as shown in Figure 1(a). For some other AGN like that in Figure 1(b), the simulation noise overwhelms the signal and the detection probability function is not monotonic, but fluctuates before it reaches unity. This often happens to AGN near the limits of the selection criteria, i.e., for narrow-line AGN, these are galaxies located close to the AGN/starforming galaxy separation lines in the emission-line ratio diagram; or for broad-line AGN, they have FWHM close to 1,200 km s-1. As the nuclear emission lines become weaker, the noise becomes more prominent and begins to affect the measured emission line properties.
Some AGN have detection probability less than unity even when the simulated nuclear luminosity has reached the original nuclear luminosity, as shown in Figure 1(c). One would imagine that there is a luminosity higher than that of the original AGN at which the detection probability would finally reach unity. However, it is hard to correctly estimate the detection probabilities for nuclear luminosities larger than the original nuclear luminosity, because of the difficulty of correctly estimating the true spectrum at higher S/N. As a result, we will simply set the detection probabilities at nuclear luminosities larger than the original one to be the value at the observed luminosity.
The detection probability as a function of discussed above is calculated purely based on detectability of spectral features. In addition, nuclear continuum in broad-line AGN contributes to the broad-band flux. Some AGN entered our sample because the nuclear continuum contribution pushed their band magnitudes above the magnitude limit of of our sample. To quantify this effect, we need to have some knowledge of the non-stellar nuclear continuum contribution which we calculate from the emission line intensities.
If we assume that the emission lines we observed in our AGN spectra are all coming from the nucleus, then they are excited by the nuclear continuum light generated by the accretion. Therefore, the intensity of the emission lines and their continuum must be correlated, at least for those objects in which the continuum is unobscured. The PSF magnitude is the closest measurement of the nuclear continuum flux. The PSF magnitudes of most low-luminosity AGN are contaminated by their host galaxies. However, if we can find some AGN with minimum host galaxy contamination, we can regard their PSF luminosity approximately as their nuclear continuum luminosity, and use them to obtain the relationship between emission line luminosity and the nuclear continuum luminosity. This relationship can then be applied to other AGN.
We start from a list of quasars selected by their colors from the SDSS (Richards et al. 2002) (not necessarily in our AGN sample). The fact that they can be selected by their colors means that their host galaxy luminosities are weak compared with their nuclear luminosities. We apply the stellar subtraction procedure as described in Paper I to these quasars, selecting objects with very weak or undetectable stellar absorption line components and use these quasars to establish the emission line luminosity vs. nuclear luminosity relationship.
Figure 2 plots the luminosity vs. the band PSF absolute magnitude for these quasars. The relationship between the two variables is very tight, demonstrating that the luminosities for these quasars are indeed excited by their nuclear luminosities. A linear fit to these data gives:
| (2) |
The slope is very close to , which is what we expect in the ideal case, i.e., constant equivalent width. The error of the y-intercept does not come directly from the fitting. Instead, we directly fit the upper and lower limit of the relationship from the plot (dashed lines in Figure 2) and quote 1/2 the difference as the error. If we assume that the SEDs of high luminosity quasars and low luminosity Seyfert 1 nuclei are similar, then Equation 2 can be used to infer the band nuclear luminosity for our AGN from their emission line strength. The host galaxy luminosity can then be inferred by subtracting the nuclear luminosity from the overall galaxy luminosity. As the AGN nuclear luminosity decreases, the overall galaxy flux decreases accordingly. The minimum nuclear luminosity for the AGN to be selected corresponds to the overall galaxy magnitude equal to the galaxy target criterion: r-band Petrosian . This places an extra constraint on the detection probability obtained from spectral features only.
Equation 2 is obtained from a sample of quasars, with the measured flux including both broad and narrow components. Therefore, the above description of evaluating nuclear luminosity only works for broad-line AGN. For narrow-line AGN in our sample, fortunately, the non-stellar continuum contribution is negligible compared to the host galaxy luminosity (Kauffmann et al. 2003). Therefore, for narrow-line AGN, we simply skip the above analysis and keep the detection probability obtained from the spectral features only.
3 Measuring the Luminosity Function
The AGN luminosity function is defined as the mean number of AGN per unit volume, per unit luminosity. In making the plot of the luminosity function without covering several magnitudes of luminosity, we also define the auxiliary quantity : the distribution of AGN per unit volume per log luminosity, given by:
| (3) |
where is the cumulative luminosity function, and is related to by . is widely used when making luminosity function plots. Throughout this paper, the luminosity functions are all plotted in this form.
The luminosity function can be measured via various methods. In this paper, we will use the non-parametric method which does not require any assumption about the luminosity function shape.
The likelihood that each AGN , with detection probability function (described in ) have luminosity L, given its redshift and host galaxy properties, is:
| (4) |
The maximum likelihood solution is the function that maximizes the overall likelihood
| (5) |
is obtained by minimizing . In this paper, we use this method to obtain non-parametric, linear-interpolated stepwise (Koranyi & Strauss 1997) luminosity functions. The detailed derivation can be found in Efstathiou, Ellis & Peterson (1988), Koranyi & Strauss (1997) and Blanton (2000).
The luminosity function derived above is not normalized. The normalization is done by directly measuring the number density of AGN, expressed as:
| (6) |
where V is the volume spanned by the galaxies in the sample and the sum is over all AGN included in this luminosity function calculation. The error associated with the normalization is:
| (7) |
The final normalized luminosity function is then .
4 Luminosity Function Results
4.1 Overall Luminosity Function
The overall Seyfert luminosity function can be obtained by combining the Seyfert 1 and Seyfert 2 samples. Here we choose to use the narrow-line AGN sample selected via Kewley’s criteria, because it is not significantly contaminated by star formation activity. The overall AGN sample includes about 4400 AGN: 1317 Seyfert 1s and 3074 Seyfert 2s in the redshift range . Since objects at higher redshifts have lower S/N and therefore higher uncertainties in the evaluation of the selection function, we limit our measurement of the luminosity function to ; this excludes about one third of the sample. The selection functions for these Seyferts takes into account whether an object is classified either as Seyfert 1 or Seyfert 2 at each luminosity, which includes the cases when the classification changes between Seyfert 1 and Seyfert 2 with changed emission line strength. Using the methodology discussed above, we obtain the overall luminosity function and plot it in Figure 3.
The Seyfert luminosity function covers a luminosity range of a factor of . We fit the luminosity function with a two-power-law formula as used in the 2dF quasar luminosity function by Croom et al. (2004):
| (8) |
where , , and are free parameters. The best fit results and the of the fit are listed in Table 1. We can also fit the curve to the Schechter (1976) function:
| (9) |
and the best fit , , are listed in Table 1 as well. Noticing that the luminosity function shape is also close to a single power-law, we fit it to a single power-law form:
| (10) |
Again, the best fit , , are listed in Table 1 (All following luminosity functions are fit with the three models and the results are all listed in Table 1). The three best-fit functions are also plotted in Figure 3. The shape of the AGN overall luminosity function is closer to a Schechter function or a two-power law shape, even though it does not differ much from a single power-law (see values in Table 1 for comparison).
The AGN number density can be estimated by integrating the AGN luminosity function over the luminosity range it covers. Using the best-fit Schechter function and within the luminosity range of to , we obtain the AGN number density as . To compare this number with the galaxy number density, we integrate the galaxy luminosity function obtained from the SDSS (Blanton et al. 2003b) over an absolute magnitude range of and obtain the galaxy number density to be in the same cosmology. Thus active galaxies in this luminosity range comprise about 19% of all galaxies (Ho et al. 1997b; Miller et al. 2003; Brinchmann et al. 2004).
Similarly, we can also obtain the luminosity density by integrating over the entire luminosity range. Since the overall luminosity function is a mix of broad plus narrow for Seyfert 1s and narrow only for Seyfert 2s, and since narrow-line AGN contribute little to the band luminosity, it is appropriate to apply the integration to just the broad-line AGN luminosity function. This LF is derived in a similar way as the overall luminosity function, and the result is shown in the inserted plot of Figure 3 (thick line with open circles). The luminosity function for all Seyferts is over-plotted (thin line with crosses) for comparison. Seyfert 1 luminosity is very close to the overall Seyfert luminosity even at the low luminosity range. The AGN luminosity density integrated over this luminosity function is . Using the relationship between luminosity and AGN -band continuum luminosity (Equation 2), we obtain the AGN -band luminosity density as . Comparing with the galaxy luminosity density obtained from Blanton et al. (2003b): , we find that the nuclear activity contributes about of the total light of galaxies in the -band.
4.2 Seyfert 1 vs. Seyfert 2 luminosity function
Our AGN sample is also sufficiently large to evaluate the narrow- and broad-line AGN luminosity functions separately. The comparison of the two can be used to demonstrate the relative number ratio of Seyfert 1s and Seyfert 2s. For this task, the overall luminosity is no longer an appropriate parameter for the luminosity function measurements. According to the unification model, the observed overall luminosity in Seyfert 1s includes both that emitted from the broad-line region and that from the narrow-line region, but the broad component is obscured in Seyfert 2s and only the narrow component is observed. Therefore, the same measured overall luminosities for broad-line and narrow-line AGN could correspond to different nuclear continuum luminosities and therefore the differences of the overall luminosity function of the two types of AGN do not necessarily reflect the real differences of the number density of Seyfert 1s and Seyfert 2s (see the inserted plot of Figure 3, Seyfert 1 luminosity function dominates even at the low luminosity range). A good luminosity function parameter would be emission line luminosities that are isotropic to Seyfert 1s and Seyfert 2s. In our study, the narrow-line component, [OIII] and [OII] luminosities are good candidates.
Since we have two narrow-line AGN samples: one selected via Kewley’s criteria, which are called Seyfert 2 sample; and another one selected via Kauffmann’s criterion, which we call Seyfert 2∗ sample, we will first compare the Seyfert 1 luminosity function with the Seyfert 2 luminosity function, then with the Seyfert 2∗ luminosity function. In obtaining the luminosity functions, the selection functions of objects in each sample are evaluated with the selection criteria only corresponding to this sample in question. Therefore, unlike the case of the total Seyfert sample, the detection probability is calculated for Seyfert 1s and Seyfert 2s separately. Figure 4, 5 and 6 plot the narrow-line component, [OIII] and [OII] emission-line luminosity functions for Seyfert 1s (crosses) and Seyfert 2s (open circles) respectively. The differences between the luminosity functions of the two types of AGN all show the same pattern: they are comparable at low luminosity, but at high luminosities, the Seyfert 2 luminosity function drops off more quickly than does that of Seyfert 1s. This demonstrates that the number ratio of Seyfert 1s and Seyfert 2s is a function of luminosity: at low-luminosity, the number density of the two types of AGN are about the same, but at high luminosity, Seyfert 1s outnumber Seyfert 2s.
One big concern of our argument of the relative number ratio of Seyfert 1s and Seyfert 2s comes from the way we define our Seyfert sample. In particular, in Seyfert 2∗ sample, which is selected via the Kauffmann’s criterion, we have about 10,700 narrow-line AGN. This is almost 3 times larger than the Seyfert 2 sample selected via the Kewley’s criteria. Our Seyfert 1 sample however is not affected by this change of criteria. Therefore selecting AGN via different criteria could dramatically change our conclusions about the number ratio of Seyfert 1s and Seyfert 2s.
To test this, we further measure the [OIII], and [OII] luminosity function for the Seyfert 2∗ sample (Figure 4, 5 and 6 open triangles), which is selected via Kauffmann’s criterion. Because of the large number of objects included in the Seyfert sample, and because our determination of the selection function typically requires several hundred Monte-Carlo simulations per object, we are unable to measure the probability function for each galaxy as we did for our Seyfert 1 and Seyfert 2 samples. Instead we randomly select 1/8 of the sample and measure their selection functions, being sure to multiply the overall normalization by 8.
Except for the high luminosity end, the and [OII] luminosity function of the Seyfert 2∗ sample is larger than that of Seyfert 2s by a factor of about 4. The Seyfert 2∗ [OIII] luminosity function, on the other hand, is only slightly larger than that of Seyfert 2s at intermediate luminosity. This is consistent with results of Kauffmann et al. (2003). In figure 2 of the paper, it can be seen that most of the Seyfert 2s that are included by Kauffmann’s criterion but not by Kewley’s criterion are those that have intermediate [OIII] luminosities. The results shown in Figure 4, 5 and 6 agree with the analysis described in Paper I and Section 1: Seyfert s selected via Kauffmann’s criterion tend to include all AGN activity, but suffer from contamination from star formation. The only exception is the [OIII] emission line, as the [OIII] contamination from star formation is relatively weak. Kewley’s criterion on the other hand only selects those galaxies that are dominated by AGN activity. Therefore, due to the contamination, the and [OII] luminosity functions of the Seyfert 2∗ sample include a star formation component and are significantly higher than those of Seyfert 2 sample, while the [OIII] luminosity function more or less reflects the real AGN distribution. When comparing the Seyfert 2∗ [OIII] luminosity function with that of Seyfert 1s, we obtain the same conclusion for the relative ratio of Seyfert 1s and Seyfert 2s as before: they are comparable at low luminosity, but Seyfert 1s outnumber Seyfert 2s at high luminosity.
A further test for the robustness of our luminosity function results can be applied by constraining the Seyfert 1 sample to include only those objects whose narrow component also satisfy the Seyfert 2 selection criteria as well (see Figure 10 in Paper I). We refer to such objects as Seyfert 1∗s. The probability function for the sample is obtained by requiring the simulated AGN to satisfy both the Seyfert 1 and Seyfert 2 criteria. Figure 7 shows the comparison of the [OIII] luminosity functions obtained from the Seyfert 1, Seyfert 2 and Seyfert 1∗ samples. The two broad-line AGN sample luminosity functions are almost the same; in particular, the comparison of the Seyfert 2 and Seyfert 1∗ luminosity functions shows the same behavior described above. Thus our conclusion of the relative number ratio of Seyfert 1s and Seyfert 2s is not sensitive to the selection criterion uncertainties.
5 The Relationship between AGN and Host Galaxy Luminosity
The selection functions we have obtained are based on the assumption that the nuclear luminosity is independent of the host galaxy luminosity. We can check this assumption by plotting the emission line luminosity against the host galaxy Petrosian luminosity for our AGN sample. Figure 8(a) shows the plot for Seyfert 2s. There seems to be a strong correlation between the two variables: brighter host galaxies appear to have stronger emission lines. But the apparent lack of galaxies at the lower-right corner of the plot is due to a selection effect: if the host galaxy is too luminous relative to the nuclear emission line strength, the host galaxy will overwhelm the active nuclear features and the object cannot be recognized as an AGN. The lack of objects on the upper-left corner, on the other hand, simply reflects the fact that AGN nuclear luminosities have upper limits: their Eddington luminosities. If we plot these AGN in small redshift ranges over which the selection effect is weak, e.g. as shown in Figure 8(b), we see little correlation between the two variables. We now carry out a more quantitative test, which involves using our luminosity function results.
Imagine that our assumption is wrong, and for Seyferts, the nuclear luminosity is generally stronger in a more luminous host galaxy. Then based on the wrong assumption, the obtained detection probability function will be underestimated at low luminosity and overestimated at higher luminosity. Therefore, the resultant luminosity function will reflect a lower density of low-luminosity objects and higher density of high-luminosity objects than there should be. If we use this incorrect luminosity function to evaluate the expected luminosity distribution of a subgroup of objects with, for example, low redshift or low host galaxy luminosity, the resultant distribution will be systematically shifted to higher luminosity than the observed distribution. Similarly, for a subgroup of objects with high redshift or high host galaxy luminosity, the calculated luminosity distribution will be shifted to lower luminosity than the observed distribution. Only if our assumption is correct will the expected luminosity distribution match up with the observed luminosity distribution for any subgroup of our sample. Based on these considerations, we apply the following tests to each of our AGN samples.
We divide our Seyfert samples (either a Seyfert 1, Seyfert 2 or Seyfert sample) into several subgroups by their redshifts. For each subgroup, we use our Seyfert luminosity function results to evaluate the AGN luminosity distribution we expect to observe (i.e., the number of Seyferts in the samples as a function of redshift), which can be written as:
| (11) |
where the sum is over all Seyferts in a subsample. We compare with the observed number of Seyferts in this subsample between and . Figure 9(a) demonstrates the comparison using the Seyfert 2 luminosity function. The observed and expected luminosity distributions agree very well with each other. It is not surprising that the two match perfectly for the entire Seyfert 2 sample, since the luminosity function is measured from this sample. But the fact that they agree in each redshift bin demonstrates that our luminosity function reflects the true Seyfert 2 distribution. In addition, this demonstrates that our assumption of the independence of AGN and host galaxy luminosity is reasonable.
We next run a similar test by dividing the Seyfert 2 sample via host galaxy luminosity. By doing so, we can directly examine the relationship between nuclear luminosities and host galaxy luminosities. Figure 9(b) shows the result of this test for the Seyfert 2 luminosity function. Higher luminosity Seyfert 2 galaxies have more luminous emission lines (as they tend to be at higher redshift on average), as we saw in Figure 8(a). However, in each subgroup, the observed and expected luminosity distributions match up impressively well, which gives us a quantitative confirmation that the nuclear luminosities for Seyfert 2s are indeed not strongly correlated with the host galaxy luminosities.
In Figure 10, we show the tests done for the Seyfert 1 sample via the [OIII] luminosity function. It is still a perfect match between the observed and expected luminosity distribution for every redshift and host galaxy magnitude subgroup. This demonstrates that the host and AGN luminosities are not strongly correlated for Seyfert 1s either.
We apply similar tests for other luminosity functions, and always found good match between the expected and observed luminosity distribution.
As a further test of the correlation between host galaxy and nuclear luminosity, we apply a correlation test to our Seyfert samples. Correlation tests for truncated data sets have been developed by Efron & Petrosian (1992) and Maloney & Petrosian (1999). Our sample is a one-side truncated sample in flux. Fan et al. (2001) discussed the correlation test for a one-side truncated sample with non-sharp selection probability, which is appropriate in our study.
For each of our AGN samples, we have a one-side-truncated data set , where and are the emission line luminosity and host galaxy luminosity of the th AGN in the sample. For each AGN in the sample, we can define a comparable data set as:
| (12) |
We denote the number of points in the set as . Each AGN in the data set has a detection probability , thus the total number of AGN that have nuclear luminosity larger than , taking into account those that are missed by selection effects, should be:
| (13) |
Assuming that and are independent, we sort by their host galaxy luminosities. The rank of among the objects, which is defined as:
| (14) |
should be distributed uniformly between 0 and . The expectation value of the distribution is then and its variance . We can construct Kendall’s -statistic:
| (15) |
If , the nuclear luminosity and host galaxy luminosity are not correlated at the level and can be treated as independent.
We assume a relationship between the host galaxy luminosity and nuclear luminosity with a power-law index :
| (16) |
and run the data set through the correlation test to find the value for (when ) and its error (the differences of when and ). Table 2 lists the results for Seyfert 1s, Seyfert 2s and the full Seyfert sample when is represented by [OIII] and luminosities respectively. in all cases. We conclude that the nuclear luminosity is essentially independent of the host galaxy luminosity for all Seyferts in our sample.
The above statement is obtained from our AGN sample, which unfortunately covers only a small range of host galaxy luminosity. Outside of this luminosity range, the independence of the host and nuclear luminosity might not hold. For example, Kauffmann et al. (2003) suggested that AGN of all luminosities reside almost exclusively in massive galaxies. Within this regime, there is only a very weak dependency of nuclear luminosity and galaxy mass, which is in agreement with our result. But the probability of a galaxy to host an AGN drops dramatically at galaxy masses lower than a few .
6 Comparing LFs with Previous Work
Most previous AGN luminosity function results obtained in the literature have been functions of B band magnitude. To make comparisons of our luminosity function results with previous investigators, we need to relate the emission line luminosity with the AGN nuclear continuum in the B band. In , we have found that quasars with little host galaxy contamination show a tight relation between their emission line luminosities and band PSF magnitudes. We assume that all AGN follow the equivalent relationship found with the -band absolute magnitude:
| (17) |
Again, as in equation (2), the error in the y-intercept is chosen to include the scatter of the relationship. With this equation, luminosity function can be converted to the band luminosity function. Based on the general quasar color model (Schneider et al. 2002, 2003; Hopkins et al. 2004), we found at around . Also noticing that for normal quasars, , we can use the simple relationship:
| (18) |
to convert the band luminosity function further to B band.
Figure 11 shows the converted B band magnitude luminosity function for all Seyferts. The uncertainties in equation (17) are also shown (dashed line). The AGN luminosity function results of Huchra & Burg (1992) are plotted as triangles, while those of Ulvestad & Ho (2001) are plotted as stars. Both results have been converted to . Their choice of are also different from ours, but this won’t make much difference at our redshift. In the region of overlap, these results are in good agreement with ours, although ours reach to much fainter luminosities. We should bear in mind that Huchra & Burg and Ulvestad & Ho used host galaxy luminosities without isolating the nuclear luminosity as we did. Therefore their luminosity function is much flatter than ours since low-luminosity AGN can easily be buried in host galaxy luminosities and be undetected. But since their sample basically covers the high-luminosity end of the AGN population, their luminosity function is not severely contaminated.
To compare our luminosity function results with high redshift quasar luminosity functions, we take the 2dF QSO luminosity function obtained by Croom et al. (2004) and converting it to our assumed cosmology. In Figure 12, we plot our B band AGN luminosity function (solid line with dotted lines as error range) and converted 2dF QSO luminosity function (dashed line with triangles). Our low-redshift AGN luminosity function agrees very well with the quasar luminosity function for the lowest redshift range. However, our data show that the faint end of the 2dF QSO luminosity function at low redshifts does not flatten out. This reveals that the color selection of quasars is subject to incompleteness at the low-luminosity range where the host galaxy dominates (Boyle et al. 2000). Unfortunately, the large uncertainty on our luminosity function, due to the scatter of the conversion from the luminosity to the B band magnitude, makes it difficult to draw conclusions about AGN evolution from (our result) to (the lowest redshift of 2dF QSO LF). The ongoing effort of getting the quasar luminosity function from the SDSS will test this directly.
7 Reddening Correction
The luminosities measured in this paper are not corrected for any reddening of the AGN by material in the vicinity of the AGN or the host galaxy. However, reddening is an important factor that can dramatically change the observed luminosity of an AGN. The standard method of reddening correction is to measure the Balmer decrements and assume an intrinsic value (e.g. 2.86) and a reddening function (e.g. Seaton 1979; Charlot & Fall 2000). However, AGN with large Balmer decrements have been observed before (Anderson 1970; Baldwin 1975; Weedman 1977; Rix et al. 1990; Goodrich 1990; Barcons et al. 2003), many of these can not be simply explained by dust obscuration. Instead, AGN might have a higher intrinsic ratio, probably because of higher densities and radiative transfer effects. In addition, the relative distribution of dust and emission line gas can be quite complicated, while most models assume that the dust lies in a screen in front of the line-emitting regions. Due to these difficulties and uncertainties, we believe it is not appropriate to do a standard reddening correction using observed Balmer decrements, even though reddening is clearly present. The whole issue of AGN obscuration needs much further investigation and multiwavelength observations from infrared and X-ray, and is beyond the scope of this paper. We will leave the luminosity function derived in this paper reddening uncorrected until reliable and accurate AGN reddening correction methods are developed.
8 Summary and Discussion
Using the AGN sample obtained from Paper I, we have evaluated the AGN [OIII] and emission line luminosity functions. Because of the complexity of our AGN selection criteria, we use a Monte-Carlo simulation for each AGN to obtain its selection probability function. The overall emission line luminosity function for Seyferts covers a broad range of luminosity and approximately follows a two power-law form. After converting to B band magnitude luminosity functions, we found that our results are comparable to the luminosity function obtained by Huchra et al. (1992) from the CfA redshift survey and Ulvestad & Ho (2001) from the Palomar spectroscopic survey of nearby galaxies. It also agrees well with the low-redshift bin of the 2dF QSO luminosity function by Croom et al. (2004). By integrating the overall luminosity function from to , we obtain the AGN number density of 0.018 Mpc-3, approximately 20% of all galaxies. We also estimated the AGN band luminosity density as , which is about of the luminosity density of galaxies.
The comparison of the [OIII] luminosity functions for Seyfert 1s and Seyfert 2s reveals that the relative number ratio of the two types of AGN is a function of luminosity: at low luminosity, the ratio of Seyfert 1s to Seyfert 2s is about one, while at high luminosities, Seyfert 1s outnumber Seyfert 2s. The conclusion is not sensitive to the uncertainties in the selection criteria. The paucity of narrow-line objects in high luminosity AGN is unexpected in the simplest unification model, and various models have been proposed to accommodate it. For example, Lawrence (1991) proposed that the opening angle of the dust torus is larger for more luminous AGN, presumably because increased luminosity means more dust sublimation, and thus the broad-line region can be seen over a larger opening angle. Königl & Kartjel (1994) proposed a disk-wind AGN model, in which the radiation pressure force flattens the dust distribution in objects with comparatively high bolometric luminosities, thus the opening angle of the dust torus becomes larger for more luminous AGN. Our result for the first time gives the opportunity to determine the detailed opening angle as a function of luminosity and will provide detailed constraints to various models. This will be fully investigated in future papers. To fully understand the physics behind the lack of Seyfert 2s at high luminosity, multiwavelength observations of AGN, especially the infrared will be necessary. By directly measuring dust emission in Seyfert 1s and Seyfert 2s, various dust properties can be determined, and will help to understand if dust is playing a major role in the difference between Seyfert 1s and Seyfert 2s.
Our AGN luminosity function is obtained by assuming that the AGN nuclear luminosities are independent of the host galaxy luminosities. Detailed verification of this assumption has been carried out and we show strong evidence that the two variables are not strongly correlated. Assuming that AGN are hosted by normal galaxies, their host galaxy bulge luminosities are well correlated with their velocity dispersions, which in turn are strongly correlated with the central black hole masses (Gebhardt et al. 2000; Ferrarese & Merritt 2000; Ferrarese et al. 2001; Tremaine et al. 2002). The independence of the nuclear luminosity and the host galaxy luminosity implies that the nuclear luminosity does not depend on the central black hole mass (Heckman et al. 2004). Therefore, for the AGN in our sample, the principal variable that determines the nuclear luminosity is the Eddington ratio, defined as , instead of the black hole mass.
The independence of AGN nuclear luminosities and their central black hole masses is supported by several observations. For example, Woo & Urry (2002) compiled a sample of 377 AGN with known black hole masses and calculated bolometric luminosities for 234 AGN among them. When relating these bolometric luminosities with their black hole masses, they found no significant correlation between the two variables. O’Dowd & Urry (2002) also reported a very weak trend between the nuclear and host luminosities for a sample of radio loud AGN.
However, the same statement does not seem to work for high-redshift quasars. A black hole mass inferred from the observed luminosity is a lower limit. Thus given their high luminosities, one would infer implausibly high black hole mass () if the most luminous quasars are accreting at substantially sub-Eddington rates. (see Vestergaard et al. 2002 for black hole mass measurements for high-redshift quasars). Thus, it will be interesting to explore the transition from low to high Eddington rate accretion (McLure & Dunlop 2004). Hopefully, the ongoing evaluation of the quasar luminosity function obtained from the SDSS will yield insights on this issue.
Our result will also bring insights to X-ray background and UV background problems. Detailed investigation is beyond the scope of the current paper. The multiwavelength observation of the sample will be explored in future papers.
Acknowledgments. We would like to thank Lisa Kewley for useful discussions and comments and Scott Croom for providing the latest 2dF quasar luminosity function values.
Funding for the creation and distribution of the SDSS Archive has been provided by the Alfred P. Sloan Foundation, the Participating Institutions, the National Aeronautics and Space Administration, the National Science Foundation, the U.S. Department of Energy, the Japanese Monbukagakusho, and the Max Planck Society. The SDSS Web site is http://www.sdss.org/.
The SDSS is managed by the Astrophysical Research Consortium (ARC) for the Participating Institutions. The Participating Institutions are The University of Chicago, Fermilab, the Institute for Advanced Study, the Japan Participation Group, The Johns Hopkins University, the Korean Scientist Group, Los Alamos National Laboratory, the Max-Planck-Institute for Astronomy (MPIA), the Max-Planck-Institute for Astrophysics (MPA), New Mexico State University, University of Pittsburgh, Princeton University, the United States Naval Observatory, and the University of Washington.
L.H. and M.A.S. are supported in part by NSF grant AST-0071091 and AST-0307409. L.H. acknowledges the support of the Princeton University Research Board.
References
- (1)
- (2) Abazajian, K. et al. , 2003, AJ, 126, 2081
- (3)
- (4) Abazajian, K. et al. , 2004, AJ, 128, 502
- (5)
- (6) Anderson, K. S., 1970, ApJ, 162, 743
- (7)
- (8) Baldwin, J. A., 1975, ApJ, 201, 26
- (9)
- (10) Barcons, X., Carrera, F. J., Ceballos, M. T., 2003, MNRAS, 339, 757
- (11)
- (12) Blanton, M. R., 2000, ApJ, 544, 63
- (13)
- (14) Blanton, M. R., et al. 2003a, AJ, 125, 2276
- (15)
- (16) Blanton, M. R., et al. 2003b, ApJ, 592, 819
- (17)
- (18) Boyle, B. J., Shanks, T., Peterson, B. A., 1988, MNRAS, 317, 935
- (19)
- (20) Boyle, B. J., Fong, R., Shanks, T., Peterson, B. A., 1990, MNRAS, 317, 1
- (21)
- (22) Boyle, B. J., et al. , 2000, MNRAS, 317, 1014
- (23)
- (24) Brinchmann, J., Charlot, S., White, S. D. M., Tremonti, C., Kauffmann, G., Heckman, T., Brinkmann, J. 2004, MNRAS, 351, 1151
- (25)
- (26) Charlot, S., Fall, S. M., 2000, ApJ, 539, 718
- (27)
- (28) Croom, S. M., Smith, R. J., Boyle, B. J., Shanks, T., Miller, L., Outram, P. J., Loaring, N. S., 2004, MNRAS, 349, 1397
- (29)
- (30) Efron, B., & Petrosian, V., 1992, ApJ, 399, 345
- (31)
- (32) Efstathiou, G., Ellis, R. S., & Peterson, B. S., 1988, MNRAS, 232, 431
- (33)
- (34) Eisenstein, D. J., et al. 2001, AJ, 122, 2267
- (35)
- (36) Fan, X., et al. 2001, AJ, 121, 54
- (37)
- (38) Ferrarese, L., and Merritt, D. 2000, ApJ, 539, L9
- (39)
- (40) Ferrarese, L. et al. 2001, ApJ, 555, L79
- (41)
- (42) Fukugita, M., Ichikawa, T., Gunn, J. E., Doi, M., Shimasaku, K., & Schneider, D. P. 1996, AJ, 111, 1748
- (43)
- (44) Gebhardt, K. et al. 2000, ApJ, 539, L13
- (45)
- (46) Goldschmidt, P., Miller, L., 1998, MNRAS, 317, 107
- (47)
- (48) Goodrich, R. W., 1990, ApJ, 355, 88
- (49)
- (50) Gunn, J. E., et al. 1998, AJ, 116, 3040
- (51)
- (52) Hao, L., et al. 2005, in preparation, (Paper I)
- (53)
- (54) Hawkins, M. R. S., Veron, P., 1995, MNRAS, 317, 1102
- (55)
- (56) Heckman, T. M., Kauffmann, G., Brinchmann, J., Charlot, S., Tremonti, C., White, S. D. M. 2004, ApJ, 613, 109
- (57)
- (58) Hewett, P. C., Foltz, C. B., Chaffee, F. H., 1993, ApJ, 317, L43
- (59)
- (60) Ho, L. C., Filippenko, A. V. & Sargent, W. L. W. 1997a, ApJS, 112, 315
- (61)
- (62) Ho, L. C., Filippenko, A. V. & Sargent, W. L. W. 1997b, ApJ, 487, 568
- (63)
- (64) Hopkins, P. F., et al. 2004, AJ, 128, 1112
- (65)
- (66) Huchra, J., Burg, R. 1992, ApJ, 393, 90
- (67)
- (68) Huchra, J., Davis, M., Latham, D., Tonry, J. 1983, ApJS, 52, 89
- (69)
- (70) Kauffmann, G., et al. 2003, MNRAS, 346, 1055
- (71)
- (72) Kewley, L. J., Dopita, M. A., Sutherland, R. S., Heisler, C. A., Trevena, J. 2001, ApJ, 556, 121
- (73)
- (74) Koehler, T., Groote, D., Reimers, D., Wisotzki, L., 1997, A&A, 317, 502
- (75)
- (76) Königl, A., Kartje, J.F., 1994, ApJ, 434, 446
- (77)
- (78) Koranyi, D. M. & Strauss, M. A., 1997, ApJ, 477, 36
- (79)
- (80) Lawrence, A., 1991, MNRAS, 252 586
- (81)
- (82) La Franca, F., Cristiani, S., 1997, AJ, 317, 1517
- (83)
- (84) La Franca, F., Cristiani, S., 1998, AJ, 317, 1688[Erratum to La Franca & Cristiani 1997]
- (85)
- (86) Lupton, R. H., Gunn, J. E., Ivezic, Z., Knapp, G. R., Kent, S., & Yasuda, N. 2001, in ASP Conf. Ser. 238, Astronomical Data Analysis Software and Systems X (San Francisco: ASP), 269
- (87)
- (88) Maloney, A., & Petrosian, V. 1999, ApJ, 518, 32
- (89)
- (90) Marshall, H. L., Tananbaum, H., Avni, Y., Zamorani, G., 1983, ApJ, 317, 35
- (91)
- (92) McLure, R. J., Dunlop, J. S. 2004, MNRAS, 352, 1390
- (93)
- (94) Miller, C. J., Nichol, R. C.; Gómez, P. L., Hopkins, A. M. & Bernardi, M. ApJ, 2003, 597, 142
- (95)
- (96) Pier, J. R., et al. 2003, AJ, 125, 1559
- (97)
- (98) O’Dowd, M., Urry, C. M.; Scarpa, R., 2002, ApJ, 580, 960
- (99)
- (100) Richards, G. T., et al. 2002, AJ, 123, 2945
- (101)
- (102) Rix, H.-W., Carleton, N. P., Rieke, G., Rieke, M., 1990, ApJ, 363, 480
- (103)
- (104) Sandage, A., & Tammann, G. 1981, A Revised Shapley-Ames Catalog of Bright Calaxies (Carnegie Inst. Washington Pub. 635)
- (105)
- (106) Schechter, P., 1976, ApJ, 203, 297
- (107)
- (108) Schmidt, M., & Green, R. F. 1983, ApJ, 269, 352
- (109)
- (110) Schmidt, M., Schneider, D. P., Gunn, J. E., 1995, AJ, 110, 68
- (111)
- (112) Schneider, D. P., et al. , 2002, AJ, 123, 567
- (113)
- (114) Schneider, D. P., et al. , 2003, AJ, 126, 2579
- (115)
- (116) Seaton, M. J., 1979, MNRAS, 187, 73
- (117)
- (118) Smith, J. A., et al. 2002, AJ, 123, 2121
- (119)
- (120) Stoughton, C., et al. 2002, AJ, 123, 485
- (121)
- (122) Strauss, M. A., et al. , 2002, AJ, 124, 1810
- (123)
- (124) Tremaine, S., et al. , 2002, ApJ, 574, 740
- (125)
- (126) Ulvestad, J. S. & Ho, L. C., 2001, ApJ, 558, 561
- (127)
- (128) Veilleux, S., & Osterbrock, D. E. 1987, ApJS, 63, 295
- (129)
- (130) Vestergaard, M., 2002, ApJ, 571, 733
- (131)
- (132) Vila-Vilaro, B., 2000, PASJ, 52, 305
- (133)
- (134) Weedman, D. W., 1977, ARA&A, 15, 69
- (135)
- (136) Woo, J.-H. & Urry, C. M., 2002, ApJ, 579, 530
- (137)
- (138) York, D. G. et al. 2000, AJ, 120, 1579
- (139)
- (140) Zakamska, N., et al. 2003, AJ, 126, 2125
- (141)


| Schechter function | two-powerlaw function | one-powerlaw function | |||||||||||||
|---|---|---|---|---|---|---|---|---|---|---|---|---|---|---|---|
| AGN sample | /DOF | /DOF | /DOF | ||||||||||||
| All Seyfert | -1.94 | 17.3/25 | 2.78 | 1.88 | 16.7/24 | -2.02 | 26.8/25 | ||||||||
| Sey 2 | -1.90 | 58.9/18 | 2.91 | 1.77 | 44.7/17 | -2.05 | 119.5/18 | ||||||||
| Sey 1 | -2.02 | 31.1/23 | 5.12 | 2.05 | 30.0/22 | -2.07 | 33.0/23 | ||||||||
| Sey 1 narrow | -1.87 | 32.2/25 | 2.66 | 1.54 | 18.6/24 | -2.02 | 55.2/25 | ||||||||
| Sey 2∗ | -2.06 | 115.0/20 | 4.68 | 2.08 | 105.1/19 | -2.12 | 122.3/20 | ||||||||
| All Seyfert [OIII] | -2.15 | 226.5/24 | 2.16 | 2.15 | 226.3/23 | -2.15 | 226.3/24 | ||||||||
| Sey 2 [OIII] | -2.35 | 213.0/22 | 2.35 | 2.35 | 210.1/21 | -2.35 | 210.1/22 | ||||||||
| Sey 1 [OIII] | -2.04 | 56.0/18 | 2.07 | 2.08 | 58.7/17 | -2.07 | 58.7/18 | ||||||||
| Sey 2∗ [OIII] | -2.14 | 62.5/15 | -2.15 | 62.1/15 | |||||||||||
| Sey 2 [OII] | -1.58 | 104.0/17 | 3.23 | 1.29 | 35.4/16 | -1.97 | 294.7/17 | ||||||||
| Sey 1 [OII] | -1.59 | 36.7/17 | 2.94 | 0.83 | 14.5/16 | -2.03 | 64.4/17 | ||||||||
| Sey 2∗ [OII] | -1.62 | 57.9/9 | 3.29 | 0.55 | 8.1/8 | -2.10 | 104.1/9 | ||||||||
Note. — is in unit of , and is in unit of
| AGN Sample | () | |
|---|---|---|
| Seyfert 1s | [OIII] | 0.0088 0.0012 |
| Seyfert 2s | [OIII] | -0.0029 0.0009 |
| All Seyferts | [OIII] | 0.0003 0.0007 |
| Seyfert 1s | 0.0094 0.0011 | |
| Seyfert 2s | 0.0073 0.0008 | |
| All Seyferts | 0.0043 0.0006 |