Hidden bipolarity in red supergiant winds
Abstract
Many observations of late-type M stars show large near-spherical circumstellar envelopes, yet planetary nebulae and supernova remnants are frequently axisymmetric. We present VLBI and MERLIN observations of masers around the red supergiant S Per which show varying degrees of axisymmetry and a dynamically significant magnetic field. There is no evidence for rotation here or in most similar objects. We examine possible origins of the magnetic field.
1 Introduction
Red supergiants (RSG) with progenitor masses M⊙ are high-mass analogues of Asymptotic Giant Branch (AGB) stars such as Mira variables, typically one or a few M⊙. Both classes of star have surface temperatures of 2000 – 3000 K and pulsational periods of up to a few years. SiO, H2O and OH masers are found in the winds and show that the outflow velocities are similar to within a factor of two. Such properties appear to be determined by small-scale physics, such as the opacity of the stellar atmosphere or the absorptivity of dust, and hence depend primarily on the local chemical composition.
Other phenomena do scale with the stellar mass. RSG have stellar radii of au and mass loss rates , at least ten times higher than those of AGB stars. For all such stars the H2O maser zone extends from containing clouds of average radius in this region (or a birth radius , if they originate from the surface of the star and expand with the wind). The survival times of maser emission from the clouds scales with their size and is 5 – 10 yr in RSG.
Most evolved stars which support masers have no detectable rotation of either the stellar surface or the wind and the presence of a companion would disrupt masing. The archetype OH/IR stars or H2O envelopes around RSG, for example, appear almost spherical at moderate resolutions. This contrasts with the usually axisymmetric shape of planetary nebulae or into supernova remnants. Early signs of this can be discerned in high-resolution studies of AGB/RSG stars (e.g. Bowers et al. 1989, Bains et al. 2003; Murakawa et al. 2003; Etoka & Diamond 2003), implicating the magnetic fields detected by e.g. Chapman & Cohen (1986); Szymczak et al. (1998, 1999). We use VLBI and MERLIN observations of OH and other masers to investigate the CSE of S Per. This RSG has a distance of 2.3 kpc (Schild 1967) and a stellar velocity km s-1 (Diamond et al. 1987). We compare the results for S Per with those for other stars and with magnetic field models.
2 Past and present observations of S Per

In 1997 Masheder et al. (1999) observed S Per and VX Sgr with Global VLBI. The data were correlated in Socorro to give a velocity resolution of 0.176 km s-1. We took great care in calibration and editing to remove instrumental offsets between LL and RR and between the 1665- and 1667-MHz bands, on all baseline lengths. We then imaged the brightest channel of the brightest S Per line to use as a model for iterative phase and amplitude self-calibration. We applied the resulting solutions to all the S Per data and then imaged and self-calibrated the other lines individually. In this way we were able to retain the correct relative positions and intensities. The final data cubes (in LHC and RHC and in Stokes parameters and ) were made using a 7-mas circular restoring beam and had a typical noise mJy beam-1 in quiet channels. We fitted Gaussian components to measure the properties of each patch of maser emission and grouped components adjacent in position and velocity to form features thought to represent physically discrete clumps. The individual maser components were mostly spatially resolved, as were the features, allowing us to measured their angular sizes and line widths.
MERLIN observations made in 1993 (Richards et al. 1999) also showed that OH mainline emission appeared to originate at a similar distance from the star as the H2O masers. In 1999 we made observations in full polarization, to produce data cubes in Stokes , , and from which we deduced the total linear polarized flux and polarization angle . The individual components and features were spatially unresolved.
MERLIN observations of H2O masers made in 1994 (Richards et al. 1999) and 1999 have a similar resolution to the VLBI OH data. The H2O maser shell is consistently well-filled and shows strong acceleration. At each epoch the thick shell has a similar size and contains 100 clumps, about half of which can be cross-identified. Maser theory (Cooke & Elitzur 1985; Yates et al. 1997) suggests that at the inner shell boundary, 55 au from the star, these have a number density of which is the wind average at that distance, for a typical temperature K. The integrated maser emission appears almost spherical using a logarithmic intensity scale but if the brightest components are selected they are seen to lie in an ellipse elongated NE-SW in 1999. In 1994 the elongation was more nearly E-W. Hotspots in an NE-SW ellipse were also detected in 1998 by Vlemmings et al. 2002 using the VLBA, see Section 3.2.
Multi-epoch VLBA monitoring of SiO masers (Ostrowski-Fukuda et al. 2002) shows that at some stellar phases the hot-spots trace an elongation similar to that of the H2O masers. Thompson & Creech-Eakman (2003) imaged S Per at 2.2m and found that the star appeared elongated with the minor axis at a similar position angle of , suggesting that it is limb-darkened in the direction of strongest mass-loss.
3 Emerging axisymmetries
3.1 OH and H2O maser distribution
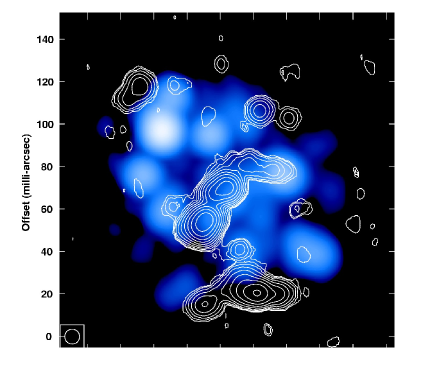
Fig. 1 shows the OH mainline and H2O maser distributions, aligned on the centres of expansion, assumed to be the stellar position. This shows that the OH masers have a very pronounced elongation NNE-SSW, also seen in 1993. The OH emission is brightest in between the H2O clumps. The OH 1612-MHz masers have an angular distribution which is similar in shape to the mainlines but greater in extent, covering nearly 1 arcsec N-S (also seen in 1985 observations). Fig. 2 shows the angular separation of masers from the stellar position as a function of .
These Figs. show that the H2O masers form a thick limb-brightened shell typical of strong acceleration whilst the OH masers are brighter at the extreme velocities near the front and back caps of the shell suggesting that they are expanding more steadily. For all species the extreme velocities are found near the centre of emission and there is no indication of rotation. Both H2O and OH mainline clumps have an average radius of au with a maximum of almost 30 au.
The interleaving of OH mainline and H2O masers appears to conflict with the classic model in which penetration of interstellar UV forms an OH shell outside the H2O shell. It can be explained in the context of the high density of the H2O clumps mentioned in Section 2. The dust-gas collision rate is lower at lower density. If the OH comes from surrounding regions at 1/50th the density, they are likely to be cooler and less effectively accelerated since both heating and expansion are driven by the dust absorption of stellar radiation.

3.2 Polarization
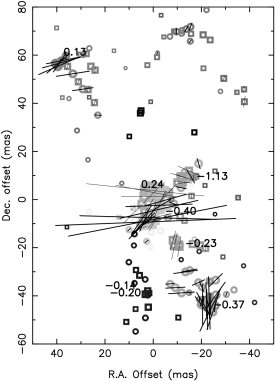
Figs. 3 and 4 show the OH mainline circular and linear polarised emission. A 1 km s-1 difference between RHC and LHC peaks corresponds to a magnetic field of 0.17 and 0.28 T at 1665 and 1667 MHz respectively (Davies 1974). We found 7 possible Zeeman pairs in the EVN data at 1665 MHz and 2 at 1667 MHz, by looking for features of opposite Stokes which coincided in position and were the closest matches in velocity. These had velocity separations (of the Stokes peaks) of magnitudes between 0.5–2.8 km s-1, giving a magnetic field component parellel to the line of sight of magnitude T. Six out of the 9 pairs showed the magnetic field pointing away from us (). Where there were multiple matches we compared the position and velocity pattern made by the components within the features. In only one case an alternative match over 12 km s-1 was possible, giving T. The thermal linewidth of OH at K is 0.9–1.2 km s-1; our magnetic field values for narrower velocity differences may be overestimated (Elitzur 1998). We performed a similar analysis of the MERLIN data and found 8 Zeeman pairs including 6 with . There are also a number of maser feature groups where Stokes is entirely of the same sign.
The mean magnetic field is T and T for the EVN and MERLIN data respectively. There are some similarities e.g. the most red-shifted pair is seen in all data with and the only pair detected in the NNE limb is at 1665 MHz in both data sets with .
Significant linear polarization is only detected from the near (blue-shifted) side of the shell and rarely exceeds 50%, stronger at 1665 MHz. The dominant direction of polarization vectors is E-W but there are some anomalies such as in the S where the vectors change direction by . The vectors may be parallel or perpendicular to the component of in the plane of the sky, , depending on whether or maser components are detected (Elitzur 1998) and also depending on the angle of to the line of sight. The high fraction of circular polarization relative to linear polarization could suggest that components dominate and is perpendicular to , implying that the magnetic field axis lies along the direction of maser elongation. However other interpretations are possible (e.g. Deguchi & Watson 1986) including Faraday rotation or depolarization. In any case it is likely that the jumps in are caused by the detection of components or by a small change in the direction or strength of , not by a full kink.
Some Faraday rotation is present as shown by the change in across individual features, typically 16∘, which could be produced by an internal free electron density of m-3 across an au-deep OH masing clump (a fractional number density of ). If the OH masers are distributed in a partly filled spherical shell, the red-shifted emission travels au further through the inner CSE which could, if inhomogenous, convert linear to circular polarization or produce depolarization averaged over a MERLIN beam.
Vlemmings et al. (2002) used the VLBA to measure Zeeman splitting of the brightest H2O masers. This is only a small fraction of the thermal line width as H2O is non-paramagnetic, making analysis model-dependent. The deduced magnetic field component is in the range T.
3.3 Biconical outflow model of OH emission
The elongation of the 1612-MHz maser shell, which represents material which left the star several centuries ago, suggests that the OH axis is stable. The distribution of emission suggests a biconical outflow such as in the models of Zijlstra et al. (2001) . The H2O masers could form a complementary distribution with an equatorially enhanced density surrouding the polar axis of the bicone. The slight E-W elongation of the H2O masers observed in 1994 appears more compatible with this picture than the more NE-SW elongation seen in 1999. Projection effects may be confusing the issue and patience is needed to ensure that the H2O elongation is not chance effects. Over 6 years, the projected outline of the H2O maser shell of the Mira U Ori has changed apparent orientation, probably due to chance distribution of bright masers; several decades would be needed to see if the hotspot distribution around S Per is systematic.
4 Polarization interpretation: complications and outlook
The magnitude and direction of measured from OH masers shows no clear pattern nor direction and there are discrepancies between the MERLIN and EVN data. This may be due to falsely matched Zeeman pairs and a more rigorous analysis taking into account single-polarization features may give a fuller picture. The combination of velocity and magnetic field gradients can mean that only one sense of polarization is amplified in a particular clump (Cook 1976).
The average magnetic field strength measured from OH masers is T at a distance from the star of au; the largest value from a reliable match is T. At our adopted distance of 2.3 kpc the brightest parts of the H2O maser shell are at au where Vlemmings et al. (2003) estimate T or the OH value, yet for a dipole field where there should be at most a factor of 8 difference between the field strength in the H2O and OH regions.
The discrepancy could be due to a selection effect; only the strongest Zeeman splitting of H2O masers can be detected but a magnetic field of even 10 T would produce a line split of 59 km s-1 for the 1665 MHz OH masers, greater than the total velocity span of the CSE. If the magnetic field axis was parallel to the line of sight the OH masers could lie in the plane of the sky where would be very small; however this seems unlikely in view of the centrally-located extreme velocity OH masers unless the apparent velocities are due to Zeeman splitting.
The ratio of thermal to magnetic pressure is in the H2O maser clumps and in the OH regions, so magnetic pressure is dominant in the former and significant in the latter. It has been suggested (including by the present first author) that if the magnetic field is a stellar-centred dipole the lighter OH-masing gas could be following the dipole axis and/or the dust concentrated in H2O clumps could be trapped by the equatorial field lines. However it is hard to see how a static field could shape the wind. In star-forming regions the dust grains spin round the field lines (the Whittet-Greenstein mechanism) but in CSEs the grains are the source of heating and so such ordered flow would be disrupted by thermalisation. Moreover, if this was responsible for concentrating the denser dustier clumps in an equatorial belt we would not expect to find the strong acceleration which is observed in H2O masers associated with the clumps.
The origin of a dipole field is also problematic; AGB stars have already started to accumulate a degenerate core which will ultimately be exposed as a white dwarf and it has been suggested (Blackman et al. 2001) that interaction between rotation of the core and convection cells form a dynamo producing the magnetic field. This explanation cannot hold for RSG as they do not become degenerate until the final catastrophe. Soaker & Zoabi (2002) suggest an alternative turbulent dynamo mechanism which still requires some some internal rotation to define a symmetry axis. A related possibility is that the pulsation modes and convection cells in the star create a preferred direction for denser or less dense mass loss and a stronger or weaker magnetic field is carried in these directions. Freytag et al. (2002) develop such a model for Ori without requiring rotation. A similar model for mass-loss involving a shock-compressed field frozen into clumps at their formation near the stellar surface was suggested by Hartquist & Dyson (1997). The magnetic field strength . The OH-masing gas is of the density of the H2O clumps at the same distance from the star. If then for OH masers at au, would be of its value for H2O masers at 90 au, closer to the observed strengths.
The supergiant VX Sgr does appear to have an ordered magnetic field measured from OH 1612 MHz masers (Szymczak & Cohen 1997; Szymczak et al. 2001), the axis of which defines a biconical region containing a lower density of H2O masers (Murakawa et al. 2003). The full analysis of OH mainline masers observed by the EVN/Global VLBI and by MERLIN will confirm or modify this model. The magnetic field configuration appears to evolve with time; OH masers around NML Cyg show an old shell with tangential polarization vectors surrounding a more recent bipolar outflow parallel to radial polarization vectors (Etoka & Diamond 2004). Full 3-D modelling of S Per is needed, if possible including further epochs of observation to measure proper motions and examine the persistence of the magnetic field.
References
- [2003] Bains, I. et al. 2003, MNRAS, 342, 8
- [2001] Blackman, E. G., Frank, A., Markiel, J A., Thomas, J. H. & Van Horn, H. M. 2001, Nat, 409, 25
- [1989] Bowers, P. F., Johnston, K. J. & de Vegt, C. 1989, ApJ, 340, 479
- [1986] Champan, J. M. & Cohen, R. J. 1986, MNRAS, 220, 513
- [1975] Cook, A. H. 1975, MNRAS, 171, 605
- [1985] Cooke, B. & Elitzur, M. 1985, ApJ, 295, 175
- [1974] Davies, R. D. 1974, in Galactic Radio Astronomy, ed. F. J. Kerr & S. C. Simonson III, 275
- [1986] Deguchi, S. & Watson, W. D. 1986, ApJ, 300, L15
- [1987] Diamond, P. J. et al. 1987, A&A, 174, 95
- [1998] Elitzur, M. 1998, ApJ, 504, 390
- [2004] Etoka, S., Diamond, P. J. 2004 MNRAS, 384, 34
- [2002] Freytag, B., Steffen, M. & Dorch, B. 2002, AN, 323, 213
- [1997] Hartquist, T. W. & Dyson, J. E. 1997, A&A, 319, 589
- [1999] Masheder, M. R. W. et al. 1999, NewAR, 43, 563
- [2003] Murakawa, K., Yates, J. A., Richards, A. M. S & Cohen, R. J. 2003, MNRAS, 344, 1
- [2002] Ostrowski-Fukuda, T. A., Stencel, R. E., Kemball, A. & Diamond P. J. 2002, AAS, 200.7409
- [1999] Richards, A. M. S., Yates, J. A. & Cohen, R. J. 1999, MNRAS 306, 954
- [1967] Schild, R. 1967, ApJ, 148, 449
- [2002] Soker, N. & Zoabi, E. 2002, MNRAS, 329, 204
- [1997] Szymczak, M. & Cohen, R. J. 1997, MNRAS, 288, 945
-
[1998]
Szymczak, M., Cohen, R. J. & Richards, A. M. S.
1998, MNRAS, 297, 1151
1999, MNRAS, 304, 877
2001, A&A, 371, 1012 - [2003] Thomson, R. R. & Creek-Eakman, M. J. 2003, AAS, 203.4907
- [2002] Vlemmings, W. H. T., Diamond, P. J. & van Langevelde, H. J. 2002, A&A, 394, 589
- [1997] Yates, J. A., Field, D. A. & Gray, M. D. 1997, MNRAS, 285, 383
- [2001] Zijlstra, A. A. et al. 2001, MNRAS, 322, 280