A VLBI Study of the Gravitational Lens JVAS B0218+357
Abstract
We present the results of phase-referenced VLBA+Effelsberg observations at five frequencies of the gravitational lens B0218+357 to establish the precise registration of the A and B lensed image positions.
1 Introduction
The potential to determine the Hubble constant, , using the double image lens B0218+357 was established shortly after its discovery (Patnaik et al. 1993) to be very high. This is because of the accurately measured value for the time delay between the images, (10.5 0.4) d (Biggs et al. 1999) and the wealth of data coming from numerous radio and optical observations of this source at various frequencies and epochs that provide constraints for the lens model. Rightly so, at times it is described as the ‘Golden Lens’.
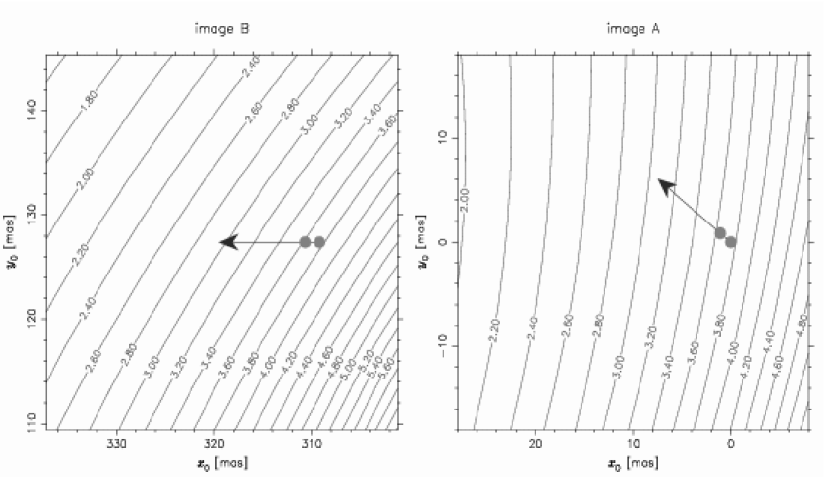
Yet this system presents a few ‘glitches’. One of them is the steady and systematic decline in the radio image flux density ratio with decreasing frequency. One of the possible explanations is a frequency-dependent source structure (the background source is conjectured to be a blazar), combined with the magnification ratio which changes significantly over the extent of the structure. Such changing magnification is perhaps likely, given that the system has the smallest image separation of 330 mas amongst the known galactic lenses. In the model derived by Wucknitz (2002) using LENSCLEAN, a shift of 15 mas in the position of a point-source image can produce a change in relative magnification from 4 to 2.5 (Fig. 1). Furthermore, it is indeed common for the radio spectra of AGN jets to steepen with distance from the nucleus, and for the position of the radio peak at the jet base to change with frequency – the “core shift”. Although such a core shift should, in general, show up as a change with frequency of the separation between the two different core images, this effect is insensitive to core shifts in some directions. An unambiguous registration of the VLBI structures of the radio images at different frequencies can show whether this effect is present, and can only be made using the technique of phase referencing.
2 Observations
The phase-referencing technique is used to correct interferometer phase errors (geometrical, atmospheric or ionospheric and instrumental). These errors are first determined by observation of a strong, near-by phase (position) reference calibrator source, which is preferrably point-like with a frequency independent position and then interpolated to times at which the (usually weaker) target source is observed, in order to determine its structure and position relative to the reference. In this way the derived relative geometrical offset between the lens and the position reference is a constant only if the respective brightest points maintain their positions with varying frequencies.
In the case of B0218+357, the target source (the lens) is sufficiently strong ( 1 Jy) to invert its role as the phase-reference, thereby leading to “Inverse Phase Referencing”.
The observations were taken on the 13th and 14th of Jan. 2002 using the VLBA (Very Long Baseline Array) and Effelsberg (Eb) at five frequencies, namely 15.35 GHz, 8.40 GHz, 4.96 GHz, 2.25 GHz and 1.65 GHz. Apart from observing the lens, three position-reference sources were observed along with a fringe finder. The data were correlated at the VLBA correlator and further processed in AIPS.
3 Maps of B0218+357
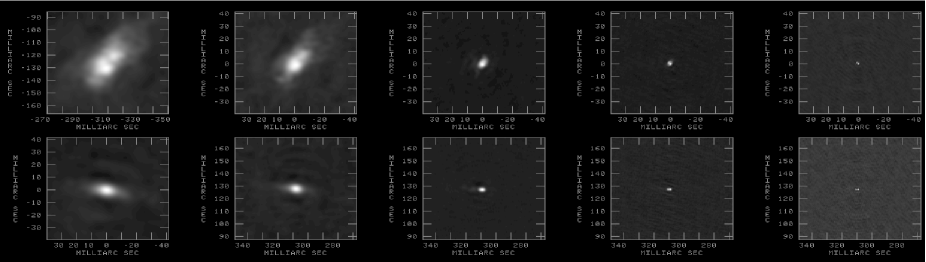
Hybrid maps (using phase self-calibration techniques) of the lens were made by cleaning the two sub-fields containing the two images A and B (separated by 334 mas) simultaneously. The images clearly manifest all the earlier observed lensing-characteristics, such as image A being tangentially stretched at a PA (Fig. 2). At 8.4 GHz and higher frequencies, the images are resolved further into two sub-components, separated by about 1.4 mas, representing the core-jet morphology of the background source.
4 Phase Referencing
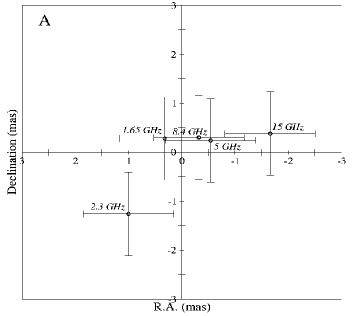
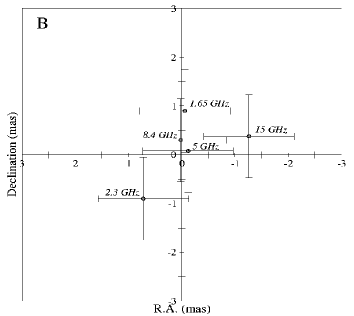
For the phase-reference analysis only one source, 0215+364, was chosen as the most appropriate position reference based on its flat spectrum in comparison with the others and also being in a suitable enough brightness range for the purpose of determination of the brightest component unambiguously. The hybrid maps of the images A and B were used to investigate the change in their positions with respect to 0215+364 as a function of frequency. Fig. 3 indicates a shift of only mas in the peaks of the image radio emission between 15.35 GHz and 1.65 GHz, comparable to the separation between the two sub-components seen in both images at 15.35 GHz. Over this distance the change in relative magnification is expected to be small.
5 Discussion
Since there is no measured shift with frequency of either image peak positions large enough to account for the anomalous flux density ratios, this effect may be due to the frequency-dependant source-size as seen in the two images. The different image sizes at varying frequencies could also result from scattering in the lens galaxy (see Biggs et al. 2002 for further discussion). At 1.65 GHz there is a relatively huge amount of low brightness emission that extends out to 30 mas, in comparison to 15.35 GHz where the emission is dominated by the compact sub-components with a separation of 1.4 mas. Since at lower frequencies the (larger) images extend over regions where lens models predict significant changes in the relative magnification, the image flux densities(and their ratio) do not result from the integral of their radio brightness over the entire structure with a constant magnification. We are therefore attempting to use the optimal lens mass model derived from LENSCLEAN (Wucknitz 2002) to calculate the magnifications for discrete regions in the image plane. We can then compare the ratio of the predicted averaged magnification over image A to that of B for each of the frequencies, to the observed ratio of the image flux densities.
Alternatively, sub-structure in the lens galaxy might cause larger gradients in the image magnifications than are found for a smooth lens model (Fig.1)
References
- (1) Biggs, A.D., Browne, I.W.A. et al.: 1999, MNRAS 304, 349
- (2) Biggs, A.D., Wucknitz, O. et al.: 2002, MNRAS 338, 599
- (3) Patnaik, A.R., Browne, I.W.A. et al.: 1993, MNRAS 261, 435
- (4) Wucknitz, O.: 2002, PhD Thesis, University of Hamburg