EVN observations of the lens system B0128+437
Abstract
Previous VLBI observations of the lens system CLASS B0128+437 showed that the lensed source had a triple sub-component structure. However, one of the images looked very different to the others and it has been suggested that this is due to scatter-broadening in the ISM of the lensing galaxy. We present a new 21-cm EVN map of this system, the low frequency compared to previous epochs chosen as the scattering should be more pronounced at this frequency. Analysis of the new map is at an early stage, but the area of scattering in the affected image is extremely obvious. Other points of interest that we seek to explain are the very large sizes of the images (in conflict with the observed spectral turnover at 1 GHz) and the different position angle of one of the images at different frequencies.
1 Introduction
Whilst gravitational lenses attract most attention for their usefulness in determining cosmological parameters (, , ) and the mass and mass profiles of lensing galaxies (see Kochanek, Schneider & Wambsganss [2004] for a recent review), usually receiving less attention is the way in which they can be used as probes of the interstellar medium (ISM) of high-redshift galaxies. The galaxies in question are of course the lensing galaxies, the deflected light from the background lensed quasar passing through and illuminating their ISMs. The ISM can leave its imprint on the lensed light in a number of ways e.g., differential extinction, Faraday rotation (and depolarisation), absorption lines and scatter-broadening. From, usually multi-frequency, observations of these phenomena it is possible to constrain properties of the ISM, such as the magnetic field strength and electron density, as well as the scales over which these vary. In this way, gravitational lenses are unique probes of the astrophysics of the high-redshift universe.
Scatter-broadening has been claimed in a number of lens systems e.g., PKS 1830-211 (Jones et al., [1996], Guirado et al., [1999]), JVAS B0218+357 (Biggs et al., [2003]), CLASS B1933+503 (Marlow et al., [1999]) and PMN J0134-0931 (Winn, Rusin & Kochanek [2004]). The claims are based on different criteria in each case. The “classic” manner in which to diagnose scatter-broadening is to measure the sizes of components, these being expected to vary according to the wavelength squared; this has been done in the case of PKS 1830-211. For B0218+357, maps of the two images made at 8.4 GHz with global VLBI were back-projected into the source plane using a lens model where one image was found to be much smoother than the other. Whilst the four images of the radio core in B1933+503 are clearly detected with MERLIN and the VLA, two are absent in a VLBA image and must therefore have had their surface brightness reduced separate to the lensing process.
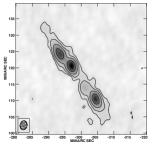
Another lens system where scatter-broadening has been suggested is CLASS B0128+437 (Phillips et al., [2000]). This is a four-image lens system, the lensed source being a quasar and the maximum separation of the images only 540 mas. Originally identified as a lens from MERLIN observations, subsequent follow-up with the VLBA at 5 GHz (Biggs et al. [2004]) resolved each image into a jet with three prominent sub-components (Fig. 1). The latter, however, were only present in three of the four images! Comparison between maps made with uniform and natural weighting indicated that the image with the missing sub-components was extended over larger angular scales than the other images, in conflict with what would be expected if lensing alone was determining the relative sizes of each image. The most natural explanation for this is that image B is being scatter-broadened in the ISM of the lensing galaxy.
In this paper we present a new map of B0128+437 made with the EVN at a wavelength of 21 cm. The motivation for this experiment was to investigate the source structure at an additional frequency, 8.4, 5 and 2.3 GHz observations having already been carried out with the VLBA (including Effelsberg in S/X band). At the new lowest frequency the scattering would be greatest and the images both brighter (the source GPS spectrum peaks at 1 GHz) and larger. The increase in source size with decreasing frequency was clear from the previous observations and would give additional constraints on our models of the lensing mass distribution.
2 The Data
CLASS B0128+437 was observed with nine antennas of the EVN on 2004 February 18. The participating antennas were Effelsberg, Jodrell Bank (Lovell), Medicina, Noto, Westerbork (tied array), Cambridge, Torun, Onsala and Urumqi. The Cambridge antenna was included as it was planned to combine these data with previous 21-cm MERLIN data. Enhanced scattering at the low frequency might have rendered much of the flux in the scattered image undetectable with EVN baselines alone. Ultimately, practically all of the single-dish flux density was recovered in the EVN map and so no combination with the MERLIN data has taken place. The lens data were phase-referenced to a nearby compact calibrator () as even at its brightest the total lens system flux density is only about 130 mJy. Correlation took place at the Joint Institute for VLBI in Europe (JIVE) using the EVN MkIV Data Processor, producing 16 spectral channels in each of the four 8 MHz dual-polarisation bands. The correlator averaging time was 2 s.
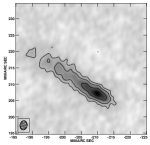
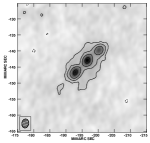
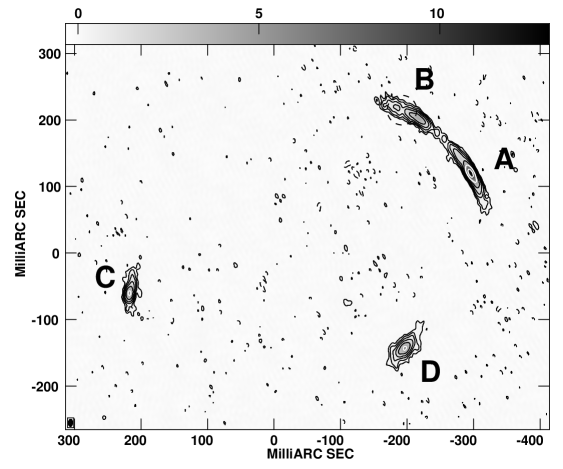
All calibration and mapping was carried out in aips, the combination of the low observing frequency and the relatively small image separation enabling the whole system to be mapped in a single “window”. The final self-calibrated map is shown in Fig. 2.
3 Discussion
3.1 Scatter-broadening
Prominent in the new map is a “hole” in image B, a dashed circle marking its location in Fig. 2. None of the other images contains a similar feature, this being seen most easily in the brightest image, A. Being the brightest, image A is also the largest and so if the hole was an intrinsic feature of the lensed source it would have to be seen here as well. The fact that the restoring beam is elliptical and aligned approximately north-south i.e. with the jet, might cause the hole to be somewhat obscured, but image A is peaked close to its centre whilst image B is clearly brightest towards its western end. As the hole is only seen in image B then its origin must be independent of the lensing process and is, as already mentioned, due to scatter-broadening in the ISM of the lens galaxy.
The position of the hole in image B is close to the location of the 5-GHz structure seen in Fig. 1 (the axis scales in Figs 1 and 2 are the same). Therefore, either there is more scattering material in front of the 5-GHz sub-components or these, being more compact than the extended emission in the jet, are more obviously broadened. In fact, it is probably a combination of these effects. There is certainly a scattering gradient in image B as the eastern end of the jet is much weaker than the western end and Fig. 1 shows that all the sub-components of an image should have comparable flux densities. Also, model fitting to image A shows that the most compact of the sub-components is the central one and so this should be most affected by scattering. It seems likely though that all of image B is subject to some level of scattering as its surface brightness is consistently lower than that of image A111Each image should have the same surface brightness. (two more contours are present in image A than in image B).
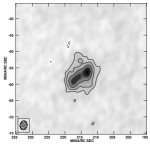
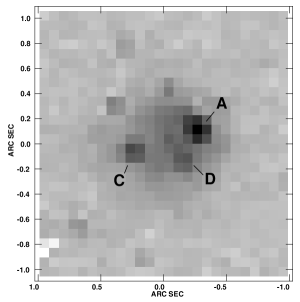
Recent (February 2004) imaging with the NICMOS camera aboard the Hubble Space Telescope (HST) support the hypothesis that a rich ISM is responsible for distorting image B. Previous HST imaging in and filters revealed that the system is extremely faint in the optical (Biggs et al. [2004]). Biggs et al. also showed that in -band, observed with the United Kingdom Infrared Telescope (UKIRT), the system is much brighter () although the resolution was too poor to separate the lensed images. The new -band HST image (Fig. 3) does have sufficient resolution in the infrared to show the individual images (and the lensing galaxy) although image B is conspicuous by its absence. Dust obscuration is the most natural explanation and gas associated with this dust would be responsible for the scatter-broadening. The presence of large quantities of gas and dust, together with the small separation of the lensed images, suggests that the lens galaxy is a spiral.
An interesting hypothesis is that all the images are being scatter-broadened and not just B. The reason for this is the conflict between the observed structure of the images and the radio spectrum of the lens system. Measurements of the total flux density made at frequencies ranging from 325 MHz to 8.4 GHz show that the system has a Gigahertz peaked spectrum (GPS), the spectrum exhibiting a pronounced turnover at about 1 GHz. Given this, the source structure would be expected to be compact, in contrast to the very extended nature of all the images at 1.4 GHz. The alternative is that the source is not actually a GPS, but that an intrinsic steep spectrum has been altered, perhaps by free-free absorption, again in the ISM of the lensing galaxy. A similar effect has been suggested in the lens JVAS B2114+022 (Augusto et al. [2001]). Helpful as a diagnostic in this regard would be individual spectra of each image over a wide range of frequency, a difficult task given the small separation of the images. The NICMOS data, however, only provide clear evidence for a rich ISM in front of image B and we consider the 4-image scattering hypothesis unlikely.
3.2 Lens mass modelling
The growth of the image sizes with decreasing frequency, if not a result of scatter-broadening, is excellent news for lens mass modelling as the lens potential can be probed along a greater range of position angles around the centre of the lens galaxy. Algorithms have been developed, such as LensClean (Kochanek & Narayan [1992]), which take as input a radio map of a lens system and CLEAN this under the constraint of a lens model. This has most recently been used on the lens system JVAS B0218+357 (Wucknitz [2004]). The result of LensClean is a best-fit mass model, an image of the unlensed source and an excellent map of the lens system itself! Unfortunately, attempts to fit a model to the image positions at 5 GHz in B0128+437 have been unsuccessful thus making the choice of a starting model for LensClean difficult. The scatter-broadening of image B also makes it more difficult to LensClean the map although it is possible to add a scattering coefficient into the computations.
Algorithms such as LensClean are most useful when a lens system is dominated by extended structure. In those cases where the images are resolved into discrete components, their positions and sizes can be estimated with Gaussian modelfitting packages (exemplified by that in difmap) and these used as input into standard lens modelling packages. As well as the extended structure revealed in the new map two new discrete components are seen in images A and B. These can be seen close to the point where these images meet and constrain the position of the “critical curve”, a locus of points which determines where images are created or destroyed.
3.3 Substructure in the lens
As mentioned in the previous section, the mass model for B0128+437 is not currently well understood. Modelling presented in Biggs et al. ([2004]) suggests that the major problem is in fitting to the position angle of the jet in image C (Fig. 1) which lies along a position angle of approximately . A smooth model such as a Singular Isothermal Sphere (SIE) with external shear cannot reproduce the sub-component positions for this image, which must mean that additional unmodelled substructure exists in the lensing galaxy, perhaps that predicted by Cold Dark Matter (CDM) models of large scale structure formation (e.g. De Lucia [2004]).
Given that image C is clearly extended in Fig. 2 along the north-south direction, the difference in the position angles of the inner and outer jet might arise from mass substructure of order M rotating the inner jet, leaving the larger-scale jet seen in lower frequency maps unperturbed. Models of this system though do not seem to require a deviation from of anything as extreme as that seen in the EVN map and a more plausible explanation is that the extension at 1.4 GHz is simply the tangential stretching of this image that is expected given that this is a four-image system. The beginnings of this stretching can be seen in Fig. 2 as bulges to the jet towards the north and south.
4 Conclusions
Of the 22 lens systems that were discovered during the course of the JVAS/CLASS surveys, B0128+437 has proved to be one of the most interesting, both for the distortion of image B and the inability of smooth mass models to reproduce the observed image positions. Our new EVN map shows the area of scatter-broadening in image B extremely well and new NICMOS data confirm that a rich ISM obscures this image’s line of sight. An area of star formation, possibly contained within a spiral arm, might be the origin of the dust and turbulent ionised gas.
Future work on this system could include the following. High-frequency VLBI (15 GHz) might be able to recover the position of the eastern sub-component in image B, provided that the scatter-broadening had sufficiently weakened by this point. The position would serve as a useful model constraint. The other two sub-components have much steeper spectra and would be almost certainly undetectable at the higher frequency. On the other hand, low frequency VLBI (1 GHz) could determine why the spectrum of the source turns over at 1 GHz when the images are dominated by extended emission at this frequency. Which parts of the images fade? Might an Einstein ring appear? Finally, it might be possible to detect redshifted HI absorption. The redshift of the lens galaxy is not known although the detection of a single line with Keck spectroscopy considerably narrows the search. Most possibilities have drawn a blank using the Westerbork Synthesis Radio Telescope (WSRT), but one redshift, , has yet to be explored. If HI was found at this redshift then its spatial distribution could be mapped with VLBI and compared with the spatial variance of the scattering.
Acknowledgements.
The European VLBI Network is a joint facility of European, Chinese, South African and other radio astronomy institutes funded by their national research councils. This work also included observations made with the NASA/ESA Hubble Space Telescope, obtained at the Space Telescope Science Institute, which is operated by AURA, Inc., under NASA contract NAS 5-26555.References
- [2001] Augusto P., et al., 2001, MNRAS, 326, 1007
- [2003] Biggs A. D., et al., 2003, MNRAS, 338, 599
- [2004] Biggs A. D., et al., 2004, MNRAS, 350, 949
- [2004] De Lucia G., et al., 2004, MNRAS, 348, 333
- [1999] Guirado J. C., et al., 1999, A&A, 346, 392
- [1996] Jones D. L., et al., 1996, ApJL, 470, L23
- [1992] Kochanek C. S., Narayan R., 1992, ApJ, 401, 461
- [2004] Kochanek C. S., Schneider P., Wambsganss J., 2004, Part 2 of Gravitational Lensing: Strong, Weak & Micro, Proceedings of the 33rd Saas-Fee Advanced Course, G. Meylan, P. Jetzer & P. North, eds. (Springer-Verlag: Berlin)
- [1999] Marlow D. R., Browne I. W. A., Jackson N., Wilkinson P. N., 1999, MNRAS, 305, 15
- [2000] Phillips P. M., et al., 2000, MNRAS, 319, L7
- [2004] Winn J. N., Rusin D., Kochanek C. S., 2004, Nat, 427, 613
- [2004] Wucknitz O., 2004, MNRAS, 349, 1