Search for Point Sources of Ultra-High Energy Cosmic Rays above eV Using a Maximum Likelihood Ratio Test
Abstract
We present the results of a search for cosmic ray point sources at energies above eV in the combined data sets recorded by the AGASA and HiRes stereo experiments. The analysis is based on a maximum likelihood ratio test using the probability density function for each event rather than requiring an a priori choice of a fixed angular bin size. No statistically significant clustering of events consistent with a point source is found.
Subject headings:
cosmic rays — acceleration of particles — large-scale structure of universe1. Introduction
The world data set of ultra-high energy cosmic rays is currently dominated by data recorded with the Akeno Giant Air Shower Array (AGASA) between 1989 and 2003. AGASA has published arrival directions of 57 cosmic-ray events above eV obtained up to May 2000 (Hayashida et al., 2000).
The High Resolution Fly’s Eye (HiRes) experiment in Utah has operated in stereo mode since 1999. The published AGASA data set and the HiRes stereo data set overlap only a few months in time, but both detectors observe approximately the same part of the northern sky. With 27 events above eV recorded through January 2004, the HiRes data set now contributes significantly to the world ultra-high energy data set: thus it becomes increasingly interesting to search for possible point sources in this combined data set.
In combining the two data sets, we need to account for the different errors on the individual cosmic-ray arrival directions as well as for the different background expectations in the two experiments. In addition, the analysis method should be “unbinned,” at least in the sense that any error from binning is much smaller than other errors in the data. This means that we do not define a fixed maximum angular separation for events to form a multiplet. Rather, we search over the whole HiRes/AGASA sky for possible point source positions.
For analyzing a data set combining events with very different errors, the maximum likelihood method is particularly well suited. We perform a likelihood ratio test of the hypothesis that several events in the skymap come from a common source. In other words, we test whether any given position on the sky harbors a source which contributes source events to the data set. The likelihood of this hypothesis is compared to the null hypothesis and this likelihood ratio is maximized using as a free parameter. By calculating the likelihood ratio for a dense grid of points on the sky, we essentially search the entire sky for the most likely position of a source of events. The statistical significance can be estimated by applying the same method to a large set of random isotropic data sets and evaluating what fraction of them have a likelihood ratio which is equal to or larger than the ratio observed in the real data described above.
It should be noted that it is not obvious that a study of cosmic ray arrival directions will help identify their sources, because charged particles suffer deflections in Galactic and extragalactic magnetic fields. The strengths of these fields are poorly known. Several authors have recently published estimates on the size of the expected deflections, and the results differ considerably (Sigl, Miniati & Ensslin, 2004; Dolag et al., 2003). The point source search reported in this paper could be fruitful only if deflections at energies above eV are sufficiently weak, making cosmic ray astronomy possible.
The AGASA data set has been intensively studied and described in the literature (Hayashida et al., 1996; Takeda et al., 1999; Hayashida et al., 2000; Takeda et al., 2003). The HiRes stereo data set is relatively new, so we will describe it in more detail in Section 2. Section 3 gives a description of the likelihood method applied here. Results from the analysis of the combined data set are described in Section 4. In Section 5, we test the likelihood method with simulated data sets, and a discussion follows in Section 6.
2. The HiRes Detector
HiRes is a stereo air fluorescence experiment with two sites (HiRes 1 and 2) at the US Army Dugway Proving Ground in the Utah desert ( west longitude, north latitude, with a vertical atmospheric depth of ). The two sites are separated by a distance of 12.6 km.
The ultra-high energy cosmic ray flux is small and is a steeply falling power law in energy. Thus experiments at ultra-high energies need a large detector volume. Consequently, the primary cosmic ray particles can not be observed directly, since they interact in the upper atmosphere and induce extensive air showers with of the order of particles for a eV primary. The properties of the original cosmic ray particle, such as arrival direction and energy, have to be inferred from the observed properties of the extensive air shower. In HiRes, this is achieved by observing the fluorescence light produced when particles of the extensive air shower interact with nitrogen molecules in the atmosphere. This method has the advantage that the shower development in the atmosphere is imaged and important quantities like the shower size and the height of the shower maximum can be determined directly. If the shower is viewed simultaneously by two detectors in stereo mode, the arrival direction can be reconstructed with an accuracy of less than . The main shortcoming of the technique is the low duty cycle of only about , as air fluorescence detectors can only be operated on dark, moonless nights with good atmospheric conditions.
To observe fluorescence light from air showers, the detector at each site is made up of several telescope units monitoring different parts of the night sky. With 22 (42) telescopes at the first (second) site, the full detector covers about () in azimuth and () in elevation above horizon. Each telescope consists of a mirror with an area of about area for light collection and a cluster of 256 photomultiplier tubes in the focal plane.
The shower geometry is determined by a global minimization using both the timing and pointing information from all tubes. From measurements of laser tracks and stars in the field of view of the cameras we estimate that the systematic error in the arrival direction determination is not larger than , mainly caused by uncertainties in the survey of mirror pointing directions. Various aspects of the HiRes detector and the reconstruction procedures are described in Boyer et al. (2002); Sadowski et al. (2002); Matthews et al. (2003).
For the present analysis, we use stereo data taken between December 1999 and January 2004. This sample is subject to the same quality cuts used in Abbasi et al. (2004b). A minimum track length of in each detector, an estimated angular uncertainty in both azimuth and zenith angle of less than , and a zenith angle less than are required. In addition, the estimated energy uncertainty is required to be less than and for both the energy and the geometry fit. A total of 27 events above eV pass the selection criteria.
An atmospheric data base built from the reconstruction of laser shots is used to correct for the impact of the atmospheric conditions on the reconstruction of events. The data base contains hourly values of parameters describing the aerosol content of the atmosphere. Simulations show that after correcting for the aerosol content, the impact on the event geometry and energy is small for a wide range of different atmospheric conditions.
The angular resolution of HiRes is determined using simulated showers generated with CORSIKA 6 (Heck et al., 1998) and QGSJET for the first interaction. After the quality cuts described above, 68 % of all showers generated at eV are reconstructed within of the true shower direction. The angular resolution depends weakly on energy. The 68 % error radius grows to and for showers generated at eV and eV, respectively, because showers at higher energy are farther away, on average.
3. Analysis
The maximum likelihood method used here is outlined in Kinnison et al. (1982); a useful and clarifying application to the problem of finding a deficit from the position of the moon in a cosmic ray skymap may be found in Wascko (2000). For a general description of likelihood methods, see for example Eidelman et al. (2004); Meyer (1975) and references therein.
The likelihood method can be applied both in searches for emission from a priori selected source locations, and in searches for the most likely location of such a point source on the whole sky.
Consider first a fixed source location in right ascension and declination: . Given a sample of cosmic ray events, we suppose that events come from the source location , and that the remaining events are random background events. If the th event is a source event, then its true arrival direction is . The probability density for finding it at some location is given by the function , derived from the angular errors of the event and the angular displacement between and . On the other hand, if the th event is a background event, then the probability density for finding it at a location is given by the function , derived from the relative exposure of the detector to an isotropic background of cosmic rays. The subscript is necessary because depends on whether event is a HiRes or AGASA event. Each of these functions is normalized to unity over positions in the sky.
We do not hypothesize which individual events are source or background events. We only suppose that there are events in the sample that come from some source position . Therefore, the partial probability distribution of arrival directions for the th event is given by:
| (1) |
It follows that the probability of finding the th event at the location (where it is actually observed) is .
The likelihood for the entire set of events is then given by:
| (2) |
The best estimate for the number of source events, under the assumption of a point source located at , is determined by finding the value of which maximizes .
Because the value of the likelihood function depends on the number of events, a more useful quantity than is the likelihood ratio :
| (3) | |||||
where is the likelihood function of the null hypothesis (). In practice, we maximize , which is equivalent to maximizing .
The method described so far is sufficient for testing a specific source position . To search the entire sky for the source position with the strongest signal, we calculate the likelihood ratio for a dense grid of points on the sky covering the full range of equatorial coordinates accessible to AGASA and HiRes. The source position is essentially treated as a free parameter, along with the number of source events . Searching for the parameters , , and which maximize the likelihood ratio will therefore give us the best estimate for the position of the source and the number of events it contributes.
The search proceeds as follows. The visible region of the sky is divided into a fine grid of points with separations and in and , respectively. Each point is treated in turn as a source location . At each point, the specific quantities and are required for every event. The source probability density function depends on the angular resolution associated with the th event, which in principle may depend on several quantities including energy, zenith angle, etc. The background probability density function depends on the detector exposure to different parts of the sky: it is generally the same function for all events observed by a given detector, but may in principle be a function of e.g. energy as well. For each event, needs to be reevaluated at every grid point, while needs only to be evaluated one time.
Once the values of and are specified, the log likelihood ratio is maximized with respect to , where . This process is repeated for each position on the grid. For most locations, is zero, but local maxima will occur in the vicinity of one or more events. Note that while the method is in some sense binned due to the discrete array of grid points, the spacing is chosen small enough so that errors introduced by binning are insignificant.
4. Results
The procedure described above is applied to the combined data set of 57 AGASA events and 27 HiRes stereo events above eV. The analysis is restricted to the AGASA field of view with , and all but one HiRes event fall into this declination range.
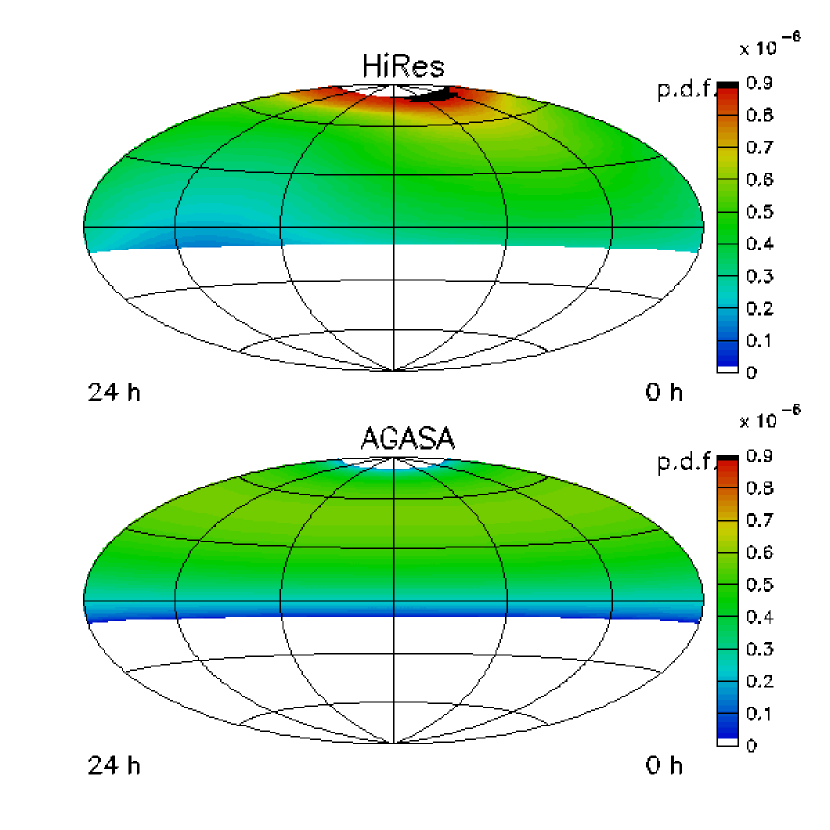
The background expectations for HiRes and AGASA are different. The HiRes exposure has some dependence on right ascension. Fig. 1 shows the normalized HiRes and AGASA background map in equatorial coordinates.
For the signal probability density function (Q) of the HiRes events, we use a two-dimensional Gaussian function whose width is chosen such that of the probability density function falls within an opening angle . Note that for a two-dimensional Gaussian distribution the opening angle encloses of the distribution. Since the dependence on energy is weak, we use the same value, , for every HiRes stereo event.
For AGASA, we approximate the probability density by the sum of two Gaussian functions chosen such that the and opening angle given in Takeda et al. (1999) is correctly reproduced,
| (4) | |||||
The width of the Gaussians as a function of energy has the same energy dependence used in Abbasi et al. (2004c), and is given by
| (5) | |||||
| (6) |
More detailed information on the error shape of individual AGASA events could easily be implemented if it becomes available.
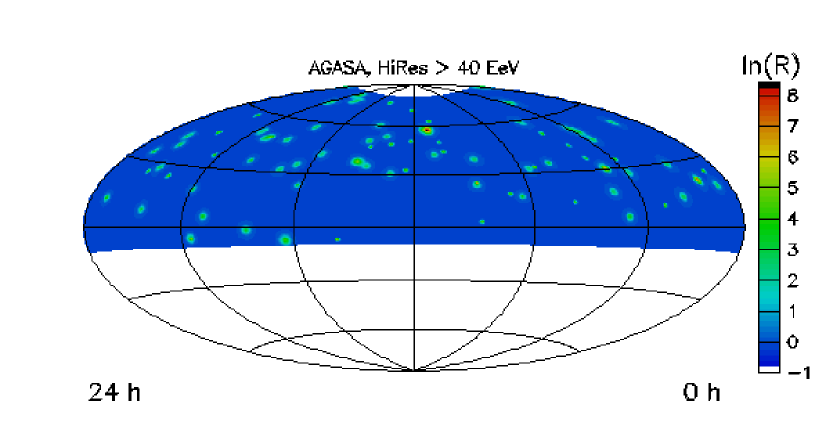
Fig. 2 shows the result of the analysis. At each and , the likelihood ratio is shown for the number of source events which maximizes . One can clearly recognize where events are located, and one can also recognize locations with several nearby events. AGASA and HiRes events can easily be distinguished, as the latter have better resolution and therefore smaller regions with large likelihood. The point with the largest is at right ascension and declination . The corresponding event cluster comprises 3 nearby AGASA events with coordinates and energies of (1) , EeV, (2) , EeV, and (3) , EeV. This cluster has been described in Takeda et al. (1999) and is listed as cluster C2 in Hayashida et al. (2000). The maximum likelihood ratio at this position is for .
The behavior of as a function of the fit parameters (number of source events and position of the source) in the vicinity of the maximum gives error estimates for the fit parameters. To a good approximation, the error is given by the interval over which drops by 0.5 from its maximum value.

Fig. 3 shows as a function of the number of source events at the position of the maximum. The best estimate of the number of source events is . Similarly we find and as the best estimate for the position of the maximum.
The statistical significance of the appearance of a “source” with a maximum likelihood ratio in the combined AGASA/HiRes data set can be evaluated using simulated random data sets. The full likelihood analysis is performed for random data sets with the same number of AGASA/HiRes events and the same underlying exposure as the original data set, but isotropic arrival directions. The chance probability for the “source” to appear is then given by the fraction of random data sets which have at least one location causing the maximum to be equal or larger than , the value of the maximum in the real data.

Fig. 4 shows the distribution of the maximum for each these random data sets. Out of simulated data sets, 2793 have a maximum exceeding that of the real data set. The chance probability of the source hypothesis is therefore of the order of . Consequently, there is no statistically significant evidence for clustering consistent with a point source in the combined data set.
Note that this is not simply the chance probability for a triplet, but rather the chance probability for a set of 27 HiRes events and 57 AGASA events to contain a “hot spot” with as high a probability to be a “source” as the triplet. Many of the simulated likelihood ratios larger than 8.54 in Fig. 4 are indeed caused by doublets.
5. Test of the Method with Simulated Data Sets
The maximum likelihood method is tested by applying it to simulated data sets with sources. These simulated data sets have events from a common source added to an otherwise isotropic arrival direction distribution. To create such a source, we pick a point in the sky for the source location and generate events with arrival directions deviating from the source location according to the probability density function of the individual event as described in Section 2. The source location is chosen at random, but the distribution of locations is forced to reflect the overall exposure of the detector (Fig. 1), so that regions with higher exposure are more likely to contain a source. The source events replace events in the data set, so the total number of events is always 83. There might be additional events close to the source location due to chance.
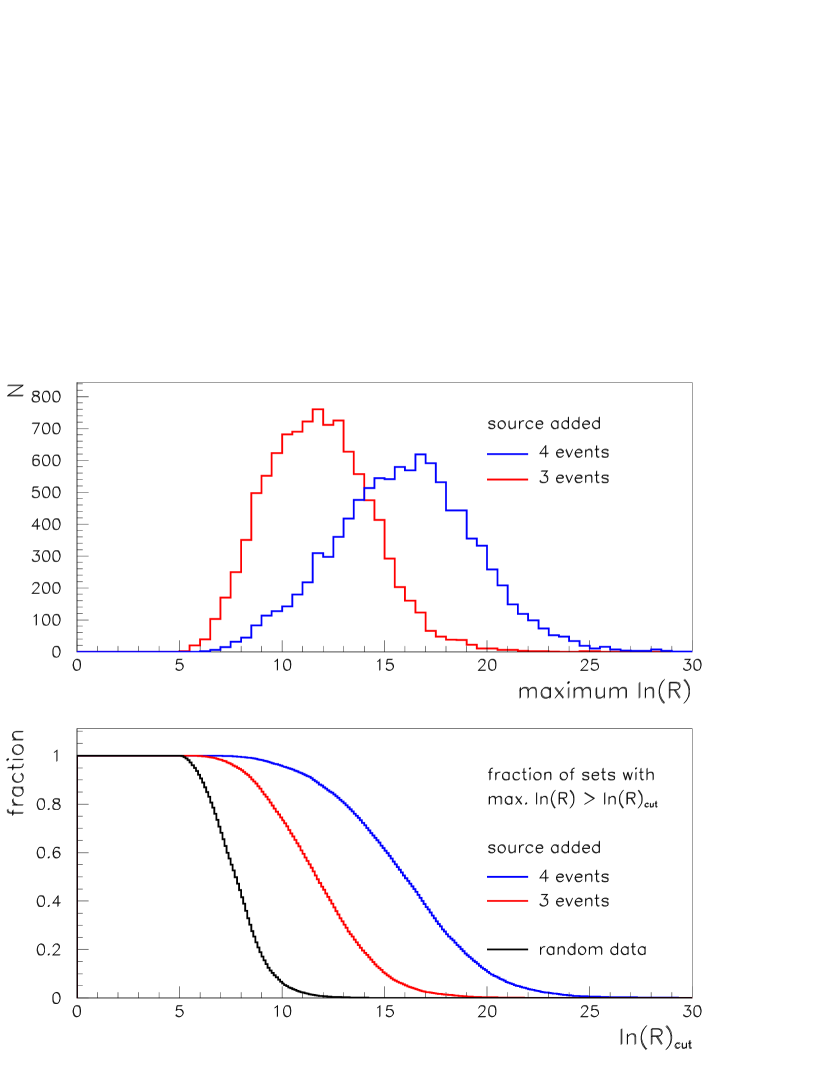
The full likelihood analysis is applied to these random data sets. Fig. 5 (top) shows the maximum for random data sets where a source with (blue line) or (red line) has been added. Fig. 5 (bottom) shows the fraction of simulated data sets with maximum as a function of for random isotropic data sets with no source added (, black line), a 4-event source added (blue line), and a 3-event source added (red line). While there is substantial overlap between the distributions, the plots also show that point sources which add three or more events to an isotropic map are recognized with high efficiency. The medians of the three maximum -distributions () are 7.7, 11.6 and 16.0, respectively.

The HiRes and AGASA events in the sample have rather different angular errors, and we expect this to be reflected in the likelihood ratio of the simulated data sets. The maximum -distribution for clusters that are dominated by HiRes events should have a larger median than the data sets dominated by AGASA events. Fig. 6 shows the median of the maximum -distribution as a function of the number of HiRes events that contribute to the cluster. Both for data sets with and , the median increases if more HiRes events are part of the cluster.

Artificial sources can also be used to test the accuracy with which the position of the point source is reconstructed. Fig. 7 shows the difference between the fitted and the true right ascension and declination angle for and . The distributions are fit to a Gaussian function, and the width, averaged over all source locations and combinations of AGASA and HiRes source events, is of order to . The resolution improves with the number of events contributing to the signal, as expected.
6. Discussion
The chance probability of the triplet using AGASA data alone has been estimated in Takeda et al. (2003) as being of order . This estimate is based on a fixed bin size of . To test what chance probability an unbinned analysis gives, we repeat the likelihood analysis for the data set comprising only the 57 AGASA events above eV. The largest likelihood ratio () appears again near the events forming the triplet, with and for .
As before, we evaluate the chance probability for the appearance of a source with maximum or higher in this data set by analyzing a large number of simulated isotropic data set, now containing 57 AGASA events. 452 out of random data sets have a maximum in excess of 9.66, so the chance probability is . The increase over the chance probability given in Takeda et al. (2003) reflects the fact that the unbinned maximum likelihood analysis evaluates the quality of the cluster on a continuum. This improves the sensitivity to a true point source, and at the same time it removes the artificial fluctuations that arise in a binned analysis when an event falls just inside or outside the bin.
The maximum likelihood method allows a straightforward evaluation of the chance probability that a given cluster of events come from a common source rather than being caused by random background. It can also be used to estimate the chance probability that one or more pre-defined positions on the sky correlate with cosmic ray arrival directions. If several sources contribute, but none of them are strong enough to produce a notable value of , then the likelihood method described here has to be complemented by other methods, such as the angular two-point correlation function. Searches for excess clustering have been performed using both the AGASA and HiRes data sets separately, and for the combined set. No significant clustering is reported in the HiRes stereo (Abbasi et al., 2004b) and monocular data sets (Abbasi et al., 2004c), and earlier reports that the AGASA data set shows significant clustering (Takeda et al., 1999) have recently been questioned. An unbiased analysis (Finley & Westerhoff, 2004) which sets aside the fraction of the AGASA data that was used to formulate the clustering hypothesis, finds that the clustering is consistent at the 8 % level with the null hypothesis of isotropically distributed arrival directions. In addition, a two-point correlation analysis of the combined AGASA and HiRes data sets finds no significant evidence for clustering (Finley et al., 2004).
The energy threshold of eV chosen in this analysis is dictated by the fact that only AGASA data above this threshold is published. It has been suggested (e.g. De Marco, Blasi, & Olinto (2003)) that the discrepancy in the measurement of the cosmic ray flux by AGASA (Takeda et al., 1998; Hayashida et al., 2000) and the monocular HiRes detector (Abbasi et al., 2004a) can be reconciled to some degree by an ad hoc change of about in the relative energy scales of the experiments. In this scenario, numerically equal energy thresholds in HiRes and AGASA are not equivalent, and in order to compare the two data sets, one should either raise the nominal AGASA threshold or lower the HiRes energy threshold, or apply a combination of both shifts.
We do not speculate on the nature of the flux discrepancy here. At this point, there is no indication that it is caused by such a systematic shift in the energy scale of one or both of the experiments. We also note that lowering the energy threshold could potentially make magnetic bending a more serious limitation. However, since the possibility of an energy shift has been suggested by others, it is useful to evaluate whether the conclusions of the maximum likelihood analysis change under this assumption. Therefore, the method is applied again to the data set combining the 57 AGASA events above eV and the 40 HiRes events above eV, an energy threshold roughly lower.
Lowering the HiRes energy cut admits an event that is near the aforementioned AGASA triplet. This HiRes event has an energy of 37.6 EeV and is located at right ascension and declination . The location with the largest is close to this event, at and . The maximum likelihood ratio is for . 47 out of random isotropic data sets have a larger value of maximum .
It is not possible to convert this number into a valid chance probability for the combination of the AGASA triplet and the additional HiRes event because it contains several biases. While the maximum likelihood method removes the bias due to choosing an angular bin size, it does not remove the bias due to choosing an energy threshold. The AGASA threshold of eV was chosen in Hayashida et al. (1996) precisely because it maximized the clustering signal in the early data set, a data set which comprises the first 30 of the 57 AGASA events (and two of the triplet events). An unbiased search for point sources using this energy threshold would require that these 30 events be set aside. Further bias occurs because of the ad hoc lowering of the HiRes energy threshold.
The best estimate for the position can be considered an a priori location for a point source search with statistically independent future data. To illustrate the sensitivity of a new data set to this hypothesis, simulations show that a simple binned analysis with a source bin radius centered on this location would give an unbiased chance probability of if 2 out of 40 future events fall into the source bin. In this calculation, it is assumed that the geometrical acceptance for the 40 new events is the same as for the original 40 events.
HiRes is currently the only detector observing the cosmic ray sky in this energy range from the northern hemisphere. We anticipate several more years of data taking, and the search for cosmic ray point sources at the highest energies will continue when more data becomes available.
References
- Abbasi et al. (2004a) Abbasi, R.U. et al. 2004a, Phys. Rev. Lett., 92, 151101
- Abbasi et al. (2004b) Abbasi, R.U. et al. 2004b, ApJ, 610, L73
- Abbasi et al. (2004c) Abbasi, R.U. et al. 2004c, Astropart. Phys., 22, 139
- Boyer et al. (2002) Boyer, J.H. et al. 2002, Nucl. Instr. Meth. A, 482, 457
- De Marco, Blasi, & Olinto (2003) De Marco, D., Blasi, P., & Olinto, A.V. 2003, Astropart. Phys., 20, 53
- Dolag et al. (2003) Dolag, K., Grasso, D., Springel, V., & Tkachev, I.I. 2004, JETP Lett., 79, 719
- Finley et al. (2004) Finley, C.B. et al. 2004, arXiv: astro-ph/0411130
- Finley & Westerhoff (2004) Finley, C.B., & Westerhoff, S. 2004, Astropart. Phys., 21, 359
- Hayashida et al. (1996) Hayashida, N. 1996, Phys. Rev. Lett., 77, 1000
- Hayashida et al. (2000) Hayashida, N. et al. 2000, arXiv: astro-ph/0008102
- Heck et al. (1998) Heck, D. et al. 1998, CORSIKA: A Monte Carlo Code to Simulate Extensive Air Showers, Forschungszentrum Karlsruhe, Wissenschaftliche Berichte FZKA 6019
- Kinnison et al. (1982) Kinnison, W.W. et al. 1982, Phys. Rev. D 25, 2846
- Matthews et al. (2003) Matthews, J.N. et al. 2003, Proc. of 28th ICRC, Tsukuba, Japan, 350
- Meyer (1975) Meyer, S.L. 1975, Data Analysis for Scientists and Engineers, John Wiley & Sons Inc.
- Eidelman et al. (2004) Eidelman, S. et al. (Particle Data Group) 2004, Phys. Lett. B, 592, 1
- Sadowski et al. (2002) Sadowski, P.A. et al. 2002, Astropart. Phys., 18, 237
- Sigl, Miniati & Ensslin (2004) Sigl, G., Miniati, F. & Ensslin, T. 2004, Phys. Rev. D 70, 043007
- Takeda et al. (1998) Takeda, M. et al. 1998, Phys. Rev. Lett., 81, 1163
- Takeda et al. (1999) Takeda, M. et al. 1999, ApJ, 522, 225
- Takeda et al. (2003) Takeda, M. et al. 2003, Astropart. Phys., 19, 447
- Wascko (2000) Wascko, M.O. 2000, PhD thesis, University of California, Riverside