The Fundamental Plane of Cluster Ellipticals at z = 1.2511affiliation: Based on observations with the NASA/ESA Hubble Space Telescope, obtained at the Space Telescope Science Institute, which is operated by the Association of Universities for Research in Astronomy, Inc. under NASA contract No. NAS5-26555. 22affiliation: Based on observations obtained at the European Southern Observatory using the ESO Very Large Telescope on Cerro Paranal (ESO Programme 169.A-0458).
Abstract
Using deep HST ACS imaging and VLT FORS2 spectra, we determined the velocity dispersions, effective radii and surface brightnesses for four early-type galaxies in the cluster RDCS 1252.9-2927. All four galaxies are massive, . These four galaxies, combined with three from RDCS 0848+4453 at , establish the Fundamental Plane of massive early-type cluster galaxies at . The offset of the Fundamental Plane shows that the luminosity evolution in rest-frame is for galaxies with . To reproduce the observed mass-to-light ratio () evolution, we determine the characteristic age of the stars in these galaxies to be Gyrs, i.e. . Including selection effects caused by morphological bias (the “progenitor bias”), we estimate an age of Gyrs, or for the elliptical galaxy population. Massive cluster early-type galaxies appear to have a large fraction of stars that formed early in the history of the universe. However, there is a large scatter in the derived values, which is confirmed by the spread in the galaxies’ colors. Two lower mass galaxies in our sample have much lower values, implying significant star-formation close to the epoch of observation. Thus, even in the centers of massive clusters, there appears to have been significant star formation in some massive, , galaxies at .
Subject headings:
galaxies: clusters: general — galaxies: elliptical and lenticular, cD, — galaxies: evolution — galaxies: fundamental parameters — galaxies: photometry — galaxies: clusters: RDCS 1252.9-29271. Introduction
The Fundamental Plane (FP) allows a direct measure of the mass and the mass-to-light ratio, , of early-type galaxies. The FP combines three variables, the effective radius (), the average surface brightness within the effective radius (), and the velocity dispersion (). These data are combined into the relation for the rest-frame band (Jorgensen et al., 1996). With such quantities, we can measure and how it depends on mass, . Massive galaxies out to appear to evolve as for both clusters (Kelson et al., 2000b; van Dokkum & Franx, 2001; Wuyts et al., 2004) and in some field samples, though there is a larger scatter for the latter (van Dokkum et al., 2001; Gebhardt et al., 2003; van Dokkum & Ellis, 2003; van de Ven et al., 2003; van der Wel et al., 2004b). This slow rate of evolution implies an early epoch of formation, , for the stars in early-type galaxies assuming passively evolving simple stellar populations. However, at , only % of stellar mass we observe today have been formed (e.g.; Madau et al., 1998; Steidel et al., 1999; Rudnick et al., 2003). This implies that the majority of stars in cluster early-type galaxies formed long before the average star in the universe. Observations determining the luminosity-weighted age of galaxies close to will test this, and there are only three galaxies with FP measurements to date at these redshifts (van Dokkum & Stanford, 2003).
We observed four luminous early-type galaxies in the rich, massive and X-ray luminous cluster of galaxies RDCS 1252.9-2927 (Rosati et al., 2004) using a combination of the Very Large Telescope (VLT) Focal Reducer/low dispersion Spectrograph 2 (FORS2) and the Advanced Camera for Surveys (ACS) on the Hubble Space Telescope (HST). RDCS 1252.9-2927 is the most massive cluster found to date at , thus it contains a number of luminous and, likely, massive galaxies. We use the FP to constrain the evolution and set the mass scale for four galaxies in RDCS 1252.9-2927. These results, combined with van Dokkum & Stanford (2003), measure the ages of the stellar populations in early-type galaxies at . We assume a , and . All observed magnitudes are in the AB system. However, for comparison with previous work, we convert observed magnitudes into rest-frame Johnson using the Vega zeropoint.
2. RDCS 1252.9-2927 Fundamental Plane Data
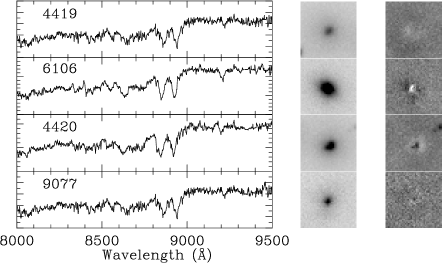
Four galaxies in RDCS 1252.9-2927 were selected from among the nine known cluster members (Demarco, 2003; Lidman et al., 2004) with mag that fit into a single multi-slit mask. These are the first, second, third and fifth brightest cluster members. An image of each is shown in Figure 1 along with the spectra, in descending order of brightness. Below we discuss the measurement of and from the ACS data, the from the FORS2 spectra and the conversion to the rest-frame Johnson .
2.1. HST ACS Imaging
As described in Blakeslee et al. (2003), the Advanced Camera for Surveys (ACS) imaged RDCS 1252.9-2927 with four overlapping pointings. Each pointing has three orbits in the F775W filter, or , and five orbits in the F850LP filter, or . A de Vaucouleurs, or model, was fit to each of the individual images using the method of van Dokkum & Franx (1996). Each galaxy in each image had a unique point spread function generated using the TinyTIM v6.2 package (Krist, 1995). The two galaxies at the middle of the cluster, referred to as # 4419 and # 4420 in Table 1, were fit simultaneously. Table 1 contains the average of the best fitting parameters for each image with the galaxies listed in order of decreasing flux. We plot in Figure 1 a mean image, corrected for the ACS distortion, of all the images for each galaxy along with the average residuals from the fits.
The product is used to measure the evolution in . Because of the strong anti-correlation between the error for and the error for (Jorgensen et al., 1993), the uncertainties on this product for all four galaxies is small at 5%.
2.2. VLT FORS2 Spectra
The four galaxies in Table 1 were observed using FORS2, on the VLT, through slit masks with the 600z grism in conjunction with the OG590 order separation filter. The observations were done in service mode with a series of exposures, dithered over four positions, for a total integration time of 24 hours. The resulting signal-to-noise (S/N) ratios at 4100 Å rest-frame are listed in Table 1. Details concerning the data reduction are described in van der Wel et al. (2004a).
The high spectral resolution, 80 per pixel, resulted in accurate internal velocity dispersions for the four cluster members (see Table 1). The spectra were fit, by the method of van Dokkum & Franx (1996), with stellar spectra (Valdes et al., 2004) with a wide range in spectral type and metallicity. For more details concerning the usage of the templates and the derivation of velocity dispersions, see van der Wel et al. (2004a).
The velocity dispersions were aperture corrected to a 1.7 kpc circular aperture at the distance of Coma as described in Jorgensen et al. (1996). The listed errors include a statistical error derived from the value of the fit and a systematic error estimated to be at most 5% for the spectra with the lowest S/N ratio.
2.3. Rest-frame Magnitudes
In order to compare with other FP results in the literature, the observed magnitudes must be converted into , the equivalent of observing the galaxies with a rest-frame Johnson B filter (Bessell, 1990) in the Vega system. The filter is centered at 4058Å in the rest-frame of the galaxies in RDCS 1252.9-2927. This filter is close to the central wavelength of Johnson B at 4350Å, but even the modest wavelength difference means that the conversion between at and the Johnson B will depend on the color of the galaxy. To compute this conversion, we redshifted the Sbc and E templates from Coleman et al. (1980) to and calculated the magnitude as a function the observed and color, yielding . This approach is slightly different than that used in Kelson et al. (2000a) or van Dokkum & Stanford (2003), but yields results that differ in the mean by magnitudes, with an error of only % (see Holden et al., 2004). The , along with , photometry comes from the VLT ISAAC and NTT SOFI observations discussed in Lidman et al. (2004). We will also use this data to examine the rest-frame optical colors below. All colors were measured within an aperture of two effective radii. The ACS imaging was smoothed to match the seeing in the ISAAC data to measure this color.
The statistical errors on the FP are dominated by the error on the velocity dispersions, which are around 10% including an estimate of the systematic error. Because this error dominates the error budget, we will take the error on to be the FP error for the rest of the paper.
3. The Fundamental Plane at
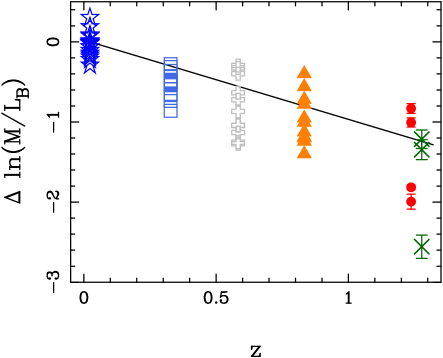
The most straightforward way to measure the evolution in is to compute the offsets for the seven galaxies at from the FP of the Coma cluster (Jorgensen et al., 1996). In Figure 2, we plot our data along, with the FP for Coma, using the rest-frame . We show the average offset for the five most massive galaxies out of the total of seven in our sample. We will discuss below why we remove those two lower mass galaxies. Measuring the offset from the FP ensures that we measuring for galaxies at the same part of the FP or, roughly the same mass. The offset and rate of evolution is readily apparent in Figure 3. We find for five early-type galaxies, three from RDCS 1252.9-2927 and two from RDCS 0848+4453 with masses . This corresponds to an evolution in , a small deviation from the of van Dokkum & Stanford (2003) and the of Wuyts et al. (2004).
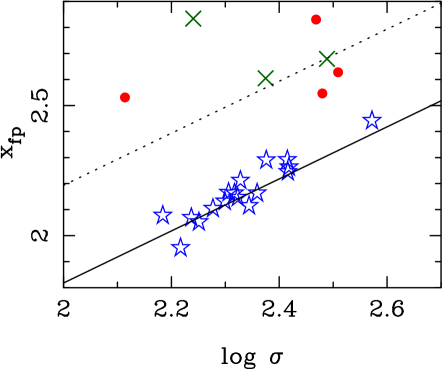
There is a large scatter seen in Figure 3 in , for the seven , early-type galaxies. This scatter is twice the size of the scatter in Coma or MS 1358+62, regardless of whether the scatter is computed for all galaxies, or only the seven most luminous galaxies in either MS 1358+62, or the Coma cluster sample. A large part of this scatter comes from the two lower mass galaxies in the sample. The five galaxies with show , which is not statistically different from the Coma or MS 1358+62 value. There is an obvious selection effect towards low galaxies in a luminosity-selected sample. This may both increase the scatter and bias the mean change in the ratio, hence we remove the two low mass galaxies from our sample.
The values for the galaxies at correlate with the rest-frame colors, as seen in Figure 4. Both the colors and the track a rapidly declining star-formation rate model from Bruzual & Charlot (2003). As this relatively simple stellar population reproduces most of the observations, the observed scatter in is then likely the result of a spread in the luminosity-weighted ages.
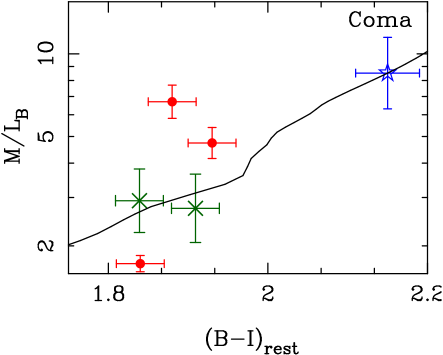
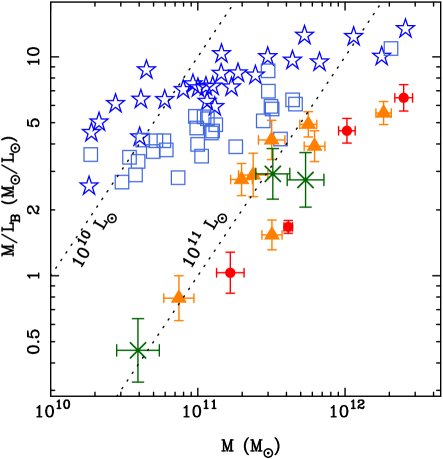
At lower redshifts, the is a function of the total mass (Jorgensen et al., 1996). Such a trend is observed at (see Figure 5) where lower mass galaxies have lower and, therefore, bluer colors (see Figure 4.) The slope of the mass- relation appears to steepen at higher redshifts. This is expected for a population where the spread in the comes from the spread in age. As a stellar population becomes younger, the changes more quickly, so the spread in will grow as observations probe closer to the epoch of formation. However, this trend will be exaggerated by the selection of galaxies at a fixed luminosity as the sample selection will prefer lower galaxies. Lower mass galaxies with larger values for will not appear in this sample because of our magnitude limit, effectively .
4. Implications for the Evolution of Early-type Cluster Galaxies
The rate of the evolution can be used to constrain the luminosity-weighted age for early-type galaxies. The most straight-forward estimate is to assume all galaxies formed at one epoch and find the age of the galaxies that will produce the observed change in from to using population synthesis models. For our sample of five galaxies, the mean age is Gyrs before the time of the observations, or a formation redshift of using the same models as van Dokkum & Stanford (2003), namely Worthey (1994). This agrees with the results from the high mass sample of Wuyts et al. (2004), who found for galaxies regardless of morphology.
When computing the age for the early-type galaxy population, there is an overestimate of the age of a population caused by young galaxies not being counted as part of the early-type population, even if those young galaxies will evolve into early-types after the epoch of observation. This “progenitor bias” depresses the rate of observed evolution in by up to 20% (van Dokkum & Franx, 2001). Using this same assumption, namely that the true evolution is , we instead find Gyrs before , or a formation redshift of . Blakeslee et al. (2003) and Lidman et al. (2004) both find a mean age of Gyrs using the colors of the galaxies in RDCS 1252.9-2927. Blakeslee et al. (2003) removed the “progenitor bias” with simulations, whereas Lidman et al. (2004) uses all galaxies, regardless of morphology to similar effect.
The above results imply that the stars that formed these massive galaxies were created at redshifts of , at which time less than of today’s observed stellar mass was formed (e.g.; Bell, 2005). However, there is a large spread in the for all of the early-type galaxies at , larger than at lower redshifts. Using colors confirms the spread, which can be interpreted as an underlying spread in the age of the populations. Thus, though for the most massive galaxies, some early-type galaxies show much lower values and, corresponding younger ages. In fact, the lowest galaxy in Figure 3 was tentatively classified by van Dokkum & Stanford (2003) as having a recent star-burst based on the spectrum. Such younger appearing galaxies have lower masses than the high galaxies in our sample, but are still massive galaxies with . The implication of all these results is that a significant fraction of the stars in the most massive galaxies appear to have formed very early in the history of the universe, before the majority of stars present today. The massive cluster galaxies appear to follow the same low-redshift trend of the higher mass systems having higher . However, the larger spread at in the indicates that we have identified some massive, , galaxies whose last burst of star formation occurred in the relatively recent past, .
ACS was developed under NASA contract NAS5-32865, and this research was supported by NASA grant NAG5-7697. BH would like to thank Daniel Kelson for useful discussions on the Fundamental Plane. The authors would also like to thank the referee for many useful suggestions.
References
- Bell (2005) Bell, E. F. 2005, in Planets to Cosmology: Essential Science in Hubble’s Final Years, ed. M. Livio (Cambridge: CUP), in press, astro–ph/0408023
- Bessell (1990) Bessell, M. S. 1990, PASP, 102, 1181
- Blakeslee et al. (2003) Blakeslee, J. P., Franx, M., Postman, M., Rosati, P., Holden, B. P., Illingworth, G. D., Ford, H. C., Cross, N. J. G., Gronwall, C., Benítez, N., Bouwens, R. J., Broadhurst, T. J., Clampin, M., Demarco, R., Golimowski, D. A., Hartig, G. F., Infante, L., Martel, A. R., Miley, G. K., Menanteau, F., Meurer, G. R., Sirianni, M., & White, R. L. 2003, ApJ, 596, L143
- Bruzual & Charlot (2003) Bruzual, G. & Charlot, S. 2003, MNRAS, 344, 1000
- Coleman et al. (1980) Coleman, G. D., Wu, C.-C., & Weedman, D. W. 1980, ApJS, 43, 393
- Demarco (2003) Demarco, R. 2003, Ph.D. Thesis
- Gebhardt et al. (2003) Gebhardt, K., Faber, S. M., Koo, D. C., Im, M., Simard, L., Illingworth, G. D., Phillips, A. C., Sarajedini, V. L., Vogt, N. P., Weiner, B., & Willmer, C. N. A. 2003, ApJ, 597, 239
- Holden et al. (2004) Holden, B. P., Stanford, S. A., Eisenhardt, P. R., & Dickinson, M. 2004, AJ, 127, 2484
- Jorgensen et al. (1993) Jorgensen, I., Franx, M., & Kjaergaard, P. 1993, ApJ, 411, 34
- Jorgensen et al. (1996) —. 1996, MNRAS, 280, 167
- Kelson et al. (2000a) Kelson, D. D., Illingworth, G. D., van Dokkum, P. G., & Franx, M. 2000a, ApJ, 531, 137
- Kelson et al. (2000b) —. 2000b, ApJ, 531, 184
- Krist (1995) Krist, J. 1995, in ASP Conf. Ser. 77: Astronomical Data Analysis Software and Systems IV, 349
- Lidman et al. (2004) Lidman, C., Rosati, P., Demarco, R., Nonino, M., Mainieri, V., Stanford, S. A., & Toft, S. 2004, A&A, 416, 829
- Madau et al. (1998) Madau, P., Pozzetti, L., & Dickinson, M. 1998, ApJ, 498, 106
- Rosati et al. (2004) Rosati, P., Tozzi, P., Ettori, S., Mainieri, V., Demarco, R., Stanford, S. A., Lidman, C., Nonino, M., Borgani, S., Della Ceca, R., Eisenhardt, P., Holden, B. P., & Norman, C. 2004, AJ, 127, 230
- Rudnick et al. (2003) Rudnick, G., Rix, H., Franx, M., Labbé, I., Blanton, M., Daddi, E., Förster Schreiber, N. M., Moorwood, A., Röttgering, H., Trujillo, I., van de Wel, A., van der Werf, P., van Dokkum, P. G., & van Starkenburg, L. 2003, ApJ, 599, 847
- Steidel et al. (1999) Steidel, C. C., Adelberger, K. L., Giavalisco, M., Dickinson, M., & Pettini, M. 1999, ApJ, 519, 1
- Valdes et al. (2004) Valdes, F., Gupta, R., Rose, J. A., Singh, H. P., & Bell, D. J. 2004, ApJS, 152, 251
- van de Ven et al. (2003) van de Ven, G., van Dokkum, P. G., & Franx, M. 2003, MNRAS, 344, 924
- van der Wel et al. (2004a) van der Wel, A., Franx, M., van Dokkum, P. G., & Rix, H.-W. 2004a, ApJ, submitted
- van der Wel et al. (2004b) —. 2004b, ApJ, 601, L5
- van Dokkum & Ellis (2003) van Dokkum, P. G. & Ellis, R. S. 2003, ApJ, 592, L53
- van Dokkum & Franx (1996) van Dokkum, P. G. & Franx, M. 1996, MNRAS, 281, 985
- van Dokkum & Franx (2001) —. 2001, ApJ, 553, 90
- van Dokkum et al. (2001) van Dokkum, P. G., Franx, M., Kelson, D. D., & Illingworth, G. D. 2001, ApJ, 553, L39
- van Dokkum & Stanford (2003) van Dokkum, P. G. & Stanford, S. A. 2003, ApJ, 585, 78
- Worthey (1994) Worthey, G. 1994, ApJS, 95, 107
- Wuyts et al. (2004) Wuyts, S., van Dokkum, P. G., Kelson, D. D., Franx, M., & Illingworth, G. D. 2004, ApJ, 605, 677
| Galaxy | aaAll magnitudes are AB. | S/NbbSpectra have a resolution of 3.7 Å(FWHM). | aaAll magnitudes are AB. | Mass | |||
|---|---|---|---|---|---|---|---|
| (″) | (mag per □″) | Å-1 | () | mag | |||
| 4419 | 2.806 | 24.899 | 24 | 302 24 | 2.09 0.02 | 12.40 0.08 | 0.81 0.06 |
| 6106 | 0.487 | 21.573 | 57 | 294 10 | 2.07 0.02 | 11.61 0.08 | 0.22 0.03 |
| 4420 | 1.016 | 23.279 | 29 | 323 21 | 2.11 0.02 | 12.01 0.06 | 0.66 0.06 |
| 9077 | 1.008 | 23.529 | 24 | 130 14 | 1.90 0.02 | 11.22 0.08 | 0.01 0.09 |