Super-Massive Black Holes and Dark Halos
2 Sternberg Astronomical Institute of Moscow State University, Moscow, Russia)
Abstract. The relations between masses of Super-Massive Black Holes, , in galactic nuclei, maximal rotational velocities, , and indicative masses, , of galaxies are studied for galaxies with the available rotation curves. correlates with both and , although much weaker than with the central velocity dispersion . Masses for early-type galaxies (S0-Sab), which usually possess more luminous bulges, are, on average, larger than those for late-type galaxies with similar velocities of rotation. It enables to conclude that masses of black holes are determined mainly by the bulge properties, and - much weaker - by dark haloes of galaxies.
1 Introduction
A discovery of compact objects, most likely Super-Massive Black Holes (SMBH), in the nuclei of galaxies, yielded the intensive discussion on the origin and evolution of these unique objects and the role they take in the evolution of galaxies. To clarify the problem it is important to know how the mass of a black hole is related to masses of different galactic components. The masses of SMBH have been found to correlate, although with great dispersion, with the luminosity of spheroidal components of galaxies. This conclusion was made as far back as 90s [1] and confirmed later on: the most massive SMBH are observed in the cores of lenticular and elliptical galaxies of high luminosity. This does not specify, however, whether the SMBH mass is determined by the processes in the nuclear environment or the above-mentioned relation appears due to the mechanism of simultaneous formation of galaxies and the SMBH. Both alternatives are discussed in literature.
In the first case the SMBH mass, , grows with time because of accretion of matter in the gravitational field of galactic bulge (see for example the discussion in [2, 3]). One of the possible mechanism is the accretion of gas due to the drag force by the radiation from bulge stars [4, 5]. This approach allows the tight correlation to be accounted for between and the central dispersion of stellar velocities, . The latter indicates, to some extent, the depth of the potential well where the stars of these slow-rotating components are moving.
In the second case, when SMBH forms parallel with the galaxy formation, cosmological scenarios are considered, describing gravitational contraction of the initially expanding medium which included both barionic matter and non-barionic dark matter. The SMBH mass is specified in this case by the total mass of a galaxy formed in the field of a dark non-baryonic halo rather than by the bulge mass. A mass of halo, in turn, should be linked with the maximal (asymptotic) rotation velocity of the galaxy (see discussion in [6]).
An intermediate opportunity could also be realized with both barionic and non-barionic galactic components involved in the formation of a black hole. Black hole may grow slowly during the lifetime of the galaxy due to both stellar accretion and non-adiabatic accretion of the dark matter, achieving the observed mass over the billions of years [7, 8].
Although the second scenario does not imply a direct relation between and velocity dispersion , a link between these two values may be explained as a consequence of the correlation of with the maximal galactic rotation velocity, Vm. This idea was first put forward in [6] and supported later in [9, 10].
A direct comparison of the mass with the velocity appears to be the most reliable way to find correlation between these parameters. However there are not so many galaxies which have both the reliable SMBH mass estimation and a well defined rotation curve. A conclusion upon relation of with the rotation velocity was based on correlations between and , and between and , existing for galaxies of different morphological types [9, 10]. Currently, a growing number of disk (spiral and lenticular) galaxies becomes available for which both and are known, what allows us to study the correlation mentioned above directly.
2 Correlation between the Black Hole Masses and the maximal velocities of rotation
Table 1 includes galaxies which have both SMBH mass estimated and rotation curves measured up to radial distances where they reach maximum or plateau. The second column displays morphological type of galaxies; the third column is the log of central velocity dispersion. The fourth one contains maximal disk rotation velocities (in km/s), on the logarithmic scale, obtained for the disc inclination angle which is presented in the next column ( for the disk face-on orientation). The last three columns contain the references to the source of rotation curve, log of the SMBH masses (in solar units), and the corresponding references. Masses were taken from [11, 12], where different estimates from the literature were brought together.
TABLE 1. Galaxies with the available rotation curves and SMBH masses
| Galaxy | Type | i | Reference | Reference | |||
|---|---|---|---|---|---|---|---|
| Milky Way | - | - | 2.36 | - | [13] | 6.47 | [11] |
| NGC224 | Sb | 2.27 | 2.45 | 77 | [13] | 7.52 | [11] |
| NGC598 | Sc | 1.56 | 2.01 | 54 | [13] | <3.18 | [11] |
| NGC1023 | S0 | 2.31 | 2.40 | 70 | [14] | 7.59 | [11] |
| NGC1052 | S0 | 2.43 | 2.28 | 44 | [14] | 8.29 | [12] |
| NGC1365 | SBb | 2.18 | 2.44 | 46 | [13] | 7.66 | [12] |
| NGC2273 | SBa | 2.09 | 2.34 | 53 | [15] | 7.27 | [12] |
| NGC2787 | S0-a | 2.29 | 2.37 | 55 | [14] | 7.59 | [11] |
| NGC2841 | Sb | 2.31 | 2.52 | 68 | [13] | 8.42 | [12] |
| NGC3031 | Sab | 2.21 | 2.38 | 59 | [13] | 7.80 | [11] |
| NGC3079 | SBcd | 2.16 | 2.38 | 90 | [13] | 7.65 | [12] |
| NGC3115 | E-S0 | 2.41 | 2.57 | 67 | [14] | 8.95 | [11] |
| NGC3169 | Sa | 2.22 | 2.30 | 63 | [16] | 7.91 | [12] |
| NGC3227 | SBa | 2.12 | 2.43 | 56 | [17] | 7.59 | [11] |
| NGC3384 | E-S0 | 2.17 | 2.39 | 59 | [14] | 7.26 | [11] |
| NGC3627 | SBb | 2.06 | 2.30 | 60 | [18] | 7.26 | [12] |
| NGC3675 | Sb | 2.03 | 2.35 | 60 | [19] | 7.11 | [12] |
| NGC3783 | SBab | 2.19 | 2.26 | 25 | [20] | 6.97 | [11] |
| NGC4051 | SBbc | 1.92 | 2.20 | 49 | [21] | 6.11 | [11] |
| NGC4151 | SBbc | 2.19 | 2.18 | 21 | [22] | 7.18 | [11] |
| NGC4203 | E-S0 | 2.21 | 2.36 | 29 | [23] | <7.08 | [11] |
| NGC4258 | SBbc | 2.13 | 2.32 | 67 | [13] | 7.61 | [11] |
| NGC4321 | SBbc | 1.93 | 2.43 | 27 | [13] | 6.80 | [12] |
| NGC4388 | Sb | 2.06 | 2.37 | 90 | [24] | 6.80 | [12] |
| NGC4395 | SBm | - | 1.95 | 71 | [25] | <5.04 | [11] |
| NGC4450 | Sab | 2.11 | 2.30 | 44 | [26] | 7.30 | [12] |
| NGC4459 | S0 | 2.24 | 2.48 | 42 | [27] | 7.81 | [11] |
| NGC4501 | Sb | 2.21 | 2.48 | 56 | [26] | 7.90 | [12] |
| NGC4548 | SBb | 2.16 | 2.48 | 38 | [28] | 7.40 | [12] |
| NGC4565 | Sb | 2.13 | 2.41 | 86 | [13] | 7.70 | [12] |
| NGC4579 | SBb | 2.19 | 2.50 | 36 | [26] | 7.85 | [12] |
| NGC4594 | Sa | 2.40 | 2.56 | 84 | [29] | 9.04 | [11] |
| NGC4725 | SBab | 2.12 | 2.37 | 51 | [25] | 7.49 | [12] |
| NGC4736 | Sab | 2.06 | 2.26 | 35 | [13] | 7.30 | [12] |
| NGC4945 | SBc | 2.11 | 2.28 | 78 | [13] | 6.04 | [11] |
| NGC5033 | Sc | 2.12 | 2.44 | 55 | [13] | 7.30 | [12] |
| NGC5194 | Sbc | 1.98 | 2.41 | 20 | [13] | 6.90 | [12] |
| NGC6500 | Sab | 2.3 | 2.48 | 38 | [30] | 8.28 | [12] |
| NGC7469 | Sba | - | 2.08 | 48 | [31] | 6.81 | [11] |
| Circinus | Sb | - | 2.18 | 65 | [32] | 6.11 | [11] |
| IC342 | SBc | 1.89 | 2.30 | 25 | [13] | <5.70 | [11] |
In most cases the SMBH masses were estimated using the most reliable method of reverberation mapping. Other methods give consistent results within a factor of 2-3 [11].
Data on measured rotation velocity and velocity dispersion were searched using the HYPERLEDA catalogues "Kinematic resolved catalogue of galaxies"and "Central velocity dispersion"[13]. The maximal rotation velocities in Table 1 correspond to inclination angles assumed in the original papers. If there were some independent sources of rotation curve, the one with the most reliable curve was preferred. In the case where both absorption and emission line measurements were available only the latter was considered. For some early-type galaxies rotation velocities were measured using only absorption lines. In these cases asymptotic drift, that is stellar velocity dispersion, was taken into account [14]. In some galaxies a rotation curve passes through a local maximum within 1 - 2 kpc from to the center after which the curve flattens of resumes to grow. Such maximum was not considered to belong to the galactic disk or halo, and, therefore, was ignored while assessing . The galaxies, which display strong large-scale non-circular gas motion were not included in the sample.
The maximal rotation velocities of the galaxies, , versus BH masses, , are shown in Fig. 1.
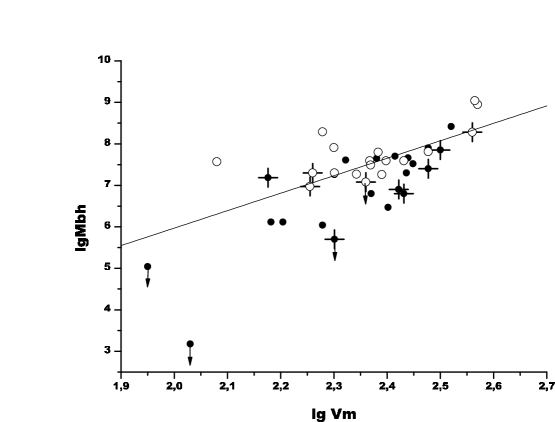
Non-filled symbols mark early-type galaxies, S0-Sab, possessing the most luminous bulges. The diagram does not show a tight correlation between the parameters considered (correlation coefficient being k=0.74), although slowly rotating disk galaxies in all cases have low-mass black holes. Two close interacting galaxies from the sample (NGC 3227 and NGC 5194) do not appear aside in the plot. The lowest point in the diagram belongs to the M33 galaxy for which only upper mass limit of SMBH is known.
Figure 1 shows some difference between galaxies of early and late morphological types. S0-Sab galaxies have, on the average, more massive black holes as compared to late-type galaxies with similar velocity .
The straight line in the diagram represents a relation between the values under comparison that was found in [10] using indirect estimates of . The agreement with our data is rather poor, most points lying below the straight line in the plot.
Figure 2 displays the relation between and the central dispersion of velocities, , for a sample of galaxies (the data are not available for some objects).
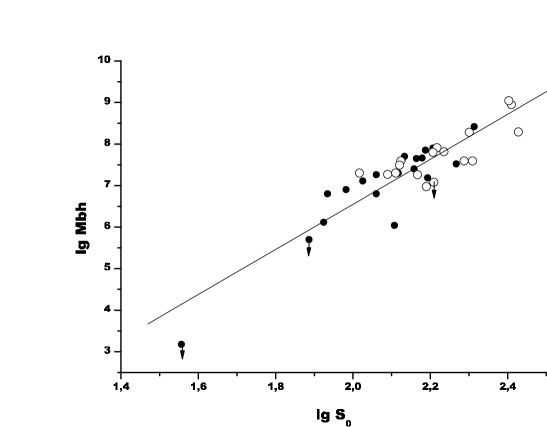
The correlation between these two parameters is tighter than between and , the correlation coefficient being equal for all galaxies and 0.92 for the spiral galaxies from the sample. It is noteworthy that both the early-type galaxies (non-filled symbols) and the late-type ones lie in Figure 2 along the same sequence whereas in Figure 1 the early-type galaxies have systematically greater SMBH masses in a wide range of rotational velocities.
It is necessary to take into account that the velocities of rotation are determined with less accuracy than the central velocity dispersions. The main sources of uncertainty are errors in the assumed disk orientation angles (the inclination angle, i, and the position angle of the kinematic major axis, ). The uncertainties they induce are the most essential for nearly face-on galaxies (the discussion concerning casual and systematic errors in determining orientation angles of spiral galaxies see e.g. in [15]). For instance, if , and its error is about this error would change the resulting value of by -0.11 or +0.16 depending on the error sign. Galaxies with are marked in Fig.1 by crosses as the objects with the least reliable assessed. They do not seem to be a real source of observational point scattering.
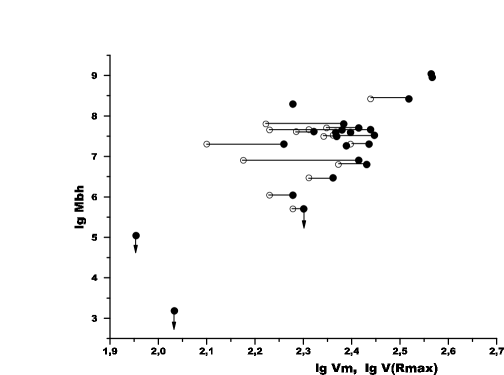
The other source of uncertainty is a complex shape of rotation curves, which in often makes the value of rather ambiguous. In many cases the observed rotation curve continues to increase or to decrease on a disc periphery, not revealing a smooth plateau (see some examples in Fig.3). Moreover, this behavior is hardly the result of the measurement errors: as it was shown in [16], the sign and the meaning of velocity gradients at large correlate with he total luminosities of galaxies.

To reduce the uncertainty when assessing , we have extracted from the list of galaxies in Table 1 a subsample of galaxies with the most reliable rotational curves. First of all, these are galaxies entering into the representative samples of galaxies with extended rotation curves by Y.Sofue et al. [17] and S.Casertano, J.H.Gorkom [16]. The rotation curves of these galaxies cover at least where is a radius of the galaxy up to the isophote =25 . For the early-type spirals to be included, our subsample contains also five nearest non-interacting S0 galaxies, velocities of rotation of which were determined using the same approach [14], and Sombrero galaxy (NGC 4594), type Sa, with a very bright bulge. Its rotation curve, obtained from emission line measurements, is given in [18]. Although the rotational curves of these early-type galaxies are less extended than those of the other galaxies of the subsample, they still extend up to distance , beyond the inner region of a galaxy with a steep velocity gradient.
For the galaxies where the velocity curve falls in the periphery, both the maximal rotation velocity, , within the rotation curve and the rotation velocity at the maximal distance from the center, , were considered separately. Since a relative contribution of the dark halo into the mass of the galaxy increases with , the velocity is expected to be bound up with the halo properties more tightly than . There is an indirect evidence in favor of this suggestion, namely, the Tully-Fisher relation between the luminosity of galaxies and their rotation velocity becomes more tight if to use the velocity of far-from-center regions [19].
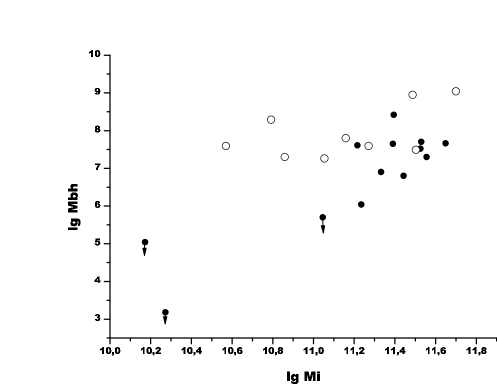
Figure 4 displays the SMBH mass versus and (non-filled circles). It follows from this diagram that the relation between and the rotation velocity for the subsample of galaxies remains very "loose". The use of instead of makes scattering of points in the plot even greater (k=0.75 against k=0.82). It confirms indirectly that depends very weakly on the halo mass. The dispersion of points in the diagram was not found to depend on the inclination angle of the galactic disk either.
A similar conclusion can be drawn while comparing with an indicative mass of a galaxy, , which is close to a total mass of a galaxy containing within the optical radius of a disc. Note that the dark halo mass of spiral galaxies usually dominates over luminous mass within this limit (see, for example, [20, 21, 22] and references therein). Figure 4 displays the plot for the galaxies of the subsample we consider. Large scattering of the points in the diagram demonstrates that the correlation between the black hole mass and the total galaxy mass remains rather weak.
3 Conclusions
Correlations between SMBH masses and parameters depending on the dark halo mass (, , or ) which are determined directly from the rotation curves, are much looser than their correlation with the central velocity dispersion. Moreover, early-type disk galaxies with a higher relative luminosity of their bulge usually possess more massive black holes than late-type galaxies for the same rotational velocities (at least in the interval 150-250 km/s), although these galaxies follow the same relation as the late-type spirals if the correlation between and the central velocity dispersion is considered (Fig. 2). These facts confirm the presence of a strong link between a black hole and a bulge, and rather weak link with halo.
As Fig. 1 shows, a relation between the rotational velocity and the black hole mass becomes especially loose, if exist at all, for slow rotating galaxies (although remains to be correlated with their central velocity dispersion. This property is to be taken into account while considering the process of SMBH formation.
A tight connection between SMBH and a bulge is the argument in favor of a scenario according to which the central black hole is growing due to accretion processes during the period of whole life of a galaxy rather than it forms together with the galaxy.
Different processes of black hole growth, discussing in the literature, include the accretion of gas, stars, dark matter (see f.e. [6, 7, 8] and references therein) or even the accretion black holes formed in globular clusters [39]. It is possible however that the initial masses of primeval black holes in galactic nuclei depend on the process of a bulge formation in a potential well (cusp) created by a massive dark halo. In this scenario a halo may indirectly influence the process of mass growing and its present day value [7, 8].
To clarify how the SMBH mass grows with time, the rate of accretion onto the black hole is to be estimated in a direct way. Recently such estimates were carried out (within certain simplifications) for a number of galaxies, from the intensities of [OIII] line in galactic nuclei [24]. The results obtained indicate that characteristic mass growth time for a SMBH is rather different, depending on whether the black hole is a low-mass or a massive one, being longer for the latter. The growth time of SMBH seems to be comparable with the growth time of the surrounding stellar bulge. The suggestion does not conflict with the conclusion that current SMBH masses and their growth depends on the processes occurring now (or occurred in the past) in the bulges of galaxies.
Authors thank A.D. Chernin for stimulating discussion and A.V.Tutukov for the valuable remarks.
The work is supported by the Russian Federal Principal Scientific and Technical Program (contract 40.022.1.1.1101) and RFBR grant 04-02-16518.
References
- [1] Kormendy J., Richstone D. Ann. Rev. Astron. Astrophys. 1995. V.33. P.581.
- [2] Grupe J., Mathur S. Astrophys. J. 2004. V.606. P.L41.
- [3] Yoo J., Mirada-Escude J. Astrophys. J. 2004. In press (astro-ph 0406217).
- [4] Kawakatu N., Umemura M. Astrophys. J. 2004. V.601. P.L21.
- [5] Umemura M. Astrophys. J. 2001. V.560. P.L29.
- [6] Ferrarese L. Astrophys. J. 2002. V.578. P.90.
- [7] Ilyin A.S., Zybin K.P., Gurevich A.V. Zh. Eksp. Teor. Fiz. 2004. V.98, P.5 (astro-ph 0306490).
- [8] Sirota V.A., Ilyin A.S., Zybin K.P., Gurevich A.V. Astro-ph 0403023.
- [9] Pizella A., Corsini E.M., Vega Beltran J.C., et al. Mem. SAIt. 2003. V.74. P.504.
- [10] Baes M., Buyle P., Hau G.K.T., Dejonghe H. MNRAS. 2003. V.341. P.L44.
- [11] Cherepashchuk A.M. Uspekhi Phys. Nauk. 2003. V.173. P.345.
- [12] Merloni A., Heinz S., di Matteo T., et al. MNRAS. 2003. V.345. P.257.
- [13] HYPERLEDA: http://www.sai.msu.ru/hypercat
- [14] Neistein E., Maoz D., Rix H.-W., Tonry J.N. Astron.J. 1999. V.117. P.2666.
- [15] Fridman A.M., Afanasiev V.L., Dodonov S.N., et al. Accepted in MNRAS. 2004.
- [16] Casertano S., Gorkom J.H. Astron.J. 1991. V.101. P.1231.
- [17] Sofue Y., Tutui Y., Honma M., et al. Astrophys.J. 1999. V.523. P.136.
- [18] Rubin V.C., Burstein D., Ford W.K., Thonnard N. Astrophys.J. 1985. V.289. P.81.
- [19] Verheijen M.A.W. Astrophys.J. 2001. V.563. P.694.
- [20] Salucci P. MNRAS. 2001. V.320. P.L1.
- [21] Zasov A.V., Bizyaev D.V., Makarov D.I., Tyurina N.V. Pis’ma v Astron.Zh. 2002. V.28. P.599.
- [22] Zasov A.V., Khoperskov A.V., Tyurina N.V. Pis’ma v Astron.Zh. 2004. In press.
- [23] Tutukov A.V. Astron.Rev. 2004, submitted.
- [24] Heckman T.M., Kauffmann G., Brinchmann J., et al. Astrophys.J. 2004. V.613. P.109.