The Center of Activity in the CSS Superluminal Source 3C 138
Abstract
We present the results from the first quasi-simultaneous multi-frequency (2.3, 5.0, 8.4 and 15 GHz) Very Long Baseline Interferometry (VLBI) observations of a compact steep spectrum (CSS) superluminal source 3C138. For the first time, the spectral distribution of the components within its central 10 milli-arcsecond (mas) region was obtained. This enables us to identify the component at the western end as the location of the nuclear activity on the assumption that the central engine is associated with one of the detected components. The possibility that none of these visible components is the true core is also discussed. The new measurements further clarify the superluminal motions of its inner jet components. The multi-frequency data reveal a convex spectrum in one jet component, inferring the existence of free-free absorption by the ambient dense plasma.
1 Introduction
The compact steep spectrum (CSS) source 3C138 ( = 18.84; z=0.759) is a powerful quasar. It has a convex spectrum peaked at 130 MHz with a steep high frequency spectrum of 0.65 (), suggesting that its total flux density is dominated by the emissions from the jet and lobe components. Its arc second-scale radio structure consists of a core, several bright jet knots, a compact lobe to the east and a fainter, more diffuse lobe to the west (Akujor et al., 1993, and references therein). High resolution VLBI observations (Shen et al., 2001; Cotton et al., 2003) have revealed at least three compact components within the central core region. The exact location of the real core in 3C 138, however, remains uncertain. This is mainly due to the lack of high-resolution spectral information on two possible candidates (components A and B in Cotton et al., 2003). From their earlier brightness measurements of two components, Fanti et al. (1989) claimed that component B, which is bright and compact, would be associated with the central engine. Based on the very weak linear polarization (0.4%) in component A compared to a peak polarized intensity of 3.5% for component B at 5.0 GHz (Cotton et al., 1997) and the less time variability in component B over 12 years (Shen et al., 2001), it is argued that the western end component A is most likely the location of the nuclear activity.
In this paper, we will present the results on the core identification using the spectral data obtained from the first quasi-simultaneous multi-frequency VLBI imaging of 3C 138.
2 Observations and data reduction
The observations were performed with the NRAO111The National Astronomy Observatory (NRAO) is operated by Associated Universities Inc., under cooperative agreement with the National Science Foundation. Very Long Baseline Array (VLBA) on August 20, 2001. With the capability of the frequency switching, 3C 138 was observed at four frequency bands including the dual frequency (2.3/8.4 GHz), 5.0 GHz and 15.4 GHz. Observations at different frequencies were interlaced to ensure the comparable coverage at each band, with a total observing time of 130, 130 and 250 minutes at dual 2.3/8.4, 5.0 and 15.4 GHz, respectively. For each scan, data were recorded in 1 bit sampling VLBA format with a total bandwidth of 64 MHz (eight 8 MHz IF channels) per circular polarization at each station. For the dual frequency (2.3/8.4 GHz) scans, the right-circular polarized (RCP) radio signals were recorded simultaneously with four 8 MHz channels for each of 2.3 and 8.4 GHz. The left-circular polarized (LCP) signals were recorded in all 8 IFs for scans at both 5.0 and 15.4 GHz.
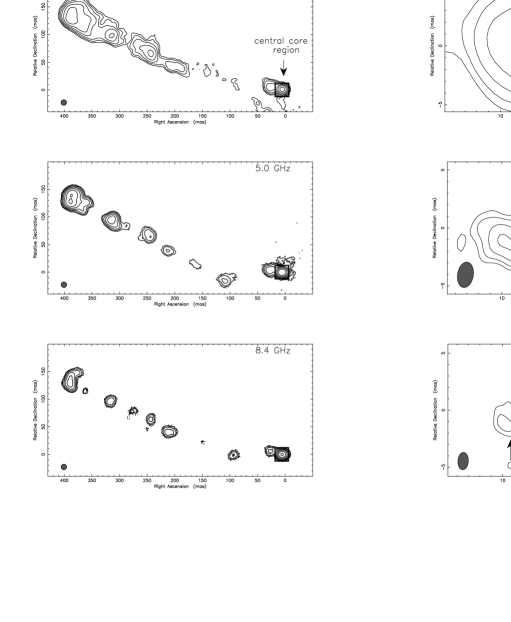
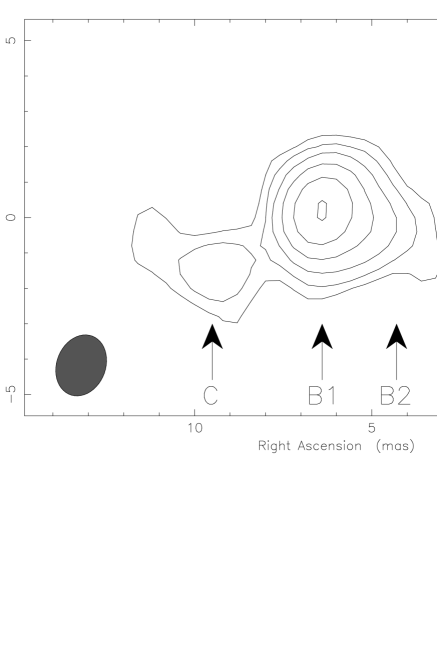
The data correlation was made at the VLBA correlator in Socorro, New Mexico, USA. All of the post-correlation data reduction was carried out within the NRAO AIPS (Schwab & Cotton, 1983) software and the Caltech DIFMAP (Shepherd, 1997) package. A priori visibility amplitude calibration was done using the antenna gain and the system temperature measured at each station. The global fringe fitting was successfully performed for observations at four frequencies of 2.3, 5.0, 8.4 and 15.4 GHz. To minimize the smearing effects on the large field (400 mas) imaging, fringe-fitted data were averaged to 20 sec in time and kept 8 MHz of each IF in frequency in the process of the commonly used self-calibration iteration. As a result, high-resolution VLBI images of 3C 138 (including both the extended emission from the hotspots and jet knots and the compact emission from the central core region) were made at frequencies 2.3, 5.0 and 8.4 GHz (Fig. 1). The first 15.4 GHz VLBI image of 3C 138 only shows the central compact core emission (Fig. 2) because the large scale structure is heavily resolved.
3 Results
3.1 structure
It can be seen from Fig. 1 (left) that the large scale structure of 3C 138 observed at three different frequencies is very similar. It consists of two distinct emission regions at two ends which are separated by 400 mas along a position angle of 70o and, some discrete jet knots seen in between. These jet knot components are heavily resolved with more diffuse emissions recovered at lower frequency. These agree very well with the existing VLBI images. The misplacement and missing of some knots at one or two frequencies are treated as artifacts mainly due to the complex structure of the source emission at this scale. The counter-jet emission at 250 mas west to the compact core seen by 1.7 GHz VLBI observations (Cotton et al., 1997) was not detected in our observations, consistent with the non-detection results from past 5.0 GHz VLBI observations (Shen et al., 2001; Cotton et al., 2003).
In the central 10 mas core region, in addition to the previously reported three components (e.g. Shen et al., 2001), a new component was consistently seen at 5.0, 8.4 and 15.4 GHz in August 2001 (Figs. 1 and 2). This can be identified with the component B2 appearing on the 5.0 GHz linear polarization images (Cotton et al., 2003) in three epochs from September 1998 to October 2002.
3.2 Spectrum and core identification
For the first time, four central components A, B1, B2 and C (after Cotton et al., 2003) were seen at four frequencies quasi-simultaneously. This removes any time variation in the structure and makes it possible to estimate the component’s spectral index which can be used to clarify the core identification. The quantitative description of the source structure in the central 10 mas was determined by model fitting to the calibrated visibility data at each frequency. The results are tabulated in Table 1. The first column is the component designation followed by the component’s flux density in Jy, separation and position angle of each component with respect to component A in mas and degrees, respectively, the size (FWHM) of circular Gaussian component in mas, and the component’s brightness temperature in the source rest frame estimated using the formula given in Shen et al. (1997).
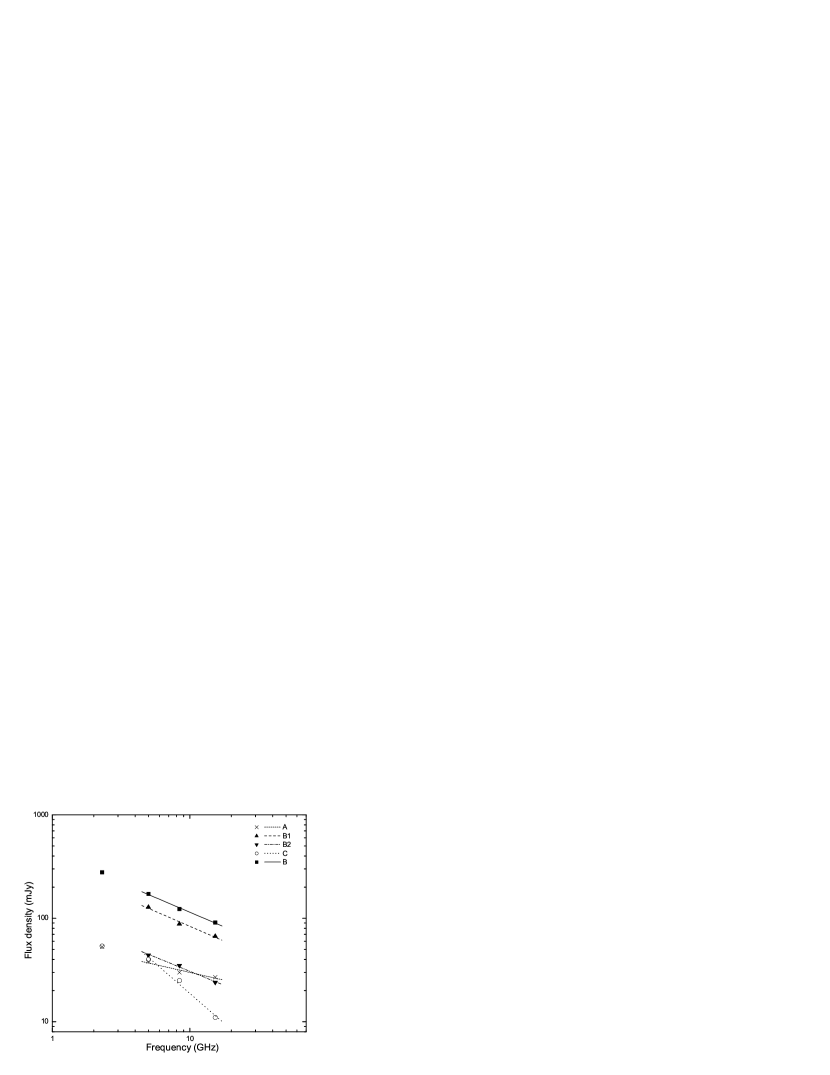
Fig. 3 shows the spectral distribution based on these measurements. The fitting results of spectral index (Sν -α) are listed in Table 2. The uncertainties of the spectral indices are the errors of fitting to the modelled flux densities in Table 1. Since components B1 and B2 were not well resolved at 2.3 GHz (see Fig. 1) and there is a significant absorption towards component C at 2.3 GHz (see below), only measurements at 5.0, 8.4 and 15.4 GHz are used in the least squares fitting for the spectral indices () of components B1, B2 and C. For components A and B (as the combination of components B1 and B2 at frequencies higher than 2.3 GHz), spectral indices between 2.3 and 15.4 GHz () are also estimated as well as . It can be seen that component A has the flattest spectral index of 0.30. Adding one more data point at 2.3 GHz in the fitting, we obtained the fitted spectral index of 0.37 for component A. Again, this is flatter than that of 0.59 for another candidate (component B). This is in favor of component A being the nuclear component. Both components B1 and B2 have almost the same spectral indices of 0.57 and 0.54, suggesting the same origin of or environment in both components. Thus, it is very unlikely that either of B1 and B2 was the location of the central engine. Our core identification is further supported by the measured brightness temperature TB (see Table 1). Component A has the highest TB of 3.4109 K at 15.4 GHz which is almost kept unchanged at other lower frequencies, while both components B1 and B2 see a decreasing in TB with the frequency. This identification is consistent with the results from the studies of the linear polarization (Cotton et al., 1997, 2003) and variability (Shen et al., 2001). Component C is a typical jet component with the spectral index of 1.15 between 5.0 and 15.4 GHz. For comparison, we also calculated the spectral index for both lobe emission at the eastern end of 400 mas and a jet emission at 25 mas east to the central core region (see Fig. 1) based on their integrated flux densities estimated from the images at 2.3, 5.0 and 8.4 GHz . They are eventually the same of about 1.5.
To ensure an accurate absolute flux density calibration at all the observing frequencies, a strong compact quasar PKS 0528+134 was observed as a flux density calibrator during our VLBA observations of 3C 138. The comparison between the total flux density measurements at 5.0, 8.4 and 15.4 GHz by the University of Michigan Radio Astronomy Observatory (UMRAO) and at 2.3 GHz by the NRAO Green Bank Interferometer (GBI), and the integrated flux densities in the VLBA images, indicates that the errors in the absolute flux density calibration are about 3%, 5%, 2% and 10% at frequency of 2.3, 5.0, 8.4 and 15.4 GHz, respectively (Cai et al. in preparation). In addition, there are typical 10% errors in the flux density due to the Gaussian model fitting. Taking into account the overall error budgets due to these effects in the spectral fitting, we obtained for components A and B of 0.380.09 and 0.600.09, respectively, supporting the core identification discussed above.
For component C, there must be an absorption at 2.3 GHz in order to fit in the spectral shape between 4.8 and 15.4 GHz. The mechanism for the absorption could be the intrinsic Synchrotron Self-Absorption (SSA) or the Free-Free Absorption (FFA) by the ambient cold plasma. Both can produce convex spectra: Sν 2.5[1 – exp(- for SSA, and Sν -α exp(- for FFA, where is the observing frequency in GHz, and are the SSA and FFA coefficients at 1 GHz, respectively, and is the spectral index. Either of two models (SSA and FFA) can fit the observed convex spectrum of component C quite well. With a fixed spectral index =1.2 (see Table 2), the fitted 1 GHz absorption coefficients and Synchrotron flux density are =32 and S0=8.6 mJy and, =4.3 and =300 mJy for SSA and FFA, respectively. For SSA model, the fitted spectrum has a peak flux density of 59 mJy at a turn-over frequency 2.8 GHz. This would require a very large magnetic field within component C of about 35 G, which is unrealistic for component C to maintain its synchrotron emission for years against synchrotron loss (Kellermann & Pauliny-Toth, 1981). However, the non-detection of any polarized emission in the inner jet component C is consistent with component C being surrounded by a patchy but dense medium (Cotton et al., 2003). Thus, it is very likely that the observed absorption in component C is mainly due to FFA by the ambient cold dense plasma.
3.3 Proper motion
Previous studies have detected superluminal motions in central core region of 3C 138 (Shen et al., 2001; Cotton et al., 2003). To avoid any possible position offset among the measurements made at different frequencies, only 5.0 GHz data (including our new observations) were used to refine the proper motion calculations. Data points at epochs 1985.50, 1989.72 and 1997.85 are from Shen et al. (2001). Data points at epochs 1994.97, 1997.60, 1998.70, 2000.59 and 2002.79 are from Cotton et al. (2003). The data point at epoch 2001.64 is from this work which has well resolved component B into components B1 and B2. By assuming that the position of component B is at the weighted center of two components (B1 and B2) system with the weight proportional to their flux densities, we can obtain the position of component B from the model fitting results of components B1 and B2 at epoch 2001.64.
As shown in Fig. 4, there is no significant change in the speed of motion in both components B (in 18 years) and C (in 8 years) with regard to component A which is assumed to be stationary as the location of the nucleus. The best fitted proper motion is 0.0720.010 and 0.200.03 mas yr-1, corresponding to an apparent superluminal speed of 2.60.4 c and 7.21.0 c for components B and C, respectively (assuming H0=65 km s-1 Mpc-1 and q0=0.5). This is consistent with the published estimate of 3.3 c for component B (Shen et al., 2001). Component C, which is farther away than component B from the nucleus component A, has a much faster motion than component B. This could be due to the (re-)acceleration or a smaller viewing angle of its emission to the observer’s line of sight.
The new component B2 (see Figs. 1 and 2) was first clearly detected in the linear polarization image in September 1998 (Cotton et al., 2003). Since then, both components B1 and B2 have been consistently seen in another two epochs of high-resolution polarization sensitive VLBA observations by Cotton et al. (2003). Inset of Fig. 4 is a plot of the separations between two components B1 and B2 as a function of the observing epochs. Three data points denoted by open circles are estimated from the polarized images (Cotton et al., 2003), and the data point represented by a star is from our total intensity measurement (Table 1).
Obviously, there is a systematic offset of the separation in linear polarized emission from that of total intensity. This is consistent with the significant offsets of the peaks in the polarized and total intensities observed simultaneously, and can be explained by the “holes in a (Faraday) screen” scenario (Cotton et al., 2003). Because of this, the total intensity measurement was not used in the linear fit which gives a fitted proper motion of –0.0090.015 mas yr-1 (represented by a dashed line). Currently, this result is consistent with the claim that there is no relative motion between components B1 and B2 (Cotton et al., 2003) before any future new observations are available to decrease the uncertainty in the determination of the relative motion. If confirmed, such a proper motion would indicate that component B2 is moving towards component B1 at a relative speed of 0.320.54 c, which would be independent evidence that neither B1 nor B2 is related to the location of central activity.
4 Discussion
The main results of this work are summarized in the abstract, so we avoid the redundancy here. It should be noted that all the arguments on the core identification are based on an underlying assumption that central engine must be associated with one of the detected components. But this may not be the case for CSS sources whose emission is usually dominated by the strong knot/lobe/jet emissions. It is proposed (Fanti et al., 1995; Readhead et al., 1996) that CSS sources are part of evolutionary sequence, in which they represents an early stage between the compact symmetric objects and large Fanaroff-Riley type II objects. The true core of 3C 138 which is a prototype of CSS source, could be too weak to be seen, or simply embedded in the surrounding dense medium. If so, the exact location of the center of activity in 3C 138 still remains undetected.
The phase-referenced VLBI observations can provide precise positional information with respect to the external reference source with a sub-milliarcsecond accuracy. By examining the component’s absolute proper motion relative to the more distant compact reference source (Bartel et al., 1986), one can confirm or exclude the presumed location of the center of activity dynamically.
During our VLBA observations at 15.4 GHz, the phase referencing technique was also adopted by fast switching between 3C 138 and a nearby (in angular separation) but distant (z=2.07) bright compact quasar PKS 0528+134, with an observing cycle time of 100 s, consisting of 32 s on PKS 0528+134, 8 s for antenna slewing, 52 s on 3C138, and another 8 s for antenna slewing. This was turned out to be successful with components A and B are well detected (Shang et al., 2004). With more epochs of observations in the future, this will enable us to explore the possibility that none of these visible components is the true core.
References
- Akujor et al. (1993) Akujor, C. E., Spencer, R. E., Zhang, F. J., Fanti, C., Ludke, E., & Garrington, S. T. 1993, A&A, 274, 752
- Bartel et al. (1986) Bartel, N., Herring, T. A., Ratner, M. I., Shapiro, I. I., & Corey, B. E. 1986, Nature, 319, 733
- Cotton et al. (1997) Cotton, W. D., Dallacasa, D., Fanti, C., Fanti, R., Foley, A. R., Schilizzi, R. T., & Spencer, R. E. 1997, A&A, 325, 493
- Cotton et al. (2003) Cotton, W. D., Dallacasa, D., Fanti, C., Fanti, R., Foley, A. R., Schilizzi, R. T., & Spencer, R. E. 2003, A&A, 406, 43
- Fanti et al. (1989) Fanti, C., Fanti, R., Parma, P., Venturi, T., Schilizzi, R. T., Rendong N., Spencer, R. E., Muxlow, T. W. B., & van Breugel, W. 1989, A&A, 217, 44
- Fanti et al. (1995) Fanti, C., Fanti, R., Dallacasa, D., Schilizzi, R. T., Spencer, R. E., & Stanghellini, C. 1995, A&A, 302, 317
- Kellermann & Pauliny-Toth (1981) Kellermann, K. I., & Pauliny-Toth, I. I. K. 1981, ARA&A, 19, 373
- Readhead et al. (1996) Readhead, A. C. S., Taylor, G. B., Pearson, T. J. & Wilkinson, P. N. 1996, ApJ, 460, 634
- Schwab & Cotton (1983) Schwab, F. R., & Cotton, W. D. 1983, AJ, 88, 688
- Shang et al. (2004) Shang, L.-L., Shen, Z.-Q., Chen, X., & Cai, H.-B. 2004, in Proceedings of the 7th European VLBI Network Symposium, ed. R. Bachiller, F. Colomer, J. F. Desmurs, & P. de Vicente, 69
- Shen et al. (2001) Shen, Z.-Q., Jiang, D. R., Kameno, S., & Chen, Y. J. 2001, A&A, 370, 65
- Shen et al. (1997) Shen, Z.-Q., Wan, T.-S., Moran, J. M., Jauncey, D. L., Reynolds, J. E., Tzioumis, A. K. et al. 1997, AJ, 114, 1999
- Shepherd (1997) Shepherd, M. C. 1997, in ASP Conf. Ser. 125, Astronomical Data Analysis Software and Systems VI, ed. G. Hunt, & H. E. Payne (San Francisco: ASP), 77

| Component | S (Jy) | r (mas) | (o) | a (mas) | T |
|---|---|---|---|---|---|
| aathe frequency corresponding to the following model components = 2.3 GHz | |||||
| A | 0.053 | 0.00 | … | 2.33 | 4.0 |
| B | 0.278 | 5.19 | 88.5 | 2.35 | 2.0 |
| C | 0.054 | 9.47 | 94.0 | 2.50 | 3.5 |
| aathe frequency corresponding to the following model components = 5.0 GHz | |||||
| A | 0.038 | 0.00 | … | 0.94 | 3.7 |
| B2 | 0.044 | 4.30 | 96.0 | 1.36 | 2.0 |
| B1 | 0.128 | 6.01 | 87.9 | 0.99 | 1.1 |
| C | 0.040 | 9.43 | 96.7 | 2.80 | 4.4 |
| aathe frequency corresponding to the following model components = 8.4 GHz | |||||
| A | 0.030 | 0.00 | … | 0.43 | 4.9 |
| B2 | 0.035 | 4.58 | 94.5 | 1.27 | 6.6 |
| B1 | 0.088 | 6.20 | 88.4 | 0.70 | 5.4 |
| C | 0.025 | 9.24 | 97.0 | 2.75 | 1.0 |
| aathe frequency corresponding to the following model components = 15.4 GHz | |||||
| A | 0.027 | 0.00 | … | 0.27 | 3.4 |
| B2 | 0.024 | 4.93 | 94.3 | 1.62 | 8.3 |
| B1 | 0.067 | 6.36 | 89.9 | 0.44 | 3.2 |
| C | 0.011 | 9.51 | 99.6 | 1.47 | 4.7 |
Note. — S: the flux density in Jy; (r,): the distance and position angle of each component with respect to component A in mas and degrees, respectively; a: the diameter (FWHM) of circular Gaussian component in mas; TB: the brightness temperature in the source rest frame in K
| Component | A | B (=B1+B2) | B2 | B1 | C |
|---|---|---|---|---|---|
| 0.300.08 | 0.560.04 | 0.540.05 | 0.570.08 | 1.150.13 | |
| 0.370.05 | 0.590.02 | … | … | … |