The Optical and Ultraviolet Spectral Energy Distributions of Short Period Black Hole X-ray Transients in Outburst
Abstract
We compile optical and UV spectra of a sample of ‘typical’ short period black hole X-ray transients in outburst. We also survey determinations of interstellar extinction and distance in order to deredden spectra and compare absolute fluxes. Hence we perform a comparative study of the broad-band spectral energy distributions (SED). We find that given such a homogeneous sample of typical sources, the optical SEDs form a relatively uniform set, all exhibiting quasi-power-law spectra with , where (steeper than the canonical disk spectrum). All become flatter in the UV, although there is more diversity here. The SEDs studied can be broadly divided into two optical-UV spectral states. The UV-hard spectra, e.g. A 0620–00 and GS 1124–684, continue to rise in the far-UV. The UV-soft spectra, e.g. GRO J0422+32, drop off. XTE J1859+226 evolved from UV-soft to UV-hard as it decayed indicating that this effect is a real difference, not a dereddening artifact. All of the spectra can be fitted by a generalized black body disk model with two forms of heating, resulting in the two states. The UV-soft state is consistent with a disk illuminated by a central point source, with irradiative heating dominating over viscous. The UV-hard state is well described by a viscously heated disk, although this requires very high mass flow rates in the case of GS 1124–684. Alternatively, a UV-hard spectrum can be produced if the disk is illuminated by a vertically extended X-ray source such as a central scattering corona or jet. Since scattering is assumed by some numerical simulations, it is worth emphasizing that where illumination comes from (non-local) scattering high above the disk, we generically expect a steeper radial dependence of X-ray heating () than is usually assumed; it is this steep dependence that leads to the UV-hard spectrum.
Subject headings:
accretion, accretion disks – binaries: close – stars: individual: V616 Mon, GU Mus, V2293 Oph, V518 Per, MM Vel, V406 Vul1. Introduction
Black hole X-ray transients (BHXRTs), also known as X-ray novae and soft X-ray transients, are low-mass X-ray binaries (LMXBs) which undergo dramatic X-ray, optical, and radio outbursts, separated by years, decades or even longer periods of quiescence (Tanaka & Shibazaki 1996;Cherepashchuk 2000). The class is diverse, with orbital periods of 4 hrs to a few days to a month. Outburst behavior is similarly varied. Among these, however, are a sub-group which show relatively consistent behavior and these are thought of as the ‘typical’ members of the class. They are often compared to the prototypical BHXRT, A 0620–00 (see Kuulkers 1998 for a review). In such a typical outburst, the X-ray emission is usually (but not always, see Brocksopp, Bandyopadhyay, & Fender 2004) dominated by thermal emission from the hot inner accretion disk, and UV and optical emission is thought to be produced by reprocessing of X-rays by the outer disk.
A number of attempts have been made to characterize the spectral energy distributions (SEDs) of these BHXRTs in outburst. Cheng et al. (1992) and Hynes et al. (2002) attempted to use simple disk spectral models, and other authors have used a variety of black bodies and power-laws. These mostly only consider a single source at a time, use a variety of extinction curves and reddening determination methods, and do not use comparable spectral models. Consequently it is difficult to compare the data on different sources and attempt to draw broad conclusions about the population as a whole. The goal of this paper is to bring together all of the useful data on a suitable homogeneous sample of sources, with recalibrations where appropriate for the satellite data. It is then possible to deredden the spectra consistently and draw direct empirical conclusions about the observed SEDs. We can also go on to compare the complete sample with simple models in a consistent way. Finally we can hope that this compilation will provide a reference set as more sophisticated disk spectral models are developed.
| Object | Outburst peak | Adopted | Dust map | DistanceaaSources for reddening and distance estimates are discussed in the text. | |
|---|---|---|---|---|---|
| (approx.) | (hrs) | aaSources for reddening and distance estimates are discussed in the text. | bbFrom Schlegel, Finkbeiner, & Davis (1998) | (kpc) | |
| A 0620–00 = V616 Mon††footnotemark: | 1975 Aug 13 (MJD 42637) | 7.8 | 0.49 | ||
| GS 1124–684 = GU Mus††footnotemark: | 1991 Jan 15 (MJD 48271) | 10.4 | 0.37 | ||
| GRO J0422+32 = V518 Per††footnotemark: | 1992 Aug 15 (MJD 48848) | 5.1 | 0.36 | ||
| GRS 1009–45 = MM Vel | 1993 Sep 15 (MJD 49245) | 6.9 | 0.19 | ||
| GRS 1716–249 = V2293 Oph | 1993 Sep 30 (MJD 49260) | 14.7ccGRS 1716–249 does not have a confirmed period, but possible superhumps seen in outburst with a 14.7 hr period suggest that the orbital period is similar to this. | 1.08 | () | |
| XTE J1859+226 = V406 Vul††footnotemark: | 1999 Oct 16 (MJD 51467) | 9.1 | 0.49 | () |
Studies of these broad-band SEDs are important as they can inform us about the temperature structure within the binary. They are especially useful for the typical BHXRT systems considered, as these mostly have very small mass ratios, hence the emission from reprocessing on the companion star is weak, and the systems so far discovered have intermediate or low inclinations, so disk self obscuration and limb darkening should not be large effects. In these cases the comparison between observed SED and disk temperature structure should be relatively direct. One must of course assume an emergent spectrum for the disk. At present, black bodies are probably as good an approximation as any for optically thick disks in X-ray binaries, but we can anticipate models including a more rigorous treatment of the disk atmosphere in the future. The observed SED essentially can tell us the distribution of emitting area as a function of temperature. Given assumptions such as axisymmetry and a monotonic dependence of temperature on radius then one can map this area–temperature relation into the radial temperature distribution, but the more generalized statement is useful in considering more complex geometries which could be imagined, such as disks which are warped or exhibit spiral waves. In this more general case, given a three-dimensional disk geometry, a model for the irradiation geometry (e.g. an isotropically emitting point source, or perhaps a flat central disk), and some method to calculate emergent spectra (at its simplest, a black body), one can test specific models against the observed spectra, and falsify some combinations. There is certainly more than enough uncertainty about the temperature structure of irradiated disks to warrant seeking further observational constraints. For example, theoretical work suggests that disks should be self-shielding (Meyer & Meyer-Hofmeister 1982; Tuchman, Mineshige, & Wheeler 1990; Dubus et al. 1999), and hence that irradiation requires scattering of X-rays or warping of the disk (Dubus et al., 1999). These two cases may produce very different temperature structures. An understanding of irradiation geometry has immediate application in providing input to numerical models of BHXRT outbursts, as these models have to make some assumptions about the strength, and radial dependence, of X-ray heating (e.g. Kim, Wheeler, & Mineshige 1999; Esin et al. 2000; Dubus, Hameury, & Lasota 2001; Truss et al. 2002).
We begin in Section 2 by defining our sample of BHXRTs. In Section 3 we review and evaluate reddening determinations for these sources, in particular incorporating a reanalysis of 2175 Å bump data for some sources. This section also discusses the importance of the extinction curve adopted. Section 4 discusses corresponding distance estimates. We then proceed to review the database of spectra available based on satellite observations (mainly UV) in Section 5, and ground-based observations (optical) in Section 6. Having collated our sample spectra, we then compare the optical spectra in Section 7 and the broader-band optical-UV spectra in Section 8. We next take an interlude to evaluate the effect of reddening uncertainties upon the spectra in Section 9 before comparing the spectra with disk models in Section 10. In Section 11 we compare our results with other studies and with theoretical work. Finally in Section 12 we summarize our conclusions and consider where progress can most effectively be made in the future.
2. Source Selection
We restrict our sample of sources in order to obtain a relatively homogeneous set of spectra. Our selection criteria are as follows.
Firstly we consider only sources which are believed to harbor a black hole. In most cases this selection is based on a dynamical mass estimate, but where this is not available, more subjective criteria are used. Any source exhibiting type I X-ray bursts is obviously excluded.
Secondly we exclude those sources with an orbital period greater than one day. Most long period objects exhibit unusual outbursts, several have companions luminous enough to contribute even during outburst and the large disks expected in these systems may well behave rather differently to those in the short period systems.
Finally we only include high luminosity systems showing a ‘canonical’ lightcurve, i.e. one with a fast rise and quasi-exponential decay. Specifically we exclude XTE J1118+480; this seems appropriate as this source exhibited an unusually faint outburst and the optical light probably includes significant non-disk emission, likely of a synchrotron origin (e.g. Hynes et al. 2000). For the sources included, only spectra from the exponential decay phase of the lightcurve are used, i.e. we exclude mini-outburst spectra.
An additional practical criterion is of course that there must exist flux-calibrated spectra. Based on these criteria we obtain a primary sample of sources with relatively complete optical and UV coverage and a secondary sample with only optical spectra. Our primary sample includes A 0620–00, GS 1124–684, GRO J0422+32, and XTE J1859+226. Our secondary sample adds GRS 1009–45, and GRS 1716–249. We initially included GS 2000+25 in the secondary sample, as a fluxed spectrum was presented by Charles et al. (1991) and it otherwise meets our selection criteria. When we came to estimate the reddening, however, it was clear that it was too large, and too uncertain, for a meaningful derivation of the intrinsic spectral energy distribution, so we have not attempted an analysis of this spectrum. For all of the other targets selected and is relatively well determined. All of these objects also lie at least from the Galactic plane.
3. Reddening estimates
3.1. Background
Since most BHXRTs lie at significant distances, they are typically rather reddened objects, hence a reliable correction for interstellar reddening is crucial if we are to accurately reconstruct the spectral energy distribution. This correction depends upon two things: the determination of the reddening value, typically parameterized in , and an extinction curve specifying the amount of extinction as a function of wavelength. For a review of the problem see Fitzpatrick (1999).
A number of methods are available to estimate the reddening, but they vary considerably in their reliability. The most direct measures are not necessarily the best; these include the optical color (e.g. ) or emission line ratios. These do directly measure the differential extinction as a function of wavelength, but their interpretation is model dependent. Less direct methods can be more independent of assumptions about the target, but instead involve assumed properties for the line-of-sight material, for example the gas to dust ratio, the abundance of Na I, or the strength of the 2175 Å absorption feature relative to the broader structure in the extinction curve.
Several approaches also exist for choosing an extinction curve, as discussed by Hynes et al. (2002). As we typically have no independent information on the properties of the interstellar medium toward a BHXRT, we will adopt the Fitzpatrick (1999) extinction curve as this should be the ‘best’ current Galactic average curve. In analyzing our results we must then remember that our uncertainties depend not only on the uncertain amount of extinction but the uncertain shape of the extinction curve.
3.2. Methods
3.2.1 Interstellar spectral features
Our preferred method to estimate the amount of extinction is to measure the strength of the 2175 Å interstellar absorption feature. In fitting the feature we must assume some underlying spectral shape, either fixed or with some free parameters, and then adjust to fit the data. It should be borne in mind that the strength of the feature is one of the variable characteristics of the UV extinction curve; hence the correlation between the 2175 Å feature and is not perfect, and the intrinsic variance in their relative values introduces an unavoidable 20 percent error in reddenings determined in this way (Fitzpatrick, 1999). This uncertainty can only be avoided if the relative strength of the feature for the line of sight is known independently from nearby stars, which is only the case for one of our sources, A 0620–00 (Wu et al., 1983). In spite of these limitations, the method is generally more precise than the alternatives.
The equivalent width of the Na D interstellar doublet can in principle be used to estimate the reddening, and calibrations exist for this purpose. The problem is that several calibrations exist and these do not agree. Barbon et al. (1990) derive from observations of supernovae in external galaxies. Della Valle & Duerbeck (1993) on the other hand obtained by analyzing the data of Cohen (1975) on southern supergiants. Furthermore, as noted by Munari & Zwitter (1997), the Na D lines are not in general sensitive to due to saturation, so this method can underestimate the reddening; whether it does or not depends on the detailed substructure of the lines which is not usually resolved. Some caution should therefore be exercised in applying this method.
In addition to the Na D lines, relations between the equivalent widths of diffuse interstellar bands and are commonly used. Herbig (1975) performed an extensive study and tabulated relations for 17 interstellar bands in the 4400–6850 Å range. The correlation between different lines was found to be very good but there were significant regional effects.
3.2.2 X-ray absorption
Another approach taken is to adopt scaling ratios between interstellar gas and dust densities, usually expressed in a regression relation between and or . This method is plagued with uncertainty, both due to intrinsic variance in this ratio, and due to different measures of ; it may be measured directly though UV Ly absorption (e.g. Savage & Jenkins 1972; Bohlin, Savage, & Drake 1978) or indirectly through soft X-ray absorption which also includes metallic absorption (e.g. Gorenstein 1975; Predehl & Schmitt 1995); for the latter it is necessary to assume abundances. We will adopt the relation of Bohlin, Savage, & Drake (1978): cm, as this relation is relatively direct and conveniently falls intermediate between the other estimates referred to. These authors note that individual sources typically scatter by 30 percent around this line, and adopting this uncertainty encompasses the other average relationships as well. An additional concern for measurements of NH is the possible presence of local absorption intrinsic to the source. The local absorbing material will probably be too hot to include a dusty component, so will not contribute to the optical/UV absorption.
3.2.3 Outburst colors and line ratios
Some authors assume a typical intrinsic color in outburst, and hence derive a direct estimate of . For our purposes, however, this assumption is extremely dangerous; to use such estimates without independent corroboration would lead to a circular logic. We would be assuming that the intrinsic spectra of all BHXRTs are the same to determine their reddening and hence derive their intrinsic spectrum.
A direct measure of the reddening of the spectrum can alternatively be obtained from the Balmer decrement, by assuming line ratios appropriate for Case B recombination (e.g. Osterbrock 1989). This approach is obviously dependent upon the assumption that Case B line ratios are appropriate, and so is also not a very secure method.
3.2.4 Extinction maps
A final technique, of more use for extragalactic work, is to use maps of Galactic dust, for example Schlegel, Finkbeiner, & Davis (1998). The problem with applying this technique to Galactic objects is that it only yields the total amount of reddening along that line of sight, some of which may be behind the target. This technique is thus mainly useful as an upper limit, although some sources such as GRO J0422+32 are believed to lie above the dusty component of the Galactic disk. An additional concern is that these maps do not resolve fine extinction structure and so are only reliable for sources above or below the Galactic plane; Schlegel, Finkbeiner, & Davis (1998) recommend only trusting . Fortunately, the nature of our sample is such that highly reddened objects in the plane have been excluded, and all of our targets happen to lie outside of this band. We therefore apply this technique, remembering that it may include background extinction. In most cases the reddening estimated in this way is comparable to, or somewhat larger than, other methods so it does seem to be of use, at least for high latitude X-ray binaries.
3.3. Objects
3.3.1 A 0620–00
Wu et al. (1976) derived for A 0620–00 from fitting ANS UV data through 2175 Å feature. Subsequently, Wu et al. (1983) used spectra from 25 nearby early type stars to derive a line-of-sight extinction curve for A 0620–00. It was found that the 2175 Å feature was rather stronger along this line-of-sight than average, and hence they derived a revised lower estimate of . The uncertainty in this estimate will be similar to the earlier measurement; since they used a line-of-sight extinction curve there is no need to account for a 20 percent error due to uncertainty in the intrinsic 2175 Å strength. Oke & Greenstein (1977) estimated , with a large uncertainty, from the Na D lines. They note, however, that the DIBs seem unusually strong for the reddening derived. Whelan et al. (1977) collated the DIB measurements and confirmed this conclusion. They emphasize, however, that the strength of DIBs as a function of does vary with Galactic longitude, and that A 0620–00 lies within of the region where the DIBs are relatively strongest. Using appropriate relations for this longitude they derive or , depending on the relation used. The reddening derived from optical interstellar features is therefore broadly consistent with that obtained from the UV. Both are lower than the value of 0.49 derived from dust maps (Schlegel, Finkbeiner, & Davis, 1998) but A 0620–00 is the closest of our objects and background extinction is expected. We adopt the ANS value of for the remainder of this work.
3.3.2 GS 1124–684
GS 1124–684 was among the best studied in the UV with a series of IUE observations (Shrader & Gonzalez-Riestra, 1993) early in the outburst and a later, higher signal-to-noise HST one (Cheng et al., 1992). These permit fitting of the 2175 Å feature to derive . Shrader & Gonzalez-Riestra (1993) derive using this method and Cheng et al. (1992) obtain from considerably higher signal-to-noise data. Both use the Seaton (1979) extinction law. Repeating the analysis of the HST data using the Fitzpatrick (1999) extinction curve, and a more realistic estimate of the accuracy of the method, we derive from these data in Section 5.3, consistent with both of the earlier estimates. From interstellar absorption lines, Della Valle, Jarvis, & West (1991) obtain two values: 0.3 from applying the calibration of Barbon et al. (1990) to the Na D lines (with a measured equivalent width of 1.4 Å) and 0.35 using the calibration of Herbig (1975) on the 5778, 5780, 5797 Å absorption bands. These are consistent with the UV determination. The hydrogen column density has been estimated from Ginga data alone as about cm-2 (Ebisawa et al., 1994), and from Ginga and ROSAT spectra at cm-2 (Greiner et al., 1994). These imply reddenings of and 0.4 respectively, which are just about consistent with optical estimates given the uncertainty in the relation between the two. For the remainder of this work we will adopt our revised estimate based on the 2175 Å feature: . As for A 0620–00, this is slightly lower than was derived from dust maps, 0.37.
3.3.3 GRO J0422+32
The 2175 Å feature in GRO J0422+32 has been measured by Shrader et al. (1994) using IUE data. They obtain . We have repeated the analysis using a more recent extinction curve and obtain a range of values of 0.29–0.48, depending on the spectral range modeled and the underlying spectrum which is assumed (see Section 5.2). Many authors have also attempted to derive a reddening from interstellar lines. Harlaftis & Charles (1993) suggest based on 4428 Å and 6613 Å DIBs. Shrader et al. (1994) also obtain from the 5780 Å DIB. Finally Callanan et al. (1995) measure equivalent widths of Å for the Na D lines and Å for the 5780/5788/5797 Å group. Using the relations of Barbon et al. (1990) and Herbig (1975) they deduce . Chevalier & Ilovaisky (1995) examine 12 stars in the field surrounding GRO J0422+32 and find that their color-color diagram needs to be dereddened by in order to match the unreddened main sequence. This method assumes that all these stars, and GRO J0422+32, are subject to the same reddening; it would be appropriate if all are above the main plane of extinction. Even if some are not, but GRO J0422+32 is (as seems likely given the estimated distance for GRO J0422+32), then this value becomes a lower limit. Shrader et al. (1997) fit absorbed power-laws to ASCA spectra from the 1993 August mini-outburst to obtain cm-2, corresponding to . Finally, and most recently, Gelino & Harrison (2003) derive from fitting the quiescent spectral energy distribution, but this value is somewhat sensitive to assumptions about the amount and color of disk light. There is clearly little close consensus on the reddening value, and even the method which is usually most precise, fitting the 2175 Å feature, yields equivocal results. Consequently, based on the spread in measured values we adopt . This choice is rather arbitrary, but is representative of the scatter between the derived estimates. It is completely consistent with the estimate of 0.36 from dust maps.
3.3.4 GRS 1009–45
Della Valle et al. (1997) present several arguments for a low reddening in GRS 1009–45, . From the strength of Na D absorption they derive an estimate of , with an upper limit of . Assuming that the intrinsic color is similar to other LMXBs implies a consistent value of (although see caution above). We follow these authors in adopting . The column density is not well constrained, but probably cm-2 (Kubota et al., 1998), which implies , consistent with the optical estimates. Finally dust maps predict , consistent with other estimates.
3.3.5 GRS 1716–249
The reddening of GRS 1716–249 has been estimated by Della Valle, Mirabel, & Rodriguez (1994) as based on a number of arguments giving roughly consistent values. The strength of the Na D lines implies (see the note on saturation of these lines above). The strength of DIBs suggests –0.9. Arguments based on the outburst color, and the Balmer decrement give somewhat higher values, but are model dependent as discussed above. The interstellar hydrogen column density has been estimated at cm-2 (Tanaka 1993), implying –, which is consistent with the optical estimates. Finally, dust maps imply . In summary, we see no compelling reason to amend the estimate of Della Valle, Mirabel, & Rodriguez (1994), leaving this as the largest and most uncertain reddening in our sample.
3.3.6 XTE J1859+226
Hynes et al. (2002) estimated using the well defined 2175 Å interstellar feature. Wagner et al. (1999) obtained from the 5780 Å DIB. Estimates of the hydrogen column density included cm-1 (dal Fiume et al. 1999 from SAX data) and cm-2 (Markwardt 2001; RXTE). This column density corresponds to –, allowing for the uncertainty and variance in the gas-dust ratio. Even with this uncertainty, and that in the 2175 Å determination, there is then a discrepancy. In contrast, dust maps imply an even lower value, . The 2175 Å value thus represents a reasonable middle-ground, so we will use this estimate, and the derived dereddened spectra from Hynes et al. (2002).
4. Distance Estimates
The determination of distances to BHXRTs is even more problematic than their reddenings, since there are no direct measures of distance. Ideally, we would seek some kind of standard candle to determine the distance. For neutron star LMXBs, a standard candle does exist in the form of radius expansion type-I X-ray bursts. No such analog exists for black holes, and any attempt to use the outburst luminosity, as done by some authors, runs into a circular logic problem again, that we would be artificially forcing uniformity on our sample before comparing them. The only reasonably robust method that has been applied to our sample is to use the quiescent companion star. System parameters provide estimates of the companion’s temperature and radius, and hence absolute magnitude, albeit with a large uncertainty in many cases. Given the observed magnitude, estimated extinction and the fraction of quiescent light due to the disk (the veiling) we can then derive a distance. The errors are likely to be large, but are representative of the real uncertainty in knowing the distance, and other methods are likely to be even worse. The best method to assess the errors is to perform a simple simulation, constructing a population of model binaries consistent to within the observational uncertainties and derive a distance for each one, and hence a mean distance and standard deviation. This method has recently been applied to a number of our sources using IR data. This is preferable because the IR derived distance is less sensitive to uncertainty in extinction or companion temperature than the optical is. The best estimate is for A 0620–00 for which Gelino, Harrison, & Orosz (2001) derive kpc. For GS 1124–684 Gelino, Harrison, & McNamara (2001) quote kpc with no uncertainty, but this estimate was subsequently refined with simulations as above to kpc (Gelino, 2001). For GRO J0422+32 Gelino & Harrison (2003) estimate kpc and finally for GRS 1009–45 Gelino & Harrison (2002) derive kpc. Of course, these are not the only estimates for these sources. However we believe they are the most thorough and reflect the most up to date parameter estimates. These estimates are broadly consistent with previous values. Some concerns do still exist for these objects in that these estimates, and their quoted uncertainties, depend on the limits placed upon the veiling. The works cited generally assume rather small veilings in the IR, and while this assumption is widely made, its validity is questionable (Hynes, Robinson, & Bitner, 2004). The most immediate effect of increasing the veiling is to reduce the apparent brightness of the companion star, implying a larger distance. It is therefore quite possible that the distances are underestimated somewhat. For more detailed discussion of these issues see Jonker & Nelemans (2004).
For the other two of our selected sources, the information necessary to use the quiescent companion as a standard candle is simply not all available yet, so in these cases we make use of other indicators from the literature.
The distance to GRS 1716–249 is the poorest determined in our sample. Della Valle, Mirabel, & Rodriguez (1994) estimate 2 kpc from relations between Na D equivalent width and distance. Since the Na D lines could well be saturated for the relatively high extinction of this object, this distance is really only a lower limit, even assuming that the mean relation is valid along this line of sight. Based on the peak optical brightness, these authors estimate an upper limit of 2.8 kpc, but as noted above we should be cautious about using such measurements for our purposes. In this case, however, we have little other information to go on and follow Della Valle, Mirabel, & Rodriguez (1994) in adopting kpc for GRS 1716–249. The true uncertainty may well be larger, however, and the distance could be significantly greater.
The distance to XTE J1859+226 is also problematic. Zurita et al. (2002) estimated kpc from both the brightness of the outburst and that of the quiescent companion. The latter estimate was, however, based largely upon guesses for a number of binary parameters including the orbital period and companion spectral type. Filippenko & Chornock (2001) report spectroscopy indicating an orbital period longer than assumed by Zurita et al. (2002) and an earlier spectral type. Both effects will tend to make the quiescent companion more luminous and hence push the source to a larger distance. We have done a simulation similar to those discussed above to test these effects, and estimate that the quiescent brightness implies a distance of kpc assuming the constraints of Filippenko & Chornock (2001). This value depends on some uncertain or totally unknown parameters, however, such as the inclination and mass ratio. The disk veiling is also ignored and a significant disk contribution would push the distance even higher. The faintness in quiescence therefore suggests a very large distance, large enough to conflict with other estimates. Outburst X-ray observations place a likely constraint of 5–13 kpc, based on a combination of spectral and timing information (Markwardt, 2001). Fits to the optical–UV spectral energy distribution suggested 4.6–8.0 kpc (Hynes et al., 2002), assuming a plausible range of possible disk radii and inclinations. In view of the extreme uncertainty about the system parameters, in particular the companion star’s effective temperature, we believe these outburst estimates are currently more reliable, but that we have no really trustworthy distance for this object. We adopt a working estimate of kpc, which encompasses most of the parameter space proposed thus far, but note that a larger distance remains a possibility.
5. Satellite Spectra
| Object | Date | Outburst | Facility | Wavelength | PlottedaaSpectra shown in Fig. 1 or Fig. 3. Y indicates a spectrum plotted individually, A means the spectrum is inclued in an average and N that the spectrum is omitted. | ReferencebbReferences: 1. Wu et al. (1976), 2. Shrader & Gonzalez-Riestra (1993), 3. Cheng et al. (1992), 4. Shrader et al. (1994), 5. Hynes et al. (2002) |
| Day | range (Å) | |||||
| A 0620–00 | 1975 Sep 28–30 | 46–48 | ANS | 1550–3300 | Y | 1 |
| GS 1124–684 | 1991 Jan 17–21 | 2–6 | IUE | 1150–3300 | A | 2 |
| 1991 Jan 24 | 9 | IUE | 1150–3300 | A | 2 | |
| 1991 Jan 29 | 14 | IUE | 1150–3300 | N | 2 | |
| 1991 Feb 6 | 22 | IUE | 1150–3300 | A | 2 | |
| 1991 Feb 12 | 28 | IUE | 1150–3300 | A | 2 | |
| 1991 Feb 18 | 34 | IUE | 1150–3300 | A | 2 | |
| 1991 Feb 25 | 41 | IUE | 1150–3300 | A | 2 | |
| 1991 Feb 28 | 44 | IUE | 1150–3300 | A | 2 | |
| 1991 Mar 15 | 59 | IUE | 1150–3300 | N | 2 | |
| 1991 Mar 27–28 | 71–72 | IUE | 1150–3300 | N | 2 | |
| 1991 Apr 22 | 97 | IUE | 1150–3300 | N | 2 | |
| 1991 May 15 | 120 | HST/FOS | 1580–4810 | Y | 3 | |
| GRO J0422+32 | 1992 Aug 16 | 2 | IUE | 1150–3300 | A | 4 |
| 1992 Aug 20 | 6 | IUE | 1150–3300 | A | 4 | |
| 1992 Aug 26 | 10 | IUE | 1150–3300 | A | 4 | |
| 1992 Sep 2 | 19 | IUE | 1150–3300 | A | 4 | |
| 1992 Sep 10 | 27 | IUE | 1150–3300 | A | 4 | |
| 1992 Sep 20 | 37 | IUE | 1150–3300 | A | 4 | |
| 1992 Sep 27 | 44 | IUE | 1150–3300 | A | 4 | |
| XTE J1859+226 | 1999 Oct 18 | 2 | HST/STIS | 1150-10 200 | Y | 5 |
| 1999 Oct 27 | 11 | HST/STIS | 1150-10 200 | Y | 5 | |
| 1999 Nov 6 | 21 | HST/STIS | 1150-10 200 | Y | 5 | |
| 2000 Feb 8 | 115 | HST/STIS | 1150-10 200 | Y | 5 | |
| 2000 Mar 5 | 141 | HST/STIS | 1150-10 200 | Y | 5 |
5.1. ANS
A 0620–00 was observed by the Ultraviolet Experiment onboard the Astronomical Netherlands Satellite (ANS) around day 47 after X-ray peak (Wu et al., 1976); a second observation was made around day 225 (Wu et al., 1983) which we do not use as it was obtained beyond the main exponential decay phase of the outburst. (Wu et al., 1976) tabulate the data from the earlier observation. From these we constructed an average using only the six observations when the broad 1550 Å bandpass was used to minimize the impact of the possible C iv emission line.
5.2. IUE
IUE spectra were obtained for two of our sources: GS 1124–684 (Shrader & Gonzalez-Riestra, 1993) and GRO J0422+32 (Shrader et al., 1994). Both sources were observed with the low-resolution short- and long-wavelength prime cameras (SWP and LWP). We obtained all of these data from the archive, using the newsips reprocessed results (Nichols & Linsky, 1996).
For GS 1124–684, good coverage was obtained throughout the outburst, although the later data are of poorer quality. We assembled three representative average spectra. For the early outburst, we combined spectra from 1991 January 17–24; no obvious spectral differences are visible between these. We produced a second epoch spectrum from February 6–28. This corresponds to some way down the decline, but before the secondary maximum in the X-ray lightcurve. For the third sample we use a single epoch, March 27–28, within the secondary maximum, which was seen in the UV data (Shrader & Gonzalez-Riestra, 1993). At later epochs, the IUE data are of poor quality, and the HST spectrum (see next section) is of more use. We did not attempt to re-derive a reddening for GS 1124–684 from the IUE data as the HST spectrum of this source is of much higher quality.
For GRO J0422+32, the coverage was less complete; the first two months were observed regularly, but there was only one more observation about a year later. We assembled two average early spectra from 1992 August 16–26 and 1992 September 2–27 respectively. The last visit lies beyond the main exponential decay phase of the outburst. Since the reddening derived by Shrader et al. (1994) from the 2175 Å feature was inconsistent with other estimates, we combined these two spectra and reanalyzed them to attempt to resolve the discrepancy. Shrader et al. (1994) derived , but did so by assuming the entire IUE spectrum was a power-law. Consequently there is a danger that the derived reddening may be biased by a failure of the model. As for XTE J1859+226 (Hynes et al., 2002), we tried using a range of different wavelength ranges and both a power-law and irradiated disk model in order to test for such sensitivities. We do indeed find that a wide range of reddening values are derived, 0.29–0.48, dependent mainly on the choice of fitting range. As can be seen from the fit by Shrader et al. (1994), a power-law model does fail both at short and long wavelengths. We find that using the 1650–3120 Å range adopted for XTE J1859+226, significant systematic residuals are seen at the longer wavelengths. Fits with this region ( Å) included produce large values of , whereas if this region is excluded a range of 0.29–0.38 is found. The range above 2500 Å contains little if any information on the 2175 Å feature, and the discrepancy with other estimates is also largely resolved if it is excluded, so we choose to use fits without this region.
5.3. HST
HST spectra from the main part of the outburst are available for two of our sources: GS 1124–684 (Cheng et al., 1992) and XTE J1859+226 (Hynes et al., 2002).
The data on GS 1124–684 were obtained with the Faint Object Spectrograph (FOS) fairly late in the outburst, but still in the exponential decay phase. We obtained these data from the ST-ECF archive. They were recalibrated by the archive using the poa_calfos pipeline (Alexov et al., 2001) and the final reference files. As for other sources, we reanalyzed the 2175 Å feature. Cheng et al. (1992) found a good fit using a power-law model and we find the same; the irradiated disk model which worked better for XTE J1859+226 provides a very poor fit for GS 1124–684. A reddened power-law fit to the 1574–3500 Å range (chosen to exclude any weak Balmer jump contribution) gave , . The reddening estimate is not significantly different to that of Cheng et al. (1992), but the derived spectrum is somewhat bluer. This is due to the different extinction curve used; we use that of Fitzpatrick (1999), whereas Cheng et al. (1992) used the Seaton (1979) curve. The difference between these curves is shown by Fitzpatrick (1999), and the different spectral slopes derived is representative of the real uncertainty in the process (see Section 9 for more discussion of this point.) We adopt this value, with 20 percent uncertainty, as a reddening measure for GS 1124–684: . We also repeated the fit with the full dataset, 1574–4816 Å, and with all the wavelength ranges used for XTE J1859+226. In every case, we derive consistent with the range .
A full analysis of data obtained with the Space Telescope Imaging Spectrograph (STIS) of XTE J1859+226 along the lines here has already been presented by Hynes et al. (2002), we simply include selected results of that work for comparison with the other sources presented here. These spectra span the full 1150–10 300 Å range at several epochs through the outburst. These are the only data on this source included.
6. Ground-based Optical Spectra
| Object | Date | Outburst | Facility | Wavelength | PlottedaaSpectra shown in Fig. 1. Y indicates a spectrum plotted individually, A means the spectrum is inclued in an average and N that the spectrum is omitted. | ReferencebbReferences: 1. Oke & Greenstein (1977), 2. Della Valle, Jarvis, & West (1991), 3. Della Valle, Masetti, & Bianchini (1998), 4. Shrader et al. (1994), 5. Della Valle et al. (1997), 6. Della Valle, Mirabel, & Rodriguez (1994) |
| day | range used (Å) | |||||
| A 0620–00 | 1975 Sep 2–4 | 20–22 | Palomar, Hale 5 m | 3200–10 350 | Y | 1 |
| 1975 Dec 8–11 | 117–120 | Palomar, Hale 5 m | 3200–10 350 | Y | 1 | |
| GS 1124–684 | 1991 Jan 15 | 0 | ESO, NTT | 4350–7500 | Y | 2 |
| 1991 Jan 18 | 3 | ESO, 1.5 m | 3800–8600 | A | 3 | |
| 1991 Jan 19 | 4 | ESO, 1.5 m | 3800–7400 | A | 3 | |
| 1991 Jan 20 | 5 | ESO, 1.5 m | 6300–8600 | A | 3 | |
| 1991 Jan 23 | 8 | ESO, NTT | 4200–6200 | A | 3 | |
| 1991 Feb 15 | 31 | ESO, 1.5 m | 3850–7450 | Y | 3 | |
| 1991 Feb 21 | 37 | ESO, 1.5 m | 3850–9850 | N | 3 | |
| 1991 Mar 6 | 50 | ESO, NTT | 4000–8150 | Y | 3 | |
| 1991 Mar 21 | 65 | ESO, 2.2 m | 4050–9050 | N | 3 | |
| 1991 Mar 25 | 69 | ESO, NTT | 6100–8100 | N | 3 | |
| 1991 May 5 | 110 | ESO, 1.5 m | 4000–7100 | N | 3 | |
| 1991 May 19 | 124 | ESO, 3.6 m | 4200–9850 | Y | 3 | |
| GRO J0422+32 | 1992 Aug 17 | 3 | Lowell Perkins, 1.8 m | 3800–8500 | Y | 4 |
| 1992 Aug 18 | 4 | Lowell Perkins, 1.8 m | 4850–6800 | N | 4 | |
| 1992 Sep 25 | 42 | Lowell Perkins, 1.8 m | 4850–6800 | N | 4 | |
| 1992 Oct 10 | 57 | Lowell Perkins, 1.8 m | 4850–6800 | Y | 4 | |
| 1992 Nov 4 | 82 | Lowell Perkins, 1.8 m | 4850–6800 | N | 4 | |
| 1992 Dec 15 | 123 | Lowell Perkins, 1.8 m | 4850–6800 | Y | 4 | |
| 1993 Jan 21 | 160 | Lowell Perkins, 1.8 m | 4850–6800 | N | 4 | |
| 1993 Feb 11 | 181 | Lowell Perkins, 1.8 m | 4850–6800 | Y | 4 | |
| GRS 1009–45 | 1993 Nov 18 | 64 | ESO, 2.2 m | 3600–9050 | Y | 5 |
| GRS 1716–249 | 1993 Oct 5–8 | 5–8 | ESO, 1.5 m & 2.2 m 2 | 4600–6700 | Y | 6 |
6.1. A 0620–00
The highest quality calibrated spectra for A 0620–00 were presented by Oke & Greenstein (1977) who show spectrophotometry from several epochs, of which two, around 21 and 118 days after outburst peak respectively, were obtained during the exponential decay phase of the outburst. The original data are no longer available, so these two spectra were digitized from the paper and included in our sample. The first observation occurred close to the ANS UV observations. Gull et al. (1976) present two low-resolution SEDs of the optical. These are of poorer quality than those of Oke & Greenstein (1977), and are only shown with an arbitrary flux scale, so we do not include these.
6.2. GS 1124–684
A large sample of optical spectra were presented by Della Valle, Jarvis, & West (1991) and Della Valle, Masetti, & Bianchini (1998). These span days 0–124 days after outburst peak. The spectrum included in Della Valle, Jarvis, & West (1991) was digitized; those from the later paper were kindly supplied by the authors. For the latter, the reddening correction pre-applied was removed before dereddening them as described above for consistency. For further analysis, we merged the spectra from 1991 Jan 18–23. We also rejected the 1991 Mar 25 spectrum which has limited wavelength coverage, and a very different slope to all others considered, even 1991 Mar 21. Some portions at the extreme near-IR and near-UV ends of some spectra show abrupt and non-repeatable transitions and these were also excluded.
6.3. GRO J0422+32
Shrader et al. (1994) present spectra from 1992 August 16 to September 25. We include an absolutely fluxed spectrum from 1992 August 17, from this dataset, which was provided by the author. The remaining epochs were digitized from a figure also provided by the author as the original data were not available.
6.4. GRS 1009–45
GRS 1009–45 suffered both from a relatively short exponential phase of outburst, days (Bailyn & Orosz, 1995), and from a late discovery. The only spectrum from the exponential decay phase was presented by Della Valle et al. (1997), spanning 3500–9500 Å. This spectrum was digitized, placed on an absolute flux scale (assuming 1 unit erg cm-2 s-1; Della Valle, private communication), and corrected to our preferred dereddening solution.
6.5. GRS 1716–249
One flux calibrated spectrum from the exponential decay phase was presented by Della Valle, Mirabel, & Rodriguez (1994). This spectrum was digitized and corrected to our preferred reddening value and extinction curve as for other sources.
7. The optical spectra
Our combined sample of optical spectra are shown in Fig. 1. For these purposes, satellite spectra have been truncated at Hz, the approximate highest value recorded for A 0620–00 from the ground. We have excluded some spectra for which the flux calibration appears incorrect; when there are large distortions which are not present at any other epoch; and others to avoid duplication of two very similar spectra.
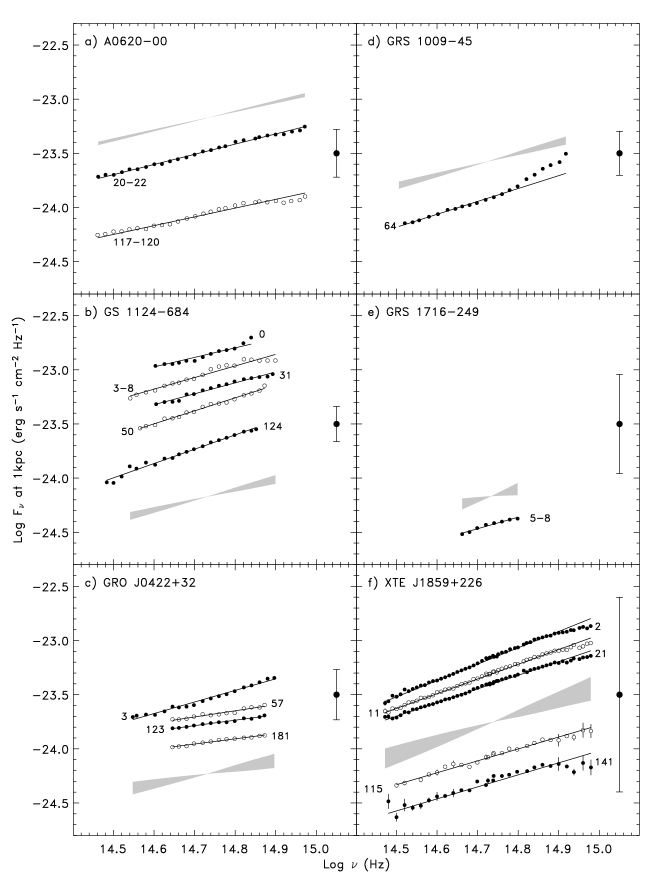
It is clear that after applying the source selection criteria described above, and subject to these additional restrictions, the spectra define a relatively homogeneous sample. All are blue, with increasing toward the UV. All have an approximately power-law form. Subject to the large uncertainties in distance described above, all represent comparable optical luminosities.
To perform a more quantitative comparison, we must parameterize and fit the spectra. At this stage we consider only very simple characterizations; we will calculate model disk spectral energy distributions in Section 10, but UV coverage is required to adequately constrain such models. The two simple characterizations widely used in the literature are a power-law or a hot black body; the latter has an approximately power-law form on the Rayleigh-Jeans tail, and so can also provide an adequate fit to the data. Given that a single temperature black body is likely a very poor description of an accretion disk, the black body fit has limited physical significance, but is useful for comparison with other work. The temperatures that we derive are somewhat lower than other authors have obtained in this way. In the case of A 0620–00 we estimate 13 000–15 000 K, compared to 25 000–30 000 K obtained by Oke & Greenstein (1977). For both GRS 1716–249 and GRS 1009–45 we estimate a temperature of K, compared to published estimates of 20 000 K (Della Valle et al., 1997) and 25 000 K (Della Valle & Duerbeck, 1993) respectively. The differences likely reflect the difficulty of reliably constraining such high temperatures using optical data alone, and in this regime large derived temperature differences can result from quite small differences in the data and its treatment (for example the wavelength range used in fitting.) In view of this difficulty, and the limited physical meaning of a single temperature fit, we ignore the results of these fits from hereon; suffice to say that the spectra indicate a hot continuum, sufficiently hot that optical observations have very limited discriminatory power alone.
| Object | Outburst | Power-lawaaDefined by . | Black body | |
| day | bbUncertainty due to uncertain . | T (K) | ||
| A 0620–00 | 20–22 | 14 700 | ||
| 117–120 | 12 900 | |||
| GS 1124–684 | 0 | 14 100 | ||
| 3–8 | 17 100 | |||
| 31 | 17 000 | |||
| 37 | 15 300 | |||
| 50 | 19 800 | |||
| 65 | 11 800 | |||
| 110 | 31 500 | |||
| 124 | 20 100 | |||
| GRO J0422+32 | 4 | 17 700 | ||
| 5 | 18 300 | |||
| 42 | 13 100 | |||
| 57 | 13 100 | |||
| 82 | 13 100 | |||
| 123 | 12 600 | |||
| 160 | 11 800 | |||
| 181 | 12 400 | |||
| GRS 1009–45 | 64 | 17 000 | ||
| GRS 1716–249 | 5 | 17 200 | ||
| XTE J1859+226 | 2 | 28 000 | ||
| 11 | 22 500 | |||
| 21 | 19 900 | |||
| 115 | 17 400 | |||
| 141 | 17 100 | |||
Power-law fits have previously been performed for some of our sources. They provide a more empirical description of the data, but one which more directly relates to its information content. For GS 1124–684 King, Harrison, & McNamara (1996) found an initially blue spectrum, (where ), which softened to after the secondary maximum. Cheng et al. (1992) also remarked that this object exhibited a period at the beginning of the outburst when the source had a steeper (bluer) spectrum than later observed. For GRO J0422+32, Shrader et al. (1994) find the optical spectral index softened from 0.6 to 0.0 over the first three months of the outburst, then stabilized. King, Harrison, & McNamara (1996) found spectral indices of between -0.1 and -0.4 for most of the outburst, although the evolution is less clear in their data and they assumed a relatively low extinction, . We fit power-laws to our optical spectra and tabulate power-law indices in Table 4. These values differ somewhat from those quoted above, as absolute values are rather sensitive to the assumed . Some spectral indices have also been plotted as a function of time in Fig. 2. All of the values that we derive fall within the approximate range , and it should be noted that all are steeper (bluer) than the canonical of a steady-state viscously heated disk which is sometimes assumed. Some variations within this range may be due to incorrect dereddening, but the full range cannot be explained in this way, and the variations between repeated observations of a single source indicate that there are real differences. There is no single ‘correct’ value, and so the utility of assuming a standard spectral slope (or photometric color) in estimating reddening values is limited. The observed variation corresponds to an intrinsic color of 0.00 to -0.24. This range is small enough that it does have some value for an approximate reddening estimate for sources with relatively large reddening, but one should still be cautious, as we have only obtained this degree of uniformity by a posteriori selection of sources by outburst behavior and orbital period. For example, the unusual source XTE J1118+480 has a somewhat flatter optical spectrum (Hynes et al., 2000) and the long-period system GRO J1655–40 is much redder in the optical (Hynes et al., 1998)

For A 0620–00 there are too few points to draw any convincing conclusions about evolution of the optical spectrum, other than that little change appears to have occurred between the two epochs. This conclusion is borne out on longer timescales by the photometry of Lloyd, Noble, & Penston (1977) who find approximately constant values around throughout the outburst, corresponding to a dereddened color of , comparable to our spectral shapes. For GS 1124–684 there are more data, but these exhibit rather large scatter. The spectra may be hardening, but it is hard to say with confidence, and the photometric analyses of King, Harrison, & McNamara (1996) and Della Valle et al. (1997) suggest the opposite behavior. GRO J0422+32 and XTE J1859+226 show more coherent trends, but this may reflect better sampling and/or data quality rather than an intrinsic difference. The latter in particular, being based solely on satellite data, should be robust. Both sources clearly become softer optically during the outburst. There appears to be rapid evolution during the first month, then slower softening (at least for GRO J0422+32) later. This evolution has already been noted by Shrader et al. (1994), although all of their power-law indices are softer than ours due to a lower assumed reddening. The photometry of King, Harrison, & McNamara (1996) may also indicate an initial rapid softening. This behavior suggests that the optically bright regions are cooling during the outburst. We will defer more detailed discussion until we consider the combined optical and UV spectra of these sources (Section 10). Although the evolution is very similar for GRO J0422+32 and XTE J1859+226, the actual values are rather different. This difference may be real, or may reflect an incorrect dereddening of the spectra. The dotted lines plotted in Fig. 2 are offset by 0.45. At late times GRO J0422+32 is about a further 0.25 below the plotted line. Uncertainty in reddening introduces an uncertainty in the spectral slope of for both sources, however, so most of the difference in the optical slopes could be due to an incorrect . We will reexamine the difference in the light of the UV spectra and models in Section 10.
We have invested some time in comparing the optical results in isolation as these are often all that is available. In addition these results can be compared directly with optical photometry which typically has better temporal sampling. Based on optical results alone, the objects appear relatively homogeneous and we cannot be confident that apparent differences are not due to incorrect dereddening. Optical colors do give some useful information about spectral evolution independent of reddening uncertainty. They do not allow us to distinguish between different models robustly however; for that we must extend the data into the UV. Based on the analysis so far, GRO J0422+32 and XTE J1859+226 exhibit definite and similar softening during the outburst, whereas A 0620–00 and GS 1124–684 exhibit no clear trends, although very little data are available for the former, and the latter exhibit large scatter.
8. Optical and UV spectra
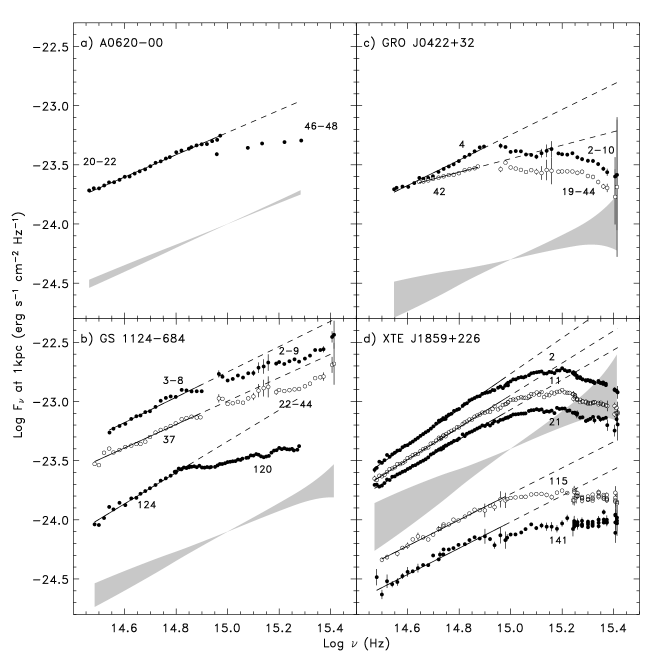
Our combined sample of broad-band spectra is shown in Fig. 3. We have selected data for which both optical and UV coverage is available. Where possible we have used contemporaneous data, but in some cases, particularly for A 0620–00, the time difference is significant.
It can be seen that the power-law fits to the optical data do not adequately extrapolate for any object. All UV spectra flatten with respect to the optical. The degree of flattening varies, with A 0620–00 and GS 1124–684 continuing to rise more slowly in the UV, while GRO J0422+32 and XTE J1859+226 actually turn over and begin to fall. One might question whether this difference is real or reflects incorrect dereddening, but since we see both forms in XTE J1859+226, it is likely a real variation within the sample. We can characterize this distinction by dividing the spectra into two optical/UV states. We refer to spectra in which the far-UV spectrum continues to rise as UV-hard, and ones in which it turns over and declines as UV-soft.
The presence of such a turnover is natural and is a consequence of the cutoff in the disk temperature distribution at the disk edge (or at a cooling front). We will discuss the interpretation of these spectra in Section 10. First, however, we examine more carefully how the spectra are affected by uncertain dereddening.
9. The impact of uncertain dereddening
9.1. Optical
The effect of uncertain dereddening is easiest to quantify in the optical, as optical extinction curves are less diverse than those in the UV, and the variation of extinction with wavelength is approximately monotonic. Uncertainty in will introduce an uncertainty in the optical spectral slope, whereas an uncertain will affect the implied luminosity level. Note that these effects are semi-independent since may not always have the Galactic average value of 3.1. To quantify the effect on the spectral slope, for each source we have shown in Fig. 1 a bow-tie indicating the power-law slopes derived if is allowed to vary within the uncertainties estimated. We have also included a corresponding estimate of the change in power-law index, , in Table 4.
9.2. UV
The effect on the UV spectrum is more complex, as the UV extinction curve exhibits several features, and the relative strength of these can vary. The effect of uncertain , assuming a fixed extinction curve, can be quantified in the same way as for the optical data, although the form is not simply a variation in power-law slope. This effect is shown by the curved bow-ties in Fig. 3. Note that there is no increase in the uncertainty around the 2175 Å bump as this region is explicitly flattened out in dereddening the spectra; a larger would only be consistent with the data if the bump were unusually weak and vice versa.
Fitzpatrick (1999) has presented a convenient parameterization of the variations in the extinction curve, and also presents a recipe for quantifying the effect of the resultant uncertainty in the derived SED. Hynes et al. (2002) have already applied this analysis for XTE J1859+226. We show comparable results for GS 1124–684 and GRO J0422+32 in Fig. 4. Note the uncertainty in the extinction curve is less of a problem for A 0620–00 for which a line-of-sight curve was determined in parallel with the reddening determination (Wu et al., 1983).

10. Disk Modeling
10.1. The basic model
We have shown that while a single power-law is an acceptable description of most optical spectra, it does not adequately describe the UV break, which seems to be ubiquitous. This break is to be expected. We believe that the spectra included in this sample should reflect the spectrum of an accretion disk in a hot state. The hot region should terminate at effective temperatures between 6 000 K and 10 000 K, as regions at this temperature should be unstable. If such a cut-off occurs, then the optical spectrum will lie on the Rayleigh-Jeans tail for most of the disk area hence exhibits a steeper (bluer) spectrum than at higher frequencies, as observed.
We can attempt to quantify the disk temperature distribution using the commonly used model for a disk heated by both viscosity and irradiation and emitting locally as a black-body. This model, its origins, and original references, are summarized by Hynes et al. (2002), and we will not repeat the discussion. An alternative discussion is provided by Chakrabarty (1998). We use that model exactly as described by Hynes et al. (2002), and with the same definitions and terminology. We emphasize that the model actually only describes a disk with two forms of heating, one of which drops off as (viscous heating) and one as approximately (irradiation heating). The exact model used (based on Vrtilek et al. 1990) assumes a slightly slower drop-off of the latter and is adopted for consistency with earlier work and as a simple empirical description, rather than as a theoretically motivated formulation (see Dubus et al. 1999). In practice the exact prescription adopted has little effect on the optical and UV spectra, and so any error introduced in this way will be less than that due to uncertainties in dereddening the spectra. The essential discriminating evidence between these two effects is the shape of the far-UV spectrum; a UV-hard spectrum which continues to rise favors heating, whereas a UV-soft spectrum with a clear peak indicates heating. Beyond the peak, the UV-soft spectrum will tend towards a spectrum or steeper, but this form will not be realized within the observable spectral range. The component, which gives rise to the classical accretion disk spectrum (Shakura & Sunyaev, 1973), is usually assumed to be due to viscous heating, but could equally describe irradiation which drops off in a similar way with radius. Indeed this functional form is commonly adopted in modeling irradiated disks in protostars (e.g. Hartmann 1998). We will return to this alternative interpretation in Section 10.5.
The analysis we will perform is virtually identical to that done by Hynes et al. (2002) for XTE J1859+226 and we will directly compare to those results without reanalyzing those data. One important difference, however, is that XTE J1859+226 is the only source for which a full UV–optical spectrum was obtained quasi-simultaneously with HST. For the other objects in our sample having UV coverage, the optical spectra were taken from the ground days or even weeks apart. The non-simultaneity compromises the reliability of the SEDs obtained, and we will discuss the severity of this problem on a case-by-case basis. In general it requires that we introduce an additional free parameter representing the difference in flux levels between the two epochs, but it should be remembered that spectral changes might have occurred as well.
It is worth emphasizing that we explicitly assume there are no other sources of flux besides the accretion disk; emission from a jet or heating of the companion star are neglected. For the sources and wavelength region adopted, this is a reasonable assumption, and was a major criteria in their selection.
| Object | Dates | (K) | (K) | Normalization | |||
|---|---|---|---|---|---|---|---|
| A 0620–00 | 20–48 | 0 | 0–6 000 | 7 400 | 7 000–7 800 | 11.35 | 9.65–13.35 |
| GS 1124–684 | 2–9 | 0 | 0–6 000 | 10 000 | 8 600–11 400 | 0.85 | 0.61–1.26 |
| GS 1124–684 | 22–44 | 0 | 0–5 000 | 7 800 | 7 000–8 600 | 0.98 | 0.75–1.31 |
| GS 1124–684 | 120-144 | 7 000 | 5 000–9 000 | 8 400 | 8 000–8 800 | 0.23 | 0.19–0.27 |
| GRO J0422+32 | 2–10 | 12 600 | 11 400–14 200 | 5 200 | 3 000–5 600 | 1.31 | 0.98–1.72 |
| GRO J0422+32 | 19–44 | 9 400 | 8 400–11 000 | 5 000 | 4 600–5 600 | 1.98 | 1.28–2.78 |
10.2. A 0620–00
A 0620–00 has a high quality optical SED, and a well determined UV extinction, so in principle it should be one of the best suited objects to our study. It suffers, however, from very crude wavelength coverage in the UV and, most severely, from the lack of simultaneous UV and optical observations. We will compare optical data taken around day 21 of the outburst with UV data from around day 47. The 26 day interval between them may mean that the spectrum has changed significantly. A particular concern is that the UV observation happened around the time of the onset of a secondary maximum in the X-ray lightcurve (e.g. Kuulkers 1998). The optical spectrum taken later, around day 118, is very similar to the early one however, suggesting that little evolution actually occurred in the optical spectrum, and that the comparison is valid.
Keeping these concerns in mind, we proceed to fit a disk model to the SED, allowing for an arbitrary offset between the optical and UV data. This approach is equivalent to assuming that the only difference between the two epochs was in the flux level of the spectrum, rather than the shape. The fits are shown in Fig. 5. The best fit model has no irradiative heating and corresponds to the classic viscously heated steady-state disk. For comparison we also show a purely irradiated model. This is an extremely poor fit, even with an arbitrary offset between the optical and UV. Improving the UV fit would require an increase in the irradiation temperature and would steepen the optical spectrum. Of course some optical spectral evolution may have occurred. The later spectrum is flatter, however, and other sources also tend to flatten as the outburst proceeds. Flattening of the optical spectrum would further degrade the irradiated fit, so it seems unlikely that the irradiated model can be accommodated in this way.

The implied parameters (for the UV epoch) are sensible. The outer edge viscous temperature, K, is comparable to that found in XTE J1859+226 late in outburst, and is close to the expected minimum temperature of the hot phase of the disk (Lasota, 2001). The normalization can be interpreted as described by Hynes et al. (2002). Assuming a distance kpc, and inclination (Gelino, Harrison, & Orosz, 2001), we estimate a disk radius cm, comparable to the expected tidal truncation radius of the disk ( cm). The implied disk radius would increase to cm when the model is normalized to fit the optical data.
We can also estimate the mass flow rate required to provide this optical luminosity as described by Hynes et al. (2002). At the UV epoch, we estimate M⊙ yr-1. Assuming an 11.0 M⊙ black hole (Gelino, Harrison, & Orosz, 2001), and 10 % accretion efficiency, the Eddington limit corresponds to M⊙ yr-1, so we obtain a mass flow rate a few tenths of the Eddington limit.
Given the uncertainties, the observations are thus consistent with a lobe-filling, viscously heated disk. Contrary to common assertions, there seems to be no need for irradiative heating to provide the energy radiated in the optical-UV. This is not to say that irradiation plays no role; it may still be crucial in stabilizing the disk against a transition to a cool state. The point is that the main source of energy emitted is consistent with viscous heating rather than irradiation.
Finally, we note that the long wavelength spectrum is flatter than the model predicts. This difference is relatively subtle, and may not be of great significance. However, a similar long-wavelength flattening is seen in XTE J1859+226 (Hynes et al., 2002) and may indicate a weak contribution from synchrotron emission (Brocksopp et al., 2002).
10.3. GS 1124–684
GS 1124–684 has better temporal coverage than A 0620–00, and generally optical observations can be selected from within the time-period spanned by multiple IUE observations. In addition, the HST spectrum obtained later in the outburst is of higher quality, albeit lacking the shortest wavelengths. Two concerns are manifest here, however. Firstly, we have already seen that the power-law slopes derived from the optical spectra scatter significantly. The most likely interpretation of this scatter would be that the flux calibration is not totally reliable. If this is correct then the spectral fits are somewhat compromised. Secondly there is a sharp upturn in the far-UV, rather similar to that seen in XTE J1859+226 when the latter was corrected with the pure Fitzpatrick (1999) extinction curve. Hynes et al. (2002) interpreted the upturn in that case as due to a far-UV rise component of extinction which is weaker than in the Fitzpatrick (1999) extinction curve. The same could be true for GS 1124–684, and similarly introduces uncertainty in the dereddened far-UV spectrum. We therefore omitted these points from the fits.

Disk model fits are shown in Fig. 6, performed as for A 0620–00. GS 1124–684 is also best fitted by a model dominated by viscous heating, exhibiting UV-hard spectra at all epochs. A model with purely irradiative heating would not fit. The disk outer edge temperature is comparable to that in A 0620–00 at late times, but higher earlier, dropping from K to K; a similar decline was found by Cheng et al. (1992). Assuming kpc and (Gelino, Harrison, & McNamara 2001; Gelino 2001) we obtain disk radii of 1.4–3.0 cm, comparable to the expected tidal truncation radius of cm. The scatter inferred in the radius may arise from the uncertainty in the optical spectral slope, since this uncertainty will affect the derived temperature, which in turn will be inversely correlated with the normalization. These data thus also appear approximately consistent with a lobe filling disk. The higher temperatures early on may indicate that the disk is indeed being tidally truncated, since the hot-phase of the disk should be able to extend to below 10 000 K if it were unbounded.
The temperatures we estimate are higher than for A 0620–00, even though the disk radius is expected to be comparable. A higher temperature implies a larger mass flow rate (if the spectrum is indeed due to viscous heating). Note that this conclusion is largely independent of distance uncertainties, provided both disks are tidally truncated. Esin et al. (2000) indirectly provide support for this conclusion. They compare the X-ray lightcurves and estimate a flux scaling factor of for the ratio of A 0620–00 to GS 1124–684. They argue that the overall flux level of the two outbursts should be the same, assuming that the Eddington scaled luminosity of the intermediate state should be constant. This is only expected, however, for extreme parameters, for example a black hole mass in A 0620–00 of just 4.5 M⊙ is assumed. If we instead adopt current best estimates of the parameters (Gelino, Harrison, & McNamara, 2001; Gelino, Harrison, & Orosz, 2001), then we instead predict a flux scaling of , if the Eddington scaled luminosities were the same. This scaling is uncertain, but significantly larger than observed, implying that A 0620–00 is underluminous relative to GS 1124–684, and hence that the accretion rate in GS 1124–684 was likely larger. Esin et al. (2000) also note that the ratio of optical to X-ray flux is a factor of 1.6 larger in A 0620–00 than in GS 1124–684, and attribute this difference to more efficient irradiation of the outer disk in A 0620–00. There is another explanation, however. Both the optical and X-ray bandpasses lie at the extreme ends of the spectral energy distribution, on the Rayleigh-Jeans and Wien tails respectively. If the mass flow rate is higher, the effect is to increase the temperature throughout the disk and shift the SED out of the optical bandpass and into the X-ray one. Such a difference is supported by the hotter optical/UV spectra inferred in GS 1124–684. This spectral shift will naturally decrease the optical to X-ray flux ratio without invoking any other changes. For example, consider two viscously heated disks around 10 M⊙ black holes, with inner and outer radii of 3 Rsch and cm respectively. We adjust the mass flow rate to give outer disk temperatures of 8 000 K and 12 000 K respectively and calculate the ratio of band to X-ray flux (1.3–7.5 keV). The ratio can change by at least a factor of two and possibly more, depending on the relative weighting across the X-ray bandpass and the effect of spectral hardening on the X-ray spectrum. This effect is more than adequate to explain the difference in the flux ratios between A 0620–00 and GS 1124–684 without any irradiation effect.
If we assume a 6.95 M⊙ black hole in GS 1124–684, then we estimate mass flow rates of M⊙ yr-1, M⊙ yr-1, and M⊙ yr-1 for epochs 1–3 respectively (comparable to that obtained by Misra (1999) assuming similar parameters). These values are superficially somewhat problematic, as the Eddington limit should be reached for M⊙ yr-1, assuming 10 % accretion efficiency. Even with higher efficiencies, the early phase of the outburst should thus have involved super-Eddington accretion. This is not a fatal problem, however, since the Eddington limit strictly only applies to spherical accretion and a geometrically thin disk could deliver mildly super-Eddington accretion rates. Such a super-Eddington model was indeed considered for GS 1124–684 by Misra (1999), and Esin et al. (2000) also assumed a peak accretion rate somewhat above the Eddington limit. A more pertinent question is whether such a large accretion rate can be reconciled with the observed thermal (disk) component in the X-ray spectrum of GS 1124–684 (Ebisawa et al., 1994). Misra (1999) did address this question in the context of their spectral modeling and show that the two are consistent provided that Compton scattering modifies the X-ray spectrum with a spectral hardening factor (Shimura & Takahara, 1995) of . This factor is larger than the value of 1.7 usually adopted, but Merloni, Fabian, & Ross (2000) argued that values as large as 3 are plausible. If one accepts this correction then both the optical/UV spectrum, and the soft X-ray thermal component can be consistently interpreted with a purely viscously heated disk. As noted above for A 0620–00, irradiation may still play a role in stabilizing the disk in the high viscosity state, but it is not required to provide the main energy input. We will consider an alternative explanation for the optical/UV spectrum in Section 10.5.
10.4. GRO J0422+32
For GRO J0422+32 we have two useful epochs with both IUE and optical data. These data may also suffer from similar problems with the far-UV rise component of extinction to GS 1124–684 and GRO J0422+32, but in the opposite sense, as there seems to be an enhanced drop off in flux at the shortest wavelengths.

Fits to these data are shown in Fig. 7. Strong irradiative heating is needed in this case, although as the outburst declines viscous heating may be becoming important as in XTE J1859+226; the timebase and data quality are inadequate to say this with any confidence, however. The irradiation temperatures inferred are lower than for XTE J1859+226, with K early in outburst, compared to K in XTE J1859+226 (Hynes et al., 2002). Lower temperatures are consistent with the softer optical spectrum earlier estimated. As seen in Fig. 3, this difference does seem to be reflected in the lower peak frequency of the SED, so is likely real. As for the other sources, we can estimate the disk radius required; assuming kpc and (Gelino & Harrison, 2003), we derived disk radii of cm and cm for the first and second epochs respectively. These numbers seem too large, as we estimate a tidal truncation radius of cm assuming the parameters of Gelino & Harrison (2003). This discrepancy could be resolved with a reduction in the source distance (which is not totally impossible; Webb et al. 2000), with a more modest increase in the temperature (which is factored into the large uncertainty in this derived radius), or if the inclination uncertainty is larger than assumed.
10.5. Indirect heating of the disk
We have seen that UV-hard spectra are ubiquitous, and can occur even when a BHXRT is at a high optical luminosity. It is common, at least in the field of X-ray binaries, to interpret such a spectrum as a signature of a viscously heated steady-state disk (e.g. Cheng et al. 1992), and thus far we have done the same. This is not implausible, particularly in the case of A 0620–00 for which the required mass flow rate is not large.
All this spectral form really indicates, however, is the temperature distribution, and that the heating rate varies as approximately . An alternative irradiation model is used by the young star community which actually predicts irradiative heating varying as (e.g. Hartmann 1998). This model addresses the case where a circumstellar disk is irradiated by the stellar surface. The key difference is that since the star is not compact, it is not a point source, but an extended one which illuminates the disk from above. Indeed a similar case which also produces heating arises from a ‘lamppost’ model, where the source of X-rays are raised above the disk (e.g. Dumont & Collin-Souffrin 1990).
As described in the appendix, one can produce UV-hard spectra with an elevated (or vertically extended) X-ray source. This behavior is generically expected, except for the specific case of a concave disk with a sufficiently compact X-ray source, possibly mediated by local scattering by an extended disk atmosphere. It is worth emphasizing that where irradiation is attributed to X-rays scattered by a central coronal source, one expects heating, in contrast to the assumption usually made in modeling outburst behavior that irradiation drops off approximately as (e.g. King & Ritter 1998, Kim, Wheeler, & Mineshige 1999, Esin et al. 2000, Dubus, Hameury, & Lasota 2001). If X-ray scattering occurs in a highly vertically extended disk atmosphere, however, heating could still be appropriate.
How plausible are these scenarios? X-ray scattering ‘coronae’ are certainly believed to be present in X-ray binaries. However, it is likely that coronae are not spherical, but very flattened, and represent a vertical extension of the disk atmosphere (e.g. Church & Bałucińska-Church 2004). Effective illumination of a convex disk, with a vertically extended central corona, thus seems difficult to achieve, and hence this seems unlikely as a mechanism for producing UV-hard spectra.
Finally, we note that X-rays from a jet might provide an alternative ‘lamppost’ illumination, either by direct synchrotron emission or by scattering. Relativistic beaming might then be expected to considerably reduce the back-illumination of the disk, but large luminosities are not required, especially as the X-ray source could then be higher above the disk than is plausible for a corona.
10.6. Heating of a warped disk
Dubus et al. (1999) suggested that warping of disks may facilitate irradiation of disks which would otherwise be self-shielded, and this could also be expected to modify the radial dependence of the heating. Ogilvie & Dubus (2001) have examined this question quantitatively. They do find strong variations in the radially averaged heating, but these are not as simple as the additional dependence that would be required to reproduce the spectra, although they do find that an average reprocessing efficiency of can readily be produced with a warped disk. While only a fraction of the disk is illuminated at any time, the effect of irradiation on the thermal structure of the disk will last for of order the local thermal timescale. This should be comparable to the local dynamical timescale (i.e. the Keplerian rotation period), so heating effects will be azimuthally averaged as material rotates through the illuminated patch and hence the whole disk will be affected (G. Dubus, priv. comm.). Further investigation of the spectral energy distributions expected in the warped disk case is needed. Ogilvie & Dubus (2001) do note, however, that the short-period BHXRTs we are considering here are expected to be stable against radiation driven warping, so in the absence of another warping mechanism, it remains questionable whether warping can be an important factor for these objects.
11. Discussion
In light of the above discussion, we should reconsider the origin of the optical emission in BHXRTs in outburst. It is sometimes stated that optical emission is always totally dominated by reprocessed X-rays. This may be true in neutron star systems, but there is good reason to expect irradiation to be weaker in the black hole case, as there is no direct emission from the compact object surface (King, Kolb, & Szuszkiewicz, 1997). This difference is invoked by these authors to explain the observations that black hole LMXBs are transient, whereas most analogous neutron star systems are persistent X-ray sources.
The studies presented here suggest that the situation may be more marginal than usually assumed. If one interprets a spectrum as a signature of a viscously heated disk, then the answer is clearly no, as this spectrum occurs rather often among the population. In the case of A 0620–00, at least, if one takes a plausible mass flow rate, and plausible disk size then viscous heating alone can readily explain the observed optical brightness. In the case of XTE J1859+226, the SED can initially be interpreted as irradiation dominated, but a transition to the viscously dominated regime appears to occur suggesting that the irradiation dominance is rather marginal. Of course this conclusion hinges upon one interpretation of the SED, but the alternatives considered are relatively unpalatable. Irradiation by X-rays from a lamppost (perhaps the jet?), or by a vertically extended corona could reproduce the observed SED, but requires an excessive luminosity for the extended source and/or a rather large vertical extent. We thus appear left with viscous heating of the outer disk as the most natural explanation of the observed optical flux during outburst, at least when UV-hard spectra are seen. As noted several times, irradiation should still play a role in maintaining the disk in a hot, high viscosity state by suppressing the disk instability, but it does not appear to dominate the energy budget.
The point is often made that studies such as this one are severely compromised by assumption of local black-body spectra. At some level, of course, this is true, but in the UV, and especially the optical, the effect is likely to be mild. The two most important effects on a optical-UV broad-band SED, for the temperatures considered, are hydrogen breaks and limb-darkening. Line-blanketing by many blended absorption lines could have some effect, although the highest quality data suggest a rather clean continuum where the effect of intrinsic (non-interstellar) absorption lines is very weak or absent, except for Ly (Haswell et al., 2002). The Balmer jump falls well within our spectral coverage. While this results in strong distortion of the SED of hot stars, such large effects are clearly not present in our data, and there is little if any evidence for its presence at all. The observations are consistent with spectral models of accretion disks around stellar mass black holes which do predict rather weak Balmer jumps (e.g. Hubeny et al. 2001; Hubeny priv. comm.) A much larger effect is predicted at the Lyman break, and has the effect of significantly enhancing the far-UV flux longward of the break. This effect produces an upturn which is principle is detectable. Such an upturn was indeed observed in XTE J1859+226 (Hynes et al., 2002), and may also be present in GS 1124–684, as shown earlier. An alternative explanation was advanced by Hynes et al. (2002), however, that this upturn originates from deviation of the far-UV rise component of extinction from the Galactic average. Disentangling the two effects is likely impossible without line-of-sight extinction curves or a larger sample of objects. Furthermore, strong Lyman breaks can also be predicted in AGN spectra, but are not observed (see Blaes et al. 2001 and references therein). The other deviation from black body spectra that could be significant is limb-darkening (Diaz, Wade, & Hubeny, 1996). This is wavelength dependent and stronger in the UV, so tends to soften the far-UV flux. It is an inclination dependent effect, however, and for the moderate inclinations of the objects considered here (40–60∘; see Section 10) should not be dominant. With both Balmer and Lyman breaks and limb-darkening, the models of Hubeny et al. (2001) do not deviate from their black-body counterparts by more than in over the optical-UV range, for inclinations of less than 60∘. In particular, a UV-hard spectrum remains UV-hard. Consequently black-body spectra do appear adequate for the analysis presented here, and it is likely that the dominant uncertainty is actually in the reddening corrections, not the local emergent spectra.
12. Conclusions
The optical and UV spectral energy distributions of BHXRTs in outburst have the potential to inform us of the temperature distribution of the outer disk, and hence test models for the heating of these disks. We have collated all the spectra published to date on short period typical systems which we believe are useful in this regard. In spite of a 25 year baseline, these data are rather limited. HST data are by far the most suitable for this work in both the UV and the optical. Ground-based optical studies suffer from uncertainties in the flux calibration, especially at short wavelengths, and from Telluric absorption at long wavelengths. Consequently even from the small sample available, only a subset are really reliable.
Even with high quality data, further complications arise from uncertainty in the line-of-sight extinction curve. If the curve is known, then the reddening can be determined to high-precision using the 2175 Å feature. Without a priori knowledge of the extinction curve, however, the relative strength of the feature is not known and the reddening cannot be precisely determined. Further difficulties arise from variations in other aspects of the UV extinction curve. The far-UV rise seems particularly variable in our sample and several of the sources considered exhibited kinks in the far-UV which could be attributed to an incorrect correction of the far-UV rise. These further compound the uncertainty in the dereddened spectral energy distributions.
In spite of these difficulties, we can draw some useful conclusions. Provided a suitable sample of typical short-period BHXRTs are selected, the optical spectra form a relatively homogeneous sample. All have quasi-power-law shapes, with spectral slopes (in vs. ) of 0.5–1.5. Where the data are good enough to discriminate, the optical spectra tend to soften as the outburst decays, corresponding to the cooling of the outer disk. The very homogeneity of the optical spectra means that they are of limited value alone in testing disk models, and they cannot discriminate between different forms of disk heating. It is also worth remarking that since the optical lies on the long wavelength tail of the spectral energy distribution the band flux is not necessarily related in a straightforward way to the irradiating luminosity and this may complicate attempts to compare optical and X-ray lightcurves; for example the optical brightness at a fixed mass flow rate, and hence the optical to X-ray flux ratio, will depend upon the size of the hot region of the disk.
To perform more useful tests requires UV data. Ideally full optical-UV coverage can be used, but the UV alone has some power to discriminate. All spectra flatten in the UV, although depending on the source and epoch this effect may be a modest reduction in slope, or a complete turnover (i.e. decreasing ). Uncertainties in dereddening the spectra complicate the interpretation of the UV slope, but in XTE J1859+226 evolution was seen from one form to the other, indicating that there are real variations. In this case, the evolution was in the opposite sense to the optical; the UV spectrum hardened during the outburst decay. These spectral shapes can be thought of as defining optical-UV spectral states in BHXRTs, analogous to X-ray spectral states. The case where the UV spectrum continues to rise can be termed the UV-hard state, and both A 0620–00 and GS 1124–684 exhibit this state. Spectra which peak and fall off in the UV can be termed UV-soft, such as those of GRO J0422+32. In this terminology, XTE J1859+226 exhibited a transition from the UV-soft to UV-hard state as it decayed.
These spectra can be interpreted in terms of simple black body disk models. The full range can be accommodated with two forms of heating, one varying as and one as . The first is readily interpreted as due to irradiation by a compact X-ray source and produces UV-soft spectra. The second is usually associated with viscous heating, but can also arise if the disk is illuminated by a vertically extended X-ray source. Evolution from the first form to the second as the disk cools results in exactly the behavior seen in XTE J1859+226 – the optical spectrum softens, but the UV hardens. None of the other sources exhibit such a clear transition, although GRO J0422+32 exhibited similar optical spectral evolution to XTE J1859+226 suggested it might have shown the same effect if suitable late-epoch data were available. A 0620–00 and GS 1124–684 suggest heating, whereas GRO J0422+32 can be interpreted as irradiated heating. It might be significant that both GRO J0422+32 and XTE J1859+226 (at least early in the outburst) were identified by Brocksopp et al. (2002) as particularly hard sources; it may be that there is a correlation between the optical-UV state (i.e. the form of heating of the outer disk) and the X-ray state. Evidence for this effect is provided by Esin et al. (2000) who argue that the transition to the low/hard state near the end of the outburst is accompanied by a substantial enhancement in the reprocessing efficiency. Obviously a larger sample is needed to robustly test these issues. Ideally we would like to see more examples of transitions in the optical-UV spectral state.
The interpretation of the UV-hard state remains uncertain. These spectra are well fitted by a viscously heated Shakura-Sunyaev disk spectrum. In the case of A 0620–00 this interpretation is quite sensible – assuming a lobe-filling disk accreting at 30 % of the Eddington rate quite naturally produces both the optical fluxes and the spectral shape without invoking reprocessing as the dominant source of optical emission. To explain GS 1124–684 in the same way, however, appears to require super-Eddington accretion (c.f. Misra 1999). Irradiation by an extended X-ray source offers a way out of this difficulty, and could bypass self-shielding of the disk (Dubus et al., 1999), but creates its own problems by requiring a very extended X-ray emission (or scattering) region.
Further progress in this area undoubtedly requires more observations of the quality of those of XTE J1859+226. Just as important, however, may be for the observations to make contact meaningfully with simulations of disk outbursts. Progress is being made (e.g. Lasota 2001) but simulations have not yet adequately accounted for disk warping, or realistic X-ray irradiation (Dubus et al., 1999); the X-ray emission geometry (compact vs. extended), and spectral changes may have a significant impact on the strength of irradiation (e.g. Esin et al. 2000).
Appendix A Irradiation from a central scattering corona
We can explore different irradiation regimes qualitatively with a simple geometric model of reprocessing, similar to that used by Dumont & Collin-Souffrin (1990) for active galactic nuclei. Consider a disk element at radius , height , and local slope . The element is illuminated by an isotropically emitting X-ray point source at height above the center of the disk. The flux incident upon the surface element depends upon both the distance from the X-ray source and the angle of incidence of the X-rays. In general,
| (A1) |
where the distance of the X-ray source from the element is in cylindrical coordinates, and the normal to the surface is . For a geometrically thin disk (), compact X-ray source (), and shallow disk gradients (), this result simplifies to:
| (A2) |
The simplest geometry is a flat disk (). In this case, ; this is the simple ‘lamppost’ case referred to above. The same would apply if the disk is not flat, but is constant, since then . Somewhat more realistic cases can be approximated with a power-law disk: , where and refer to values at the outer disk edge. In this case,
| (A3) |
is the case described above, and separates the behavior into two regimes. Firstly consider a concave disk, . If then the curvature of the disk is negligible and as for a flat disk. If then the vertical elevation of the X-ray source is negligible and we obtain the classical behavior of a concave disk illuminated by a central point source, with in the limiting case of infinitesimal curvature (i.e. ). The dividing line between the two thus depends upon both the height of the disk relative to the height of the X-ray source and the amount of curvature of the disk. For an extended X-ray source, radius , we might then expect a UV-hard spectrum (corresponding to ) if the X-ray source has size larger than .
Next consider a convex disk, . In this case one never expects heating to vary as . If then the X-ray source is below the local horizon of the surface element and no irradiation is possible. If then again disk curvature is negligible and . In the intermediate cases the radial dependence is even steeper. The caveat to this occurs if there is also local scattering material above the disk (i.e. the disk atmosphere) which can scatter irradiation over the disk horizon and illuminate regions that would otherwise be obscured. In this case, heating remains possible.
References
- Alexov et al. (2001) Alexov, A., Bristow, P., Kerber, F., & Rosa, M. 2001, ASP Conf. Ser. 238: Astronomical Data Analysis Software and Systems X, 10, 178
- Bailyn & Orosz (1995) Bailyn, C. D. & Orosz, J. A. 1995, ApJ, 440, L73
- Barbon et al. (1990) Barbon, R., Benetti, S., Rosino, L., Cappellaro, E., & Turatto, M. 1990, A&A, 237, 79
- Blaes et al. (2001) Blaes, O., Hubeny, I., Agol, E., & Krolik, J. H. 2001, ApJ, 563, 560
- Bohlin, Savage, & Drake (1978) Bohlin, R. C., Savage, B. D., & Drake, J. F. 1978, ApJ, 224, 132
- Brocksopp, Bandyopadhyay, & Fender (2004) Brocksopp, C., Bandyopadhyay, R. M., & Fender, R. P. 2004, New Astronomy, 9, 249
- Brocksopp et al. (2002) Brocksopp, C. et al. 2002, MNRAS, 331, 765
- Callanan et al. (1995) Callanan, P. J. et al. 1995, ApJ, 441, 786
- Chakrabarty (1998) Chakrabarty, D. 1998, ApJ, 492, 342
- Charles et al. (1991) Charles, P. A., Kidger, M. R., Pavlenko, E. P., Prokof’eva, V. V., & Callanan, P. J. 1991, MNRAS, 249, 567
- Cheng et al. (1992) Cheng, F. H., Horne, K., Panagia, N., Shrader, C. R., Gilmozzi, R., Paresce, F., & Lund, N. 1992, ApJ, 397, 664
- Cherepashchuk (2000) Cherepashchuk, A. M. 2000, Space Science Reviews, 93, 473
- Chevalier & Ilovaisky (1995) Chevalier, C. & Ilovaisky, S. A. 1995, A&A, 297, 103
- Church & Bałucińska-Church (2004) Church, M. J. & Bałucińska-Church, M. 2004, MNRAS, 348, 955
- Cohen (1975) Cohen, J. G. 1975, ApJ, 197, 117
- Corbel & Fender (2002) Corbel, S. & Fender, R. P. 2002, ApJ, 573, L35
- dal Fiume et al. (1999) dal Fiume, D. et al. 1999, IAU Circ., 7291
- Della Valle et al. (1997) Della Valle, M., Benetti, S., Cappellaro, E., & Wheeler, C. 1997, A&A, 318, 179
- Della Valle & Duerbeck (1993) Della Valle, M. & Duerbeck, H. W. 1993, A&A, 275, 239
- Della Valle, Jarvis, & West (1991) Della Valle, M., Jarvis, B. J., & West, R. M. 1991, A&A, 247, L33
- Della Valle, Masetti, & Bianchini (1998) Della Valle, M., Masetti, N., & Bianchini, A. 1998, A&A, 329, 606
- Della Valle, Mirabel, & Rodriguez (1994) Della Valle, M., Mirabel, I. F., & Rodriguez, L. F. 1994, A&A, 290, 803
- Diaz, Wade, & Hubeny (1996) Diaz, M. P., Wade, R. A., & Hubeny, I. 1996, ApJ, 459, 236
- Dubus, Hameury, & Lasota (2001) Dubus, G., Hameury, J.-M., & Lasota, J.-P. 2001, A&A, 373, 251
- Dubus et al. (1999) Dubus, G., Lasota, J., Hameury, J., & Charles, P. 1999, MNRAS, 303, 139
- Dumont & Collin-Souffrin (1990) Dumont, A. M. & Collin-Souffrin, S. 1990, A&A, 229, 302
- Ebisawa et al. (1994) Ebisawa, K. et al. 1994, PASJ, 46, 375
- Esin et al. (2000) Esin, A. A., Kuulkers, E., McClintock, J. E., & Narayan, R. 2000, ApJ, 532, 1069
- Filippenko & Chornock (2001) Filippenko, A. V. & Chornock, R. 2001, IAU Circ., 7644
- Fitzpatrick (1999) Fitzpatrick, E. L. 1999, PASP, 111, 63
- Frank, King, & Raine (2002) Frank, J., King, A., & Raine, D. J. 2002, Accretion Power in Astrophysics, 3rd, Cambridge University Press
- Gelino (2001) Gelino, D. M. 2001, Ph.D. Thesis, New Mexico State University
- Gelino, Harrison, & McNamara (2001) Gelino, D. M., Harrison, T. E., & McNamara, B. J. 2001a, AJ, 122, 971
- Gelino, Harrison, & Orosz (2001) Gelino, D. M., Harrison, T. E., & Orosz, J. A. 2001b, AJ, 122, 2668
- Gelino & Harrison (2002) Gelino, D. M., Harrison, T. E. 2002, BAAS, 34, 654
- Gelino & Harrison (2003) Gelino, D. M. & Harrison, T. E. 2003, ApJ, 599, 1254
- Gorenstein (1975) Gorenstein, P. 1975, ApJ, 198, 95
- Greiner et al. (1994) Greiner, J., Hasinger, G., Molendi, S., & Ebisawa, K. 1994, A&A, 285, 509
- Gull et al. (1976) Gull, T. R., Henize, K. G., York, D. G., & Snow, T. P. 1976, ApJ, 206, 260
- Harlaftis & Charles (1993) Harlaftis, E. T. & Charles, P. A. 1993, IAU Circ., 5728
- Hartmann (1998) Hartmann, L. 1998, Accretion processes in star formation, Cambridge University Press
- Haswell et al. (2002) Haswell, C. A., Hynes, R. I., King, A. R., & Schenker, K. 2002, MNRAS, 332, 928
- Herbig (1975) Herbig, G. H. 1975, ApJ, 196, 129
- Hubeny et al. (2001) Hubeny, I., Blaes, O., Krolik, J. H., Agol, E., & Lanz, T. 2001, BAAS, 34, 569
- Hynes et al. (1998) Hynes, R. I. et al. 1998, MNRAS, 300, 64
- Hynes et al. (2000) Hynes, R. I., Mauche, C. W., Haswell, C. A., Shrader, C. R., Cui, W., & Chaty, S. 2000, ApJ, 539, L37
- Hynes et al. (2002) Hynes, R. I., Haswell, C. A., Chaty, S., Shrader, C. R., & Cui, W. 2002, MNRAS, 331, 169
- Hynes, Robinson, & Bitner (2004) Hynes, R. I., Robinson, E. L., Bitner, M. 2004, ApJ, in preparation
- Jonker & Nelemans (2004) Jonker, P. G. & Nelemans, G. 2004, MNRAS, 354, 355
- Kim, Wheeler, & Mineshige (1999) Kim, S., Wheeler, J. C., & Mineshige, S. 1999, PASJ, 51, 393
- King, Harrison, & McNamara (1996) King, N. L., Harrison, T. E., & McNamara, B. J. 1996, AJ, 111, 1675
- King & Ritter (1998) King, A. R. & Ritter, H. 1998, MNRAS, 293, L42
- King, Kolb, & Szuszkiewicz (1997) King, A. R., Kolb, U., & Szuszkiewicz, E. 1997, ApJ, 488, 89
- Kubota et al. (1998) Kubota, A., Tanaka, Y., Makishima, K., Ueda, Y., Dotani, T., Inoue, H., & Yamaoka, K. 1998, PASJ, 50, 667
- Kuulkers (1998) Kuulkers, E. 1998, New Astronomy Review, 42, 1
- Lasota (2001) Lasota, J.-P. 2001, New Astronomy Review, 45, 449
- Lloyd, Noble, & Penston (1977) Lloyd, C., Noble, R., & Penston, M. V. 1977, MNRAS, 179, 675
- Markwardt (2001) Markwardt, C. 2001, Astrophysics and Space Science Supplement, 276, 209
- Merloni, Fabian, & Ross (2000) Merloni, A., Fabian, A. C., & Ross, R. R. 2000, MNRAS, 313, 193
- Meyer & Meyer-Hofmeister (1982) Meyer, F. & Meyer-Hofmeister, E. 1982, A&A, 106, 34
- Misra (1999) Misra, R. 1999, ApJ, 512, 340
- Munari & Zwitter (1997) Munari, U. & Zwitter, T. 1997, A&A, 318, 269
- Nichols & Linsky (1996) Nichols, J. S. & Linsky, J. L. 1996, AJ, 111, 517
- Ogilvie & Dubus (2001) Ogilvie, G. I. & Dubus, G. 2001, MNRAS, 320, 485
- Oke & Greenstein (1977) Oke, J. B. & Greenstein, J. L. 1977, ApJ, 211, 872
- Osterbrock (1989) Osterbrock, D. E. 1989, Astrophysics of Gaseous Nebulae and Active Galactic Nuclei, University Science Books
- Predehl & Schmitt (1995) Predehl, P. & Schmitt, J. H. M. M. 1995, A&A, 293, 889
- Savage & Jenkins (1972) Savage, B. D. & Jenkins, E. P. 1972, ApJ, 172, 491
- Schlegel, Finkbeiner, & Davis (1998) Schlegel, D. J., Finkbeiner, D. P., & Davis, M. 1998, ApJ, 500, 525
- Seaton (1979) Seaton, M. J. 1979, MNRAS, 187, 73P
- Shakura & Sunyaev (1973) Shakura, N. I. & Sunyaev, R. A. 1973, A&A, 24, 337
- Shimura & Takahara (1995) Shimura, T. & Takahara, F. 1995, ApJ, 445, 780
- Shrader & Gonzalez-Riestra (1993) Shrader, C. R. & Gonzalez-Riestra, R. 1993, A&A, 276, 373
- Shrader et al. (1997) Shrader, C. R., Wagner, R. M., Charles, P. A., Harlaftis, E. T., & Naylor, T. 1997, ApJ, 487, 858
- Shrader et al. (1994) Shrader, C. R., Wagner, R. M., Hjellming, R. M., Han, X. H., & Starrfield, S. G. 1994, ApJ, 434, 698
- Tanaka (1993) Tanaka, Y. 1993, IAU Circ., 5877
- Tanaka & Shibazaki (1996) Tanaka, Y. & Shibazaki, N. 1996, ARA&A, 34, 607
- Truss et al. (2002) Truss, M. R., Wynn, G. A., Murray, J. R., & King, A. R. 2002, MNRAS, 337, 1329
- Tuchman, Mineshige, & Wheeler (1990) Tuchman, Y., Mineshige, S., & Wheeler, J. C. 1990, ApJ, 359, 164
- van Paradijs & McClintock (1994) van Paradijs, J. & McClintock, J. E. 1994, A&A, 290, 133
- Vrtilek et al. (1990) Vrtilek, S. D., Raymond, J. C., Garcia, M. R., Verbunt, F., Hasinger, G., & Kurster, M. 1990, A&A, 235, 162
- Wagner et al. (1999) Wagner, R. M., Smith, P. S., Schmidt, G. D., & Shrader, C. R. 1999, IAU Circ., 7279
- Warner (1995) Warner, B. 1995, Cataclysmic Variable Stars, Cambridge University Press
- Webb et al. (2000) Webb, N. A., Naylor, T., Ioannou, Z., Charles, P. A., & Shahbaz, T. 2000, MNRAS, 317, 528
- Whelan et al. (1977) Whelan, J. A. J. et al. 1977, MNRAS, 180, 657
- Wu et al. (1976) Wu, C.-C., Aalders, J. W. G., van Duinen, R. J., Kester, D., & Wesselius, P. R. 1976, A&A, 50, 445
- Wu et al. (1983) Wu, C.-C., Panek, R. J., Holm, A. V., Schmitz, M., & Swank, J. H. 1983, PASP, 95, 391
- Zurita et al. (2002) Zurita, C. et al. 2002, MNRAS, 334, 999