XMM-Newton EPIC observations of the ultraluminous X-ray source NGC 5204 X-1
Abstract
We present the results of two XMM-Newton observations of the ultraluminous X-ray source (ULX) NGC 5204 X-1. The EPIC spectra are well-fit by the standard spectral model of a black-hole X-ray binary, comprising a soft multi-colour disc blackbody component plus a harder power-law continuum. The cool ( keV) inner-disc temperature required by this model favours the presence of an intermediate-mass black hole (IMBH) in this system, though we highlight a possible anomaly in the slope of the power-law continuum in such fits. We discuss the interpretation of this and other, non-standard spectral modelling of the data.
keywords:
X-rays: galaxies - X-rays: binaries - Black hole physics1 Introduction
Ultraluminous X-ray sources (ULXs) are luminous (LX), extra-nuclear X-ray sources in nearby galaxies. Their nature has been the subject of much recent debate (see Miller & Colbert 2004 for a review). In brief, the extreme X-ray luminosities of many ULXs cannot be explained by stellar-mass black holes radiating isotropically at (or close to) their Eddington limit, leading to the suggestion that ULXs harbour a new M⊙ “intermediate-mass” class of black holes (IMBHs; Colbert & Mushotzky 1999). This hypothesis has gained strength from the recent detection of the soft X-ray emission characteristic of “cool” accretion discs, the signature of accretion onto an IMBH, in the X-ray spectra of several ULXs (e.g. Miller et al. 2003; Miller, Fabian & Miller 2004). However, there is strong circumstantial evidence - in particular the association of large populations of ULXs with very active star formation - that suggests that many ULXs may instead be a type of stellar-mass X-ray binary that somehow exceeds its Eddington limit (King 2004). Models for achieving super-Eddington luminosities from these systems include the “slim” disc model (e.g. Ebisawa et el. 2003), radiation-presure dominated discs (Begelman 2002), mildly-anisotropic radiation patterns from sources emitting at or below the Eddington limit (King et al. 2001) and relativistic beaming (Körding, Falcke & Markoff 2002).
The best testing grounds for our models of ULXs are the nearest and brightest examples of this class of object. One such source is NGC 5204 X-1. It has a typical X-ray luminosity of the order (0.5 – 8 keV), and is located arcsec from the center of a nearby ( Mpc) Magellanic-type galaxy (Roberts & Warwick 2000). It is most notable for possessing a stellar optical counterpart identified from its accurate Chandra position (Roberts et al. 2001), which HST observations resolved into two sources plus a third candidate counterpart (Goad et al. 2002). Further HST UV spectroscopy has now identified HST-3 as the ULX counterpart. Its spectral type is similar to a B0 Ib supergiant, but with peculiarities consistent with some Galactic X-ray binaries (Liu, Bregman & Seitzer 2004). Chandra showed its X-ray spectrum to be a steep power-law continuum (with ), and confirmed that it has been persistently X-ray luminous for 20 years, with flux variations of no more than a factor (Roberts et al. 2004). The B0 Ib counterpart confirms that this ULX is a high-mass X-ray binary, though there are currently no constraints upon the mass of the putative black hole in this system. We present new observations by the XMM-Newton observatory (Jansen et al. 2001), that provide the most detailed view of the X-ray spectrum of this ULX, and hence the best constraints upon the accretor, to date.
2 The data
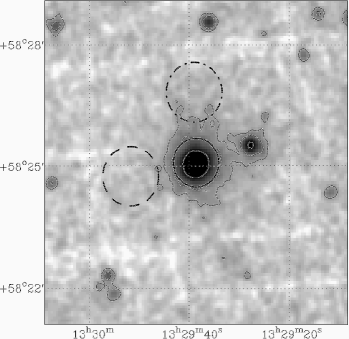
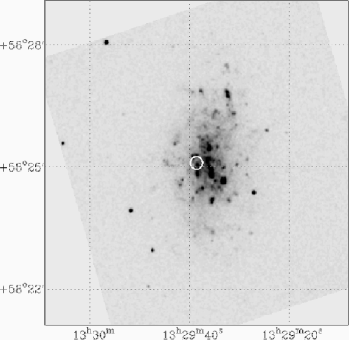
The new XMM-Newton data were obtained in two observations separated by a gap of 109 days. We present details of the observations in Table 1. All three EPIC detectors were operated in full frame imaging mode with the medium filter in place. Data for the analysis were extracted from the pipeline product event lists using the appropriate XMM-Newton SAS v.5.4.1 tools. The pn data were filtered to leave only events with flag = 0 and pattern ; MOS data were filtered for pattern and the “xmmea_em” flag. We initially created images from these events in the 0.3 – 10 keV range, and checked the background for flaring by producing a light curve from the whole detector excluding the target source. The background count rate in the first observation was consistently low ( in the pn detector), so no time filters were applied. However, the second observation was heavily contaminated by background flaring, so time intervals during which the background rate in the pn exceeded 30 (in 100 s bins) were excluded. This resulted in the loss of of the data. The remaining exposure times (as listed in the GTI file extensions for the on-axis CCDs, which are also corrected for telemetry drop-outs) are given in Table 1. The filtered and co-added 0.3 – 10 keV images are displayed in Figure 1. Contemporaneous OM data (in the UVW1, UVM2 and UVW2 filters) were also obtained. The UVW1 image of NGC 5204 is displayed in Figure 1 for comparison with the EPIC image (although we defer a full analysis of the OM data to a later work).
| Observation ID | Date | Useful exposure (s) | |
|---|---|---|---|
| (yyyy-mm-dd) | pn | MOS | |
| 0142770101 | 2003-01-06 | 17047 | 18665 |
| 0142770301 | 2003-04-25 | 8609 | 8645 |
NGC 5204 X-1 was detected at its expected position ( (J2000); see e.g. Roberts et al. 2004). Source spectra and lightcurves were extracted in a 9-pixel ( arcsec) radius circle centred on the source, chosen to sit inside the chip gaps close to the pn aimpoint. An 11-pixel radius region centred arcmin from NGC 5204 X-1, on the same pn chip and at approximately the same distance from the readout nodes, was used to produce background data (see Figure 1). The spectral products, including RMF and ARF matrices (which contain the appropriate corrections for the source extraction region size), were created using the ESPECGET tool, and the source spectra were binned to a minimum of 20 counts per bin before analysis in XSPEC v11.3.
3 Results
Before embarking upon a detailed analysis of the source properties, it is worth clarifying whether the source signal is contaminated by other X-ray emitters within NGC 5204. In particular, Chandra observations of NGC 5204 X-1 highlight a second point-like source located arcsec to the south-east of NGC 5204 X-1 (Roberts et al. 2001; Roberts et al. 2004), well within the data extraction region used in this analysis. If this source maintains its historical flux level with respect to NGC 5204 X-1, where its Chandra count rate was typically of that of the ULX, it will not significantly contaminate the data. We checked whether this is true by extracting the radial profile of NGC 5204 X-1 from the combined EPIC image. If the fainter source had brightened considerably then, since it is located arcsec from X-1, it should be marginally resolved in the data and would cause an excess above the expected XMM-Newton point spread function (PSF) in one or more radial bins. However, the off-peak drop-off in the PSF was smooth, implying that contamination from the fainter source is not a strong effect. We also note that the apparently extended emission outside the source extraction region (c.f. Figure 1) can adequately be explained by the of the source flux in the wings of the PSF that falls outside the extraction region111The apparent north-south structure in Figure 1, mirroring the morphology of the galaxy, may in part be due to the presence of pn chip gaps. However, some of the extension on the periphery of the contour may be due to real faint X-ray emitters in NGC 5204.. Hence there is no evidence for any strong contamination of the NGC 5204 X-1 signal from other X-ray sources in NGC 5204.
We tested for temporal variability from NGC 5204 X-1 by extracting light curves from both sets of data. The mean 0.3 – 10 keV count rate from the combined EPIC detectors rose by between the two observations (from 0.86 to 1.15 ), extending the historical pattern of low-amplitude long-term variability from this ULX (c.f. Roberts et al. 2004, Figure 7). Using the spectral models discussed below gives 0.5 – 2 keV fluxes of and , which sit within the previously-observed flux range. However, neither observation showed strong evidence for short-term variability. For example, extracting a power density spectrum in the full 0.3 – 10 keV band from the longer first observation reveals only a slight excess of power above the poisson noise level at low frequencies ( Hz). Binning the data to 100-s intervals allowed this variability to be detected as excess variance, albeit at a very low amplitude ( of the total signal). The second observation showed no similar variability, with a 95% upper-limit to its excess variance (on the same timescale) of of the total signal. The following analysis therefore focuses solely on the time-averaged spectrum extracted from each observation.
| Model parameter | 2003 January 6 | 2003 April 25 |
|---|---|---|
| Model 1: WA * PO a | ||
| b | ||
| c | ||
| dof | ||
| Model 2: WA * BMC | ||
| 0 f | ||
| d | ||
| e | ||
| log () g | ||
| c | ||
| dof | ||
| Model 3: WA * (DISKBB + PO) | ||
| h | ||
| c | ||
| dof | ||
| Model 4: WA * (PO + DISKBB) | ||
| dof | ||
| i | ||
| j | ||
Notes: a Models are abbreviated to XSPEC syntax. The components are: WA - cold absorption; PO - power-law continuum; BMC - bulk motion Comptonization spectrum (see text); DISKBB - MCDBB. b Absorption column external to our Galaxy in units of . A Galactic absorption column of is assumed (see text). c XSPEC model normalisations. d Disc colour temperature in units of keV. e Power-law spectral index. f Value fixed at that shown. g Illumination parameter (see e.g. Borozdin et al. 1999). h Inner disc temperature in keV. i Flux from Model 4 (which agrees with Models 2 and 3 to ), in units of (0.3 – 10 keV). j Derived X-ray luminosity, in , for a distance of 4.8 Mpc.
The spectra from all three EPIC detectors were fit concurrently in the 0.3 – 10 keV range. We allowed for differences between the detectors by including a constant multiplicative factor in each model, that was fixed at unity for the pn data and allowed to vary for the two MOS detectors. Typical values obtained were 0.88/0.86 and 0.93/0.88 in the first/second observations for MOS1 and MOS2 respectively, implying a disagreement of in the absolute flux measurements from the instruments (we quote an average of the three measurements where we give fluxes). We applied a fixed column of to each spectral model to represent the foreground column through our galaxy (interpolated from Stark et al. 1992), plus a second absorption component left free to fit the data, which represents additional absorption within NGC 5204 and/or intrinsic to the ULX.
The spectra appeared relatively smooth and featureless, hence we began by fitting a number of simple continuum models to the data. First we tried a power-law continuum model; this gave reasonable fits, with and in the first and second observations respectively. The details of these fits are given in Table 2 (Model 1). We note that the overall spectrum of NGC 5204 X-1 appears to have hardened substantially in the two years between the Chandra and XMM-Newton observations, from to (cf. Roberts et al. 2004). However, Figure 2 demonstrates that the same substantial systematic residuals to the power-law fit were present in both XMM-Newton observations, implying that more complex models are required to fit the data. In particular the spectral shape is inconsistent with any single component model with a convex continuum form, such as a classical blackbody, a thermal bremsstrahlung model, or the “multi-colour disc blackbody” spectrum used to represent the optically-thick thermal emission from an accretion disc (hereafter MCDBB; see e.g. Mitsuda et al. 1984). As expected the spectral fits of these “single component” models were rejected at a high statistical significance in both sets of data ( for the blackbody and MCDBB, and for the thermal bremsstrahlung model).


We next considered models previously employed to explain the spectra of ULXs. A broken power-law continuum fit (e.g. Kaaret et al. 2003) could represent X-ray emission produced in the Compton-scattering of photons from the accretion disc and/or the companion star by a relativistic jet (c.f. Georganopoulos, Aharonian & Kirk 2002). However, we ruled this model out as it predicts a spectral downturn at low energies (i.e. ), whereas both our spectra show an upturn at keV (c.f. Figure 2). A second possible model was a Comptonized disc model. Kubota, Done & Makishima (2003) suggest that ULXs with a power-law-like X-ray spectrum are actually in a state analogous to the very high state of Galactic black hole binaries, where their emission is dominated by a strongly-Comptonized accretion disc. We first approximated this spectrum using the “COMPTT” model of Titarchuk (1994) in XSPEC, and found better fits than the power-law continuum model in both cases (). However, the absence of data above 10 keV leaves the parameters of this model poorly constrained - reasonable values (including a cool 130 – 140 eV seed photon temperature) were only obtained after fixing the electron temperature of the scattering medium at 50 keV. As a second approximation of a Comptonized disc spectrum we used the bulk motion Comptonization model (“BMC”, see Schrader & Titarchuk 1999 and references therein), which has the twin advantages that it does not require hard ( keV) X-ray data to constrain its fitting, and it provides an estimate of the inner accretion disc temperature. This model again provides a very good fit to each dataset (Model 2 in Table 2). Most importantly, it suggests that a “cool” accretion disc, with a temperature of eV, underlies the spectrum of NGC 5204 X-1. This is consistent with the presence of an accreting IMBH.
To confirm this result, and place it in the context of other recent ULX observations, we then fit the data with a combined MCDBB + power-law model. This empirically describes the spectra of black hole X-ray binaries (BHBs; cf. McClintock & Remillard 2004; hereafter MR04), and has been used to demonstrate evidence for cool accretion discs in ULXs (e.g. Miller et al. 2003)222This description is in essence a simplified version of the BMC model, in that it employs the same spectral components, but it does not treat their relative fluxes in a physically self-consistent manner, or truncate the power-law continuum at low energies.. We find, as expected given the Comptonization fits, that the data are very well fit by this “standard” model, displaying a cool ( keV) MCDBB component plus a hard power-law continuum. The best-fit parameters are listed in Table 2 as Model 3. In each observation the detection of the “cool” disc component is apparently very robust, with F-test significances of and respectively when compared to the simple power-law continuum fit.
Stobbart et al. (2004) have recently demonstrated that a variant of the standard model provides the best empirical description of the spectrum and spectral changes exhibited by a marginal (L) ULX in the very nearby galaxy NGC 55. In their analysis, the ULX spectrum changes over the course of two contiguous 30-ks observations, initially having a soft power-law continuum form (). As the observation progressed a second, curved continuum spectral component was required to model an increase in the flux predominantly above 1 keV, that was well-fitted by a keV MCDBB spectrum. Whilst utilising the same pair of components as in the standard description, this particular model is distinguished by the power-law continuum dominating at low energies, the reverse of the usual prescription. [A caveat, of course, is that this strictly applies only to observations carried out in the limited 0.3 – 10 keV bandpass of XMM-Newton.] This “non-standard” spectral model was also independently established to provide a good fit for the nearest persistent extra-galactic ULX, M33 X-8, with and keV, by Foschini et al. (2004). The NGC 55 and M33 X-8 ULXs have L and, therefore, are both at the low-luminosity end of the ULX regime. The question of whether the non-standard model provides at least an empirical representation of the spectra of more luminous ULXs therefore merits some consideration. On this basis we have attempted to fit the non-standard model to the current data. In fact an acceptable fit to the data from both epochs was obtained by this approach (Model 4 in Table 2). We explicitly demonstrate that the data allows two minima - corresponding to Models 3 & 4 - by plotting the minima in confidence space in Figure 3.
In Figure 4 we show the data and best-fit model (Model 4) for the first observation (the fit quality in the second observation is consistent with that shown), and include a direct comparison of the underlying forms of Models 3 & 4. The composite spectrum is almost identical in the two cases, with the largest divergence evident at high energies ( keV), where Model 4 shows a spectral downturn due to the distinct curvature in the dominant MCDBB component. We have further investigated whether the data best supports Model 3 or Model 4 by explictly searching for evidence of this high-energy break in the spectral data. We restricted our analysis to the data points above 2 keV, and modelled the spectra using both single and broken power-law continua. We find that a broken power-law is not required by the second (April 25) dataset, which is very well-modelled above 2 keV by a power-law continuum (/dof = 84.9/83), consistent with Model 3. However, whilst the first (January 6) dataset is also well-fitted by a power-law continuum above 2 keV (/dof = 137.4/136), we find that the fit is improved at the confidence level (according to the F-statistic, i.e. for two additional degrees of freedom) by a broken power-law fit with , E keV, and . Hence the first observation shows marginal evidence for the presence of a spectral downturn at 5 keV, which (in combination with the slightly better fit to the full spectrum) favours Model 4 as the best description of its spectral shape.


4 Discussion
4.1 IMBH models
Both the Comptonization models and the accepted empirical model for BHB spectra point towards the presence of a cool accretion disc signature in the X-ray spectrum of NGC 5204 X-1. As discussed by previous authors (e.g. Miller et al. 2003), this suggests that an IMBH is present in this system. Indeed, using equations (5) and (8) of Makishima et al. (2000), the best-fit MCDBB parameters translate into masses of and M⊙ (where is the inclination of the accretion disc with respect to the observer) for the first and second observations respectively. Clearly this places the accreting object well into the IMBH regime333In this calculation we assume in equation (8) of Makishima et al. (2000), i.e. the Schwartzschild metric. A Kerr metric would imply hence a larger black hole mass..
The optical counterpart of NGC 5204 X-1 (HST-3 of Goad et al. 2002) lies in close proximity to a probable young stellar cluster, HST-1. Liu et al. (2004) resolve HST-1 into a point-like red component (a possible young cluster of a few thousand stars) and a more diffuse blue component, probably an OB-association. This proximity is potentially important given recent results suggesting that IMBHs can be formed by runaway stellar collisions in young, dense stellar clusters (Portegies-Zwart et al. 2004 and references therein). The projected separation of HST-3 from HST-1 is only pc; if the ULX originated in the cluster, this distance must have been traversed in less than the year lifetime of the B0 Ib secondary. This is possible with a transverse velocity as small as for the ULX relative to the stellar cluster. If we consider that stellar-mass black holes in our Galaxy are seen with spatial velocities, presumably imparted by a kick at the time of the black hole formation, of the order , then the minimum velocity requirement appears entirely plausible for an ULX harbouring a M⊙ IMBH, formed in, and subsequently kicked-out of the cluster (cf. Zezas et al. 2002 for similar calculations for ULXs in the Antennae).
However, there is an anomaly in the parameterization of spectral Model 3, from which the IMBH result is derived. The detection of an IMBH is based on a reasonable extrapolation of stellar-mass black hole properties, as represented by the empirical MCDBB + power-law spectral model, to the IMBH regime, with the “cool” accretion disc signature the key evidence for an IMBH. Because of the extreme luminosities of ULXs it is generally assumed that the accretion disc is in a “high” state, where it extends to the innermost circular orbit around the black hole. This must correspond to the classic “high/soft” state in a stellar-mass BHB (also known as the “thermal dominated” state, cf. MR04). However, in BHBs the MCDBB in this state is typically accompanied by a power-law component with a measured photon index . This is also true for the “very high” (steep power-law) state. In fact, such steep slopes are theoretically expected from Comptonized accretion disc spectra of sources close to the Eddington limit (Chakrabarti & Titarchuk 1995). Assuming that the XMM-Newton passband allows a reasonable measurement of the power-law slope, then such steep slopes are not present in our data when parameterized by Model 3. This anomaly is actually seen in several ULXs with inferred soft accretion discs (e.g. Miller et al. 2003; Miller, Fabian & Miller 2004), though not all of them (cf. Soria et al. 2004; Dewangen et al. 2004). The anomalous power-law slopes derived for ULXs with the IMBH model are generally , which is actually more consistent with the “low/hard” state in BHBs.
So could some ULXs instead be low/hard state sources? This state generally shows much cooler accretion disc temperatures than the high/soft state in BHBs (possibly due to the truncation of the inner edge of the accretion disc at large radii from the black hole; MR04), with observed values of similar to the temperatures derived in the IMBH model. Hence a low temperature disc is not necessarily an unambiguous indicator of the presence of an IMBH. [We note that an IMBH in the low/hard state would, by extended analogy, have an even cooler disc than that observed (s of eV).] However, the luminosities associated with the low/hard state in BHBs are generally very low by comparison to ULXs (LX ). This characteristic lack of X-ray luminosity appears to rule out stellar-mass black holes in the low/hard state as candidates to explain the power-law slope of Model 3. It seems therefore that the classic BHB states may not always be exact analogies of ULX behaviour, which could be problematic for the IMBH interpretation.
4.2 “Non-standard” models
An alternative description of the X-ray spectrum of NGC 5204 X-1 is provided by Model 4, which as previously stated has been shown to provide the best-fit model to high-quality XMM-Newton spectra in two ULXs (Stobbart et al. 2004; Foschini et al. 2004). In this description, both the inner-disc temperature and power-law slope are well within the range of known behaviour for the high/soft and very high states in Galactic stellar-mass BHBs ( keV; )444Indeed, the derived values in observation 1 are extraordinarily close to the keV, fit quoted for GRS 1915+105 in its high/soft state by MR04.. Whilst the inferred disc temperatures for NGC 5204 X-1 in this model do appear high for a stellar-mass system, similar temperatures have been observed from BHBs in the high/soft and very high states (MR04) and, interestingly, a high disc temperature is consistent with the “slim disc” regime for near- and slightly super-Eddington accretion (Watarai, Mizuno & Minishige 2001; Ebisawa et al. 2003). A stellar-mass system is also not ruled out from the proximity of the ULX to a possible young stellar cluster. Indeed, a very plausible scenario is that the ULX is simply a high-mass X-ray binary recently formed within, and kicked-out of, the OB-association.
However, there are physical problems with the non-standard model. The MCDBB normalisation translates into inner disc radii () of and km. These are very problematic as they are somewhat smaller than the 30 km Schwarzschild radius of a 10-M⊙ black hole. However, comparable discrepancies are also seen in some Galactic systems. For example, Ueda et al. (2002) use ASCA data to measure km for two observations of GRS 1915+105, a black hole that has a dynamically-determined mass of M⊙ (Greiner, Cuby & McCaughrean 2001). Again, apparently small inner-disc radii are also a prediction of the slim disc model (Watarai, Mizuno & Minishige 2001). We also note the apparent small inner-disc radius in NGC 5204 X-1 could in part be explained by an inclination which will serve to increase . The masses derived from the MCDBB model normalization are within the stellar-mass black hole regime, at and M⊙ for the two observations. This suggests that NGC 5204 X-1 could contain a stellar-mass black hole. For a M⊙ black hole, this would require a radiation rate at times the Eddington luminosity. We note this is well within the predictions of Begelman (2002) and King et al. (2001) for truly super-Eddington/apparently super-Eddington accretion discs, and such luminosities have been observed (albeit briefly) from Galactic stellar-mass systems (MR04).
The most severe problem with the non-standard spectral description is the domination of the power-law continuum at low energies. This spectral form has not (to the best of our knowledge) previously been observed for any Galactic BHB. Furthermore, it is physically inconsistent with the standard accretion disc plus Comptonized-corona model for BHBs, as one would not expect to see the power-law continuum extend below the peak emissivity of the MCDBB component, due to a lack of seed photons available to be Compton-scattered. It is very unlikely that the corona is simply seeing an alternate source of seed photons; for instance it would require a radically different disc emission profile for these photons to originate in the cool outer regions of the accretion disc. It is also very unlikely that the secondary star could seed this component; assuming equal primary and secondary masses of M⊙, with the B0 Ib secondary overflowing its Roche lobe (cf. Liu et al. 2004), and a corona extending out to 100 Schwarzschild radii, then the coronal region intercepts less than one in a million photons emitted by the star. As the power-law component emits photon s-1 above 0.3 keV (after correcting for absorption) this requires implausibly high stellar fluxes.
So can the dominant soft power-law continuum instead be explained by an alternative physical process? Foschini et al. (2004) discuss two possibilities for M33 X-8; mildly-relativistic jets, and an outflowing wind. A mildly-relativistic jet is certainly a possibility in M33 X-8 due to the detection of a radio counterpart. However, Galactic black holes tend to display spectrally-hard power-law continua () during episodes of radio jet emission, predominantly when in the low/hard spectral state (though jets can also be seen from very high state sources, e.g. GRS 1915+105; Reig, Belloni & van der Klis 2003). Such a hard power-law continuum is inconsistent with the X-ray spectral forms seen in these ULXs. The alternative, an outflowing wind, may be likely if ULXs are powered by accretion from a high-mass star onto a stellar-mass black hole. For instance, Podsiadlowski, Rappaport & Han (2003) demonstrate that the rate of matter transfer from the star could potentially be far higher than that required to reach the Eddington limit in these systems. Presumably this excess material must either be accreted onto the black hole in a radiatively-inefficient manner, or more likely discharged from the system in an outflow (see Begelman 2002, King 2002). This scenario may be particularly appropriate for NGC 5204 X-1, which possesses a B0 Ib star companion (Liu et al. 2004). However, whilst such a wind could emit a soft X-ray spectrum (e.g. King & Pounds 2003), it should have a thermal blackbody spectrum. Hence this also appears to be unable to provide an origin for the dominant soft power-law.
The lack of an obvious explanation for the origin of the soft power-law continuum seems to provide insurmountable physical problems for this model. However, given that it provides a clear description of the shape of the X-ray spectra of M33 X-8 and the NGC 55 ULX (and is marginally preferred in the first observation of NGC 5204 X-1), Model 4 must demonstrate at least subtle differences to, or perhaps greater complexity than, the physical processes underlying in the standard accretion disc plus optically-thin corona model. We speculate that one physical picture that may explain this distinct spectral shape is presented by Zhang et al. (2000). They describe accretion discs around stellar-mass black holes by a three-layer model roughly analogous to the Solar corona, composed of a cold (0.2 - 0.5 keV) inner-disc layer, a warm and optically-thick atmosphere to the disc (, keV) and a much hotter optically-thin corona. We note that such a model will inevitably produce a Comptonized component down to the energies suggested by the soft power-law continuum in Model 4. Crucially the warm, optically-thick accretion disc atmosphere will also produce a spectral turnover at energies of a few keV, similar to that we have modelled by a MCDBB. It is therefore possible that at least some ULXs could have X-ray spectra dominated by this optically-thick warm accretion disc atmosphere. This will be investigated in detail in future work.
4.3 Concluding comments
These observations imply a degree of spectral ambiguity as models supporting the presence of an IMBH (Models 2 and 3 of Table 2) and the non-standard alternative (Model 4) provide equally acceptable fits to the available data. In our view the balance of the argument still appears to favour the presence of an IMBH in NGC 5204 X-1, although its hard power-law slope remains as somewhat of an anomaly. However the contrasting interpretation of the data discussed in this paper clearly merits further investigation.
ACKNOWLEDGMENTS
We thank the second referee for
their fair and balanced review of this paper. TPR and LPJ gratefully
acknowledge support from PPARC. This work is based on observations
obtained with XMM-Newton, an ESA science mission with
instruments and contributions directly funded by ESA member states and
the USA (NASA).
References
- [] Begelman M.C., 2002, ApJ, 568, L97
- [] Borozdin K., Revnitsev M., Trudolyubov S., Schrader C., Titarchuk L., 1999, ApJ, 517, 367
- [] Chakrabarti S.K., Titarchuk L.G., 1995, ApJ, 455, 623
- [] Colbert E.J.M., Mushotzky R.F., 1999, ApJ, 519, 89
- [] Dewangen G.C., Miyaji T., Griffiths R.E., Lehmann I., 2004, ApJ, 608, L57
- [] Ebisawa K., Zycki P., Kubota A., Mizuno T., Wataria K., 2003, ApJ, 597, 780
- [] Foschini L., Rodriguez J., Fuchs Y., Ho L.C., Dadina M., Di Cocco G., Courvoisier T.J.-L., Malaguti G., 2004, A&A, 416, 529
- [] Georganopoulos M., Aharonian F.A., Kirk J.G., 2002, A&A, 388, L25
- [] Goad M.R., Roberts T.P., Knigge C., Lira P., 2002, MNRAS, 335, L67
- [] Greiner J., Cuby J.G., McCaughrean M.J., 2001, Nature, 414, 522
- [] Jansen F., et al., 2001, A&A, 365, L1
- [] Kaaret P., Corbel S., Prestwich A.H., Zezas A., 2003, Science, 299, 365
- [] King A., 2002, MNRAS, 335, L13
- [] King A., 2004, MNRAS, 347, L18
- [] King A., Davies M.B., Ward M.J., Fabbiano G., Elvis M., 2001, ApJ, 552, L109
- [] King A., Pounds K.A., 2003, MNRAS, 345, 657
- [] Körding E., Falcke H., Markoff S., 2002, A&A, 382, L13
- [] Kubota A., Done C., Makishima K., 2002, MNRAS, 337, L11
- [] Liu J.-F., Bregman J.N., Seitzer P., 2004, ApJ, 602, 249
- [] Makishima K. et al., 2000, ApJ, 535, 632
- [] McClintock J.E., Remillard R.A., 2004, to appear in Compact Stellar X-ray Sources, eds. W.H.G. Lewin and M. van der Klis. (MR04)
- [] Miller J.M., Fabbiano G., Miller M.C., Fabian A.C., 2003, ApJ, 585, L40
- [] Miller J.M., Fabian A.C., Miller M.C., 2004, ApJ, 607, 931
- [] Miller M.C., Colbert E.J.M., 2004, Int. J. Mod. Phys. D, 13, 1
- [] Mitsuda K., et al., 1984, PASJ, 36, 741
- [] Podsiadlowski Ph., Rappaport S., Han Z., 2003, MNRAS, 341, 385
- [] Portegies Zwart S.F., Baumgardt H., Hut P., Makino J., McMillan S.L.W., 2004, Nature, 428, 724
- [] Reig P., Belloni T., van der Klis M., 2003, A&A, 412, 229
- [] Roberts T.P., Goad M.R., Ward M.J., Warwick R.S., O’Brien P.T., Lira P., Hands A.D.P., 2001, MNRAS, 325, L7
- [] Roberts T.P., Warwick R.S., 2000, MNRAS, 315, 98
- [] Roberts T.P., Warwick R.S., Ward M.J., Goad M.R., 2004, MNRAS, 349, 1143
- [] Schrader C.R., Titarchuk L., 1999, ApJ, 521, L121
- [] Soria R., Motch C., Read A.M., Stevens I.R., 2004, A&A, 423, 955
- [] Stark A., Gammie C.F., Wilson R.W., Bally J., Linke R.A., Heiles C., Hurwitz M., 1992, ApJS, 79, 77
- [] Stobbart A., Roberts T.P., Warwick R.S., 2004, MNRAS, 351, 1063
- [] Titarchuk L., 1994, ApJ, 434, 570
- [] Ueda Y., et al., 2002, ApJ, 571, 918
- [] Watarai K., Mizuno T., Mineshige S., 2001, ApJ, 549, L77
- [] Zezas A., Fabbiano G., Rots A.H., Murray S.S., 2002, ApJ, 577, 710
- [] Zhang S.N., Cui W., Chen W., Yao Y., Zhang X., Sun X., Wu X.-B., Xu H., 2000, Science, 287, 1239