The radio counter-jet of the QSO 3C 48
We present multi–frequency radio observational results of the quasar 3C 48. The observations were carried out with the Very Large Array (VLA) at five frequencies of 0.33, 1.5, 4.8, 8.4, and 22.5 GHz, and with the Multi–Element Radio Linked Interferometer Network (MERLIN) at the two frequencies of 1.6 and 5 GHz. The source shows a one–sided jet to the north within 1″, which then extends to the northeast and becomes diffuse. Two bright components (N2 and N3), containing most of the flux density are present in the northern jet. The spectral index of the two components is and (). Our images show the presence of an extended structure surrounding component N2, suggestive of strong interaction between the jet and the interstellar medium (ISM) of the host galaxy. A steep–spectrum component, labelled as S, located 0.25′′ southwest to the flat–spectrum component which could be the core of 3C 48, is detected at a significance of . Both the location and the steepness of the spectrum of component S suggest the presence of a counter–jet in 3C 48.
Key Words.:
galaxies: quasar: individual: 3C~48; galaxies: jets; galaxies: counter-jets1 Introduction
The radio source 3C 48 (B0134+329) is a 16th magnitude quasar, with redsift (Spinrad et al. Spinrad85 (1985)). It was the first QSO identified at optical wavelengths (Smith et al. Smith61 (1961)), and the second identified one (after 3C 273) at radio wavelengths (Schmidt Schmidt63 (1963)). The source shows unexpectedly strong emission in the far IR bands, suggesting that it is located in a gas–rich environment (Chatzichristou et al. 1999). The variability measured with ROSAT suggests that at least part of the X–ray emission (principally the softest) arises from the region of the accretion–disc or from a beamed blazar component (Worrall et al. Worrall04 (2004)). The image obtained with University of Hawaii’s 2.2 meter optical telescope at Mauna Kea Observatory is dominated by a previously unsuspected high surface brightness region, which was referred to as “3C 48A”, centered ( kpc of projected linear size 111Hubble constant H0=75km s-1 Mpc-1, deceleration parameter q0=0.5 and zero cosmological constant) to the north of the QSO nucleus ( Stockton & Ridgway Stockton91 (1991); Hook et al. Hook94 (1994)). This region was identified as the potential second nucleus of a galaxy in the process of merging with the host galaxy of 3C 48 (Zuther et al. Zuther03 (2003)). Evidence indicates that the nuclear activity in 3C 48 is triggered by the merger process.
3C 48 is classified as a Compact Steep Spectrum (CSS) source based on its steep radio spectrum and its small angular size (Fanti et al. Fanti85 (1985)). The spectrum is reasonably straight from MHz up to GHz, with a integrated radio index (Peacock et al. Peacock82 (1982)). It shows a low–frequency peak at about 100 MHz (http://nedwww.ipac.caltech.edu). The quasar 3C 48 does not show significant variations with time and have a simple spectrum at MHz/GHz wavelengths (Baars et al. Baars77 (1977)), and it is usually used as the primary flux density calibrator in interferometer observations owing to its compactness and brightness. While Ott et al. 1994 found that the source could have become brighter from 1960s to 1990s, the increase in flux density is enhanced at shorter wavelengths, as is consistent with the activity in the core (Wilkinson et al. Wilkinson90 (1990)).
| No | Epoch | Array | Freq. | BWa | r.m.s. | MajMin, PA | Figure | ||
| (GHz) | (MHz) | (minute) | (Jy/b) | (mJy/b) | (arcsec, ) | ||||
| (1) | (2) | (3) | (4) | (5) | (6) | (7) | (8) | (9) | (10) |
| 1 | 1992.45 | MERLIN | 5.0 | 13 | 850 | 2.61 | 0.3 | , 34.4 | Fig.1d |
| 2 | 1993.64 | MERLIN | 1.6 | 15 | 900 | 4.65 | 1.3 | , 33.2 | Fig.1b |
| 3 | 1999.08 | VLA-C | 8.4 | 50 | 2 | 3.17 | 0.6 | , 7.9 | |
| 4 | 22.5 | 50 | 7 | 1.02 | 0.5 | , | |||
| 5 | 2000.92 | VLA-A | 8.4 | 50 | 2 | 1.66 | 0.3 | , | |
| 6 | 22.5 | 50 | 5.5 | 0.34 | 0.4 | , | Fig.1c | ||
| 7 | 2003.46 | VLA-A | 0.33 | 0.003 | 4.5 | 43.0 | 15 | , | |
| 8 | 1.5 | 0.012 | 4 | 15.3 | 1.8 | , | |||
| 9 | 4.8 | 50 | 3 | 3.69 | 1.0 | , | |||
| 10 | 8.4 | 50 | 4 | 1.60 | 0.3 | , | Fig.1a |
a the VLA observations at 0.33 and 1.5 GHz were
carried out in spectral line mode, and
recorded with narrow bandwidth;
b on-source integration time.
Most of the radio emission occurs on a scale smaller than about and additional emission extends to northwest to the nucleus, with a clumpy morphology (Hartas at al. Hartas83 (1983); Woan Woan92 (1992)). At sub–arcsecond resolution, the source exhibits an elongated structure in the north–south direction. VLBI observations showed a disrupted radio morphology (Wilkinson et al. 1991). The active nucleus, which is identified from its inverted radio spectrum (Simon et al. Simon90 (1990)), is weak at radio frequencies and is buried deeply within the host galaxy. A one–sided jet stretches out of the core towards the north within the nucleus of the host galaxy. The northern jet is highly dispersed at 0.05″–0.5″, and its diffused morphology has been interpreted as the result of the jet outflow interaction with the dense ISM in the host galaxy (Wilkinson et al. wilkinson91 (1991)). There is also morphological evidence for a recent merger event, such as a possible double nucleus and a tidal tail extending several arcseconds to the northwest (Chatzichristou et al. Chat99 (1999); Canalizo et al. Canalizo00 (2000); Zuther et al. Zuther03 (2003)).
In this paper, we present results of the multi–frequency VLA and MERLIN observations of 3C 48. The observations and data reduction are described in the next section. The analysis of the images is given in Section 3. Section 4 is a discussion. A summary is given in the last section.
2 Observation and data reduction
Quasar 3C 48 was observed as a flux density calibrator with the VLA on Jan. 29, 1999 (observational code is AH635) at 8.4 and 22.5 GHz, on Dec. 1, 2000 (AH721) at 8.4 and 22.5 GHz, as well as on June 17, 2003 (AZ143) at 0.33, 1.5, 4.8 and 8.4 GHz. The observations were carried out in snapshot mode. 3C 48 was observed at 4.8, 8.4 and 22.5 GHz with the VLA in the C configuration with a bandwidth of 50 MHz in two IFs, while the observations at 0.33 and 1.5 GHz were done in the spectral line mode in order to reject radio frequency interference (RFI). Two epochs of archival MERLIN data at 1.6 and 5.0 GHz were also used in this paper. The observational information of the VLA and the MERLIN is listed in Table 1 in a time series. Column 1 is the serial number. Columns 2 and 3 are the epoch and the array configuration. The observing frequency, bandwidth, and on–source time are listed in columns 4, 5, and 6, respectively.
The raw VLA data were calibrated and corrected for the phase and amplitude errors using the Astronomical Image Processing System (AIPS) of the National Radio Astronomy Observatory (NRAO). The MERLIN data were calibrated with the suite of D-programs (Thomasson (1986)).
The further process in the reduction of the VLA and MERLIN data, including editing, self-calibration and image analysis, was performed using both the AIPS and the DIFMAP packages (Shepherd, Pearson & Taylor 1994). In order to do analysis of the jet structure, we fitted Gaussian models to the self-calibrated uv data–sets. The task MODELFIT in the DIFMAP package was used for all data–sets except for the 5 GHz MERLIN, where we used the task JMFIT in AIPS in order to take out the extended emission prior to the model fitting. We found that 80–90% of the total flux density of the source is dominated by a few compact components. Elliptical Gaussian models were preferentially used. If elliptical Gaussian models failed in the least–square fitting, then a circular Gaussian was used. The errors in the model fitting parameters are estimated based on the method described by Fomalont (Foma99 (1999)). The uncertainties of flux density, originating from the calibration precess, are estimated within a range between 5% (for VLA) and 10% (for MERLIN). The uncertainty of the component position is proportional to the FWHM of the synthesized beam and is inversely proportional to the ratio of peak signal to noise (Fomalont Foma99 (1999)).

3 Analysis
3.1 Images
We imaged the source using the data–sets listed in Table 1. The results show that the source is resolved when the resolution is higher than 0.5″. Fig. 1 shows four images at 1.6, 5, 8.4 and 22.5 GHz with sub–arcsec resolutions. The detailed structure of the source is shown in the images from Fig.1a to 1d based on an order of increasing resolution. These images are made using uniform weighting. Since most of the observations lack nearby phase calibrators, the bright, compact component N2 was used as the phase reference in the self–calibration and imaging process. The parameters of each image are summarized in Table 1. Columns 7 and 8 give the peak flux density and the off–source r.m.s. noise in each of the images; column 9 gives the size of the synthesized beam; column 10 indicates the label of the images that are present in Fig. 1. Each of the major components in the images are fitted in least square to a Gaussian model. The results of model–fit to the calibrated data are listed in Table 2. Column (1) is the serial number of the observations, which is the same as that in Table 1; column (2) is the observing epoch; column (3) is the observing frequency; column (4) is the component label; column (5) is the integral flux density of Gaussian component; columns (6) and (7) are the peak position of the Gaussian component in RAB1950 and DecB1950 coordinates; columns (8), (9), and (10) are the sizes of major and minor axes and the position angle. Previous observations show that the source is dominated by steep spectrum components and the radiation from the core is rather weak and is difficult to identify at radio frequencies. We note that the phase center in each image is closer to the brightest jet component N2 (RAB1950: , DECB1950: ) than the radio core. The core component and its location will be discussed in Section 4.1.
| No | Freq. | Comp. | RA | DEC | a | b | Figure | ||
| (GHz) | (Jy) | () | () | (mas) | (mas) | (°) | |||
| (1) | (2) | (3) | (4) | (5) | (6) | (7) | (8) | (9) | |
| 1 | 4.8 | N2a | 1.549 | 01 34 49.8260.005 | 32 54 20.2640.004 | 86.0 | 53.6 | 168.1 | Fig.1d |
| N2b | 0.799 | 49.8260.004 | 20.1750.003 | 65.0 | 57.3 | 71.8 | |||
| N3a | 1.423 | 49.8210.006 | 20.0250.003 | 99.7 | 47.4 | 11.0 | |||
| N3b | 0.164 | 49.8210.003 | 19.9360.002 | 57.6 | 43.5 | 1.1 | |||
| 2 | 1.6 | N1 | 3.29 | 49 8400.034 | 20.2960.036 | 512.0 | 342.5 | 4.9 | Fig.1b |
| N2 | 10.33 | 49.8270.030 | 20.2640.017 | 255.5 | 224.71 | 179.8 | |||
| N3 | 3.13 | 49.8210.006 | 20.0750.006 | 264.0 | 205.3 | ||||
| S | 0.039 | 49.8120.026 | 19.5740.014 | 187.2 | 99.4 | 172.0 | |||
| 3 | 8.4 | N | 3.20 | 49.8260.036 | 20.2640.010 | 317.2 | 105.4 | 25.4 | |
| 4 | 22.5 | N | 1.06 | 49.8270.055 | 20.2600.021 | 262.0 | 84.2 | 18.9 | |
| 5 | 8.4 | N1 | 0.211 | 49.8430.030 | 20.5120.030 | 330.0 | 330.0 | ||
| N2 | 1.997 | 49.8270.012 | 20.2810.012 | 131.3 | 131.3 | ||||
| N3 | 1.025 | 49.8210.011 | 20.0750.011 | 118.3 | 118.3 | ||||
| S | 0.013 | 49.8070.033 | 19.6190.026 | 356.0 | 280.0 | 112.9 | |||
| 6 | 22.5 | N2a | 0.55 | 49.8270.038 | 20.2630.038 | 64.1 | 64.1 | Fig.1c | |
| N2b | 0.35 | 49.8250.045 | 20.1720.045 | 75.7 | 75.7 | ||||
| N3a | 0.30 | 49.8210.033 | 20.0290.033 | 56.5 | 56.5 | ||||
| N3b | 0.12 | 49.8210.028 | 19.9400.028 | 48.4 | 48.4 | ||||
| 7 | 0.33 | N | 43.14 | 49.8270.081 | 20.2570.058 | 466.4 | 332.7 | -40.9 | |
| 8 | 1.5 | N | 15.88 | 49.8260.022 | 20.2600.006 | 373.5 | 108.0 | 28.4 | |
| 9 | 4.8 | N | 5.35 | 49.8260.014 | 20.2540.020 | 322.7 | 146.1 | 24.6 | |
| S | 0.015 | 49.8140.018 | 19 4200.016 | 705.5 | 341.1 | 80.6 | |||
| 10 | 8.4 | N1 | 0.250 | 49.8390.031 | 20.4530.031 | 330.0 | 330.0 | Fig.1a | |
| N2 | 1.848 | 49.8270.011 | 20.2800.011 | 118.3 | 118.3 | ||||
| N3 | 1.011 | 49.8210.010 | 20.0790.010 | 107.5 | 107.5 | ||||
| S | 0.016 | 49.8100.027 | 19.6330.027 | 292.0 | 282.0 | 72.7 |
Fig. 1a is the VLA image at 8.4 GHz observed at the epoch of 2003. The image shows an elongated structure in the NE–SW direction, which includes 4 components (N1, N2, N3, and S). The main jet is dominated by the components N1, N2, and N3. Component S has been detected for the first time at a significance level above , at RA and DEC . An independent VLA image at 8.4 GHz, made from the observation at the epoch 2000, confirms the detection. The epoch 2000 image at 8.4 GHz is not shown, while the parameters derived from model fitting are listed in Table 2.
The two major components (N2 and N3), the northern extended component (N1), and the weak southern component (S) are also detected in the 1.6 GHz MERLIN image (Fig.1b). A Gaussian fit failed in fitting the diffuse component N1, visible in the MERLIN 1.6 GHz image. Component S is confirmed at 12, and can be fitted with a Gaussian of (PA ) with peak brightness of mJy per beam.
Both components N1 and S appear to be completely resolved in the high resolution images at 22.5 GHz (Fig. 1c) observed with VLA and at 5 GHz observed with MERLIN (Fig. 1d). At the high resolutions, the component N2 and N3 are further resolved into subcomponents, labelled as N2a and N2b, N3a and N3b, respectively.
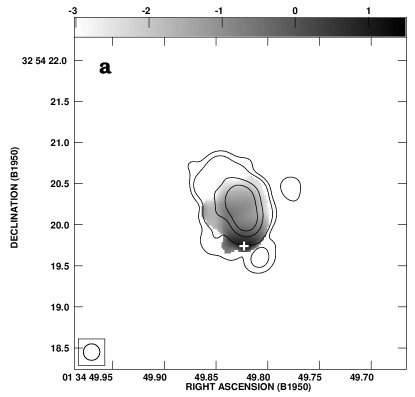
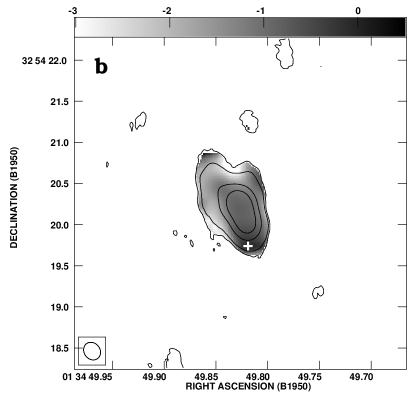
3.2 Spectral index
The multi–frequency observations allow us to study the spectral index distribution of 3C 48 at sub arc–second resolutions. Fig. 2a shows the image of the spectral index distribution (grey scale) derived from the VLA images at 8.4 and 22.5 GHz at the epoch of 2000.92, with the contours of the radiation intensity at 8.4 GHz superimposed. The uv–data at 22.5 GHz is tapered to match the synthesized beam of the data at 8.4 GHz. Both images at 8.4 and 22.5 GHz are convolved to the same resolution and are aligned with respect to the common phase center. With the same method, we obtained the spectral index image (Fig.2b) with the MERLIN data sets. Fig. 2b shows the spectral index image (grey scale) between 1.6 and 5 GHz, with the MERLIN 5 GHz contours overplotted. The dark end of the grey scale corresponds to the flat spectrum. Most of the source shows a steep spectrum. The spectrum is steepest in the northern jet (component N2), while it becomes flatter to the south.
In order to image the distribution of the spectral index across the source, we plotted the spectral index along the jet axis at position angle of . The slice spectral indexes are shown in Figs.3a and 3b, corresponding to Figs.2a and 2b, respectively. There is a component centered at RA , DEC , marked with a cross in Figs.2a&b, showing rather flat spectrum.
The spectral index of components N2, N3 and S are estimated based on the model fitting results. Fig.4 shows the power–law fitting in logarithmic coordinate. The spectrum of component N2 () is slightly steeper than that of component N3 (); and component S shows also a steep spectrum with between 1.6 and 8.4 GHz. The results are consistent with those shown in Figs. 2 and 3. A mean spectral index for the overall source (3C 48) is estimated from the total flux densities at the frequencies between 0.33 and 22.5 GHz (Fig. 4).


4 Discussion
4.1 The position of the nucleus
In Section 3.2 we showed that the flat–spectrum component centered at RA , DEC , is most likely the nuclear core in 3C 48. The flat–spectrum core is likely to be buried in the strong emission at the centimeter and longer wavelengths. A detection of the active core was also claimed by Simon et al. (1990). The core was identified at the southern end of the source in their 22.5 GHz image. Wilkinson et al. (1991) suggested that the radio core detected by Simon et al. 1990 is associated with the southernmost component in their high resolution image. Based on the analysis of our data, we find that the position of the flat–spectrum core in our image is south of that identified by Simon et al. 1990 and Wilkinson et al. 1991. Further higher resolution and higher dynamics range images at millimeter wavelengths are needed to unambiguously identify the nucleus in 3C 48.
4.2 A counter–jet in 3C 48
We have distinctly detected an extended component S southwest of the flat–spectrum core, which is the putative nucleus of 3C 48. Component S shows a steep spectrum, i.e. . Due to its location and the steep spectrum nature, we suggest that S is a counter–jet.
Alternatively, a multi–particle model has been successfully developed and has been applied to the host galactic nucleus of 3C 48 (Scharwächter et al. Scharw04 (2004)), suggesting a counter tidal tail extending to the southwest in front of the main body of the 3C 48 host. The detection of component S could be a supportive evidence for the counter tidal tail in this quasar.

4.3 Interaction with ISM
CSS sources usually have sub-kpc sizes with complex radio morphologies. The nature of CSS sources is not completely understood yet and two scenarios are suggested. In the youth scenario, CSS sources are small and could reflect an early stage in the evolution of radio sources (Phillips & Mutel Phillips82 (1982), Fanti et al. Fanti95 (1995)). According to the frustration scenario, , the unusual conditions in the interstellar medium of their host galaxies, such as a higher density and/or the presence of turbulence, inhibit the radio source from growing to larger sizes (van Breugel et al. Van84 (1984)). The youth scenario is very much preferred with statistical research (Saikia et al. Saikia95 (1995), Saikia01 (2001); Murgia et al. Murgia99 (1999), Murgia01 (2001)). Despite this statistical interpretation, the frustration scenario may still apply to individual sources which can be interpreted in terms of confinement and interaction between the jets and ISM in the host galaxies. Numerical simulations have also shown that a dense ISM may substantially confine CSS sources (De Young De93 (1993)). The radio structure of 3C 48 has shown the evidence for strong interaction between the radio jet and the ISM in the host galaxy. Here is a working scenario. A supersonic collimated jet stretches out from the core to the north where a shock is produced in the interaction between jet flow and the dense medium. The interaction converts the kinetic energy carried by the jet to internal energy or turbulence which could enhance the acceleration of particles and then the radiation field, causing the jet to brighten. The observed north jet brightening (hot spot N2 in Fig.1c and Fig.1d) after losing collimation appears to be consistent with this picture. Based on the study of the kinematics and physical conditions of the extended emission line gas and their relations to the nuclear star formation, Chatzichristou (2001) found that the coupling between radio jet and gas is the kinematic signature of a recent interaction. Both Canalizo & Stockton (2000) and Chatzichristou et al. (1999) suggested that the unusually high stellar velocity dispersion as well as very young stellar populations are possibly related to the interaction of the nuclear radio jets with the ambient media. The NIR (near infrared) images and spectra also suggest that reddening by several magnitudes in the nuclear emission can be explained by the interactions of the 3C 48 radio jet with the circum–nuclear medium (Zuther et al. Zuther03 (2003)). The ratio of the recombination lines and determined from 3C 48 (Zuther et al. Zuther03 (2003)) is about 1.6 (), which is consistent with the value typical for the ISM of active galactic nuclei being excited by the central–engine continuum emission.
5 Summary
In this paper, we carried out radio multi–frequency observations of 3C 48. The high dynamic range images exhibit the detailed structure of the source on the sub–arcsec scale. The position of the nucleus with a flat spectrum is determined based on the spectral index distribution images. The jet components show steep spectra. We confirm the existence of a counter–jet in 3C 48, which shows the evidence for the first time that 3C 48 actually has a double-sided jet. The northern jet appears to be disrupted at 0.5″northeast to the core. Our analysis suggests that the initially collimated jet can be disrupted by the interaction between jet flow and the circum-nuclear medium.
6 Acknowledgement
This research is supported by the National Science Foundation of PR China (10328306, 10333020, and 10473018). The authors are grateful for the technique support by the staff of the VLA and the MERLIN. The VLA is a facility of the National Radio Astronomy Observatory, which is operated by Associated Universities Inc. under cooperative agreement with the National Science Foundation. MERLIN is a National Facility operated by the University of Manchester at Jodrell Bank Observatory on behalf of PPARC. W.X.Feng thanks the MERLIN staff (Peter Thomasson) for providing the archive data. It is a great pleasure to thank the referee Paul Wiita who suggested some improvements, and also thanks Prof. D.R.Jiang for his valuable advices in this paper. This research has made use of the NASA/IPAC Extragalactic Database (NED).
References
- (1) Baars, J. W. M., Genzel, R., Pauliny-Toth, I. I. K., & Witzel, A. 1977, A&A, 61, 99
- (2) van Breugel, W. J. M., Miley, G. K., & Heckman, T. A. 1984, AJ, 89, 5
- (3) Canalizo, G., & Stockton, A. 2000, ApJ, 528, 201
- (4) Chatzichristou, E. T., Vanderriest, C., & Jaffe, W. 1999, A&A, 343, 407
- (5) Chatzichristou, E. T. 2001, IAUS, 205, 162
- (6) De Young, D. 1993, ApJ, 402, 95
- (7) Fanti, C., Fanti, R., Parma, P. et al. 1985, A&A, 143, 295
- (8) Fanti, C., Fanti, R., Dallacasa, D., Schilizzi, R.T., Spencer, R.E., Stanghellini, C., 1995, A&A, 302, 317
- (9) Fomalont, E. B. 1999, in Synthesis Imaging in Radio Astronomy II, ed. Taylor, G. B., Carilli, C. L., & Perley, R. A., 301
- (10) Hartas, J. S., Ree, W. G., Scott, P. F. et al. 1983, MNRAS, 205, 625
- (11) Hook, R., Lucy, L., Stockton, A., & Ridgway, S. 1994, ST-ECF Newsletter, 21, 16
- (12) Murgia, M., Fanti, C., Fanti, R. et al. 1999, A&A, 345, 769
- (13) Murgia, M., Fanti, C., Fanti, R. et al. 2001, NewAR., 46, 307
- (14) Ott, M., Witzel, A., Quirrenbach, A. et al. 1994, A&A, 284, 331
- (15) Peacock, J. A., & Wall, J. V. 1982, MNRAS, 198, 843
- (16) Phillips, T.J., & Mutel, R. L. 1982, A&A, 106, 21
- (17) Saikia, D. J., Jeyakumar, S., Wiita, P. J. et al. 1995, MNRAS, 276, 1215
- (18) Saikia, D. J., Jeyakumar, S., Salter, C. J. et al. 2001, MNRAS, 321, 37
- (19) Scharwächter, J., Eckart, A., Pfalzner, S. et al. 2004, A&A, 414, 497
- (20) Schmidt, M. 1963, Nat, 197, 1040
- (21) Shepherd, M. C., Pearson, T. J., & Taylor, G. B. 1994, BAAS, 26, 987
- (22) Smith, H. J., & Hoffleit, D. 1961, PASP, 73, 292S
- (23) Simon, R. S., Readhead, A. C. S, Moffet, A.T. et al. 1990, ApJ, 354, 140
- (24) Spinrad, H., Djorrgovski, S., Marr, J. et al. 1985, PASP, 97, 932
- (25) Stockton, A., & Ridgway, S. E. 1991, AJ, 102, 2
- Thomasson (1986) Thomasson, P. 1986, QJRAS, 27, 413
- (27) Wilkinson, P. N., Tzioumis, A. K., Akujor, C. E. et al. 1990, in “Parsec-Scale Radio Jets”, ed. Zensus, J. A., & Pearson, T. J., Cambridge University Press, P. 152
- (28) Wilkinson, P. N., Tzioumis, A. K., Benson, J. M. et al. 1991, Nat, 352,313
- (29) Woan, G. 1992, A&A, 352, 313
- (30) Worrall, D. M., Hardcastle, M. J., Pearson, T. J. et al. 2004, MNRAS, 347, 632
- (31) Zuther, J., Eckart, A., Scharwächter, J. et al. 2003. A&A, 414, 919