Is the Radio Core of BL Lac Precessing?
Abstract
Stirling et al. (2003) reported the discovery of a 2.3 year periodic variation in the structural position angle of the parsec-scale radio core in the blazar BL Lac . We searched for independent confirmation of this periodic behavior using 43 GHz images of the radio core during ten epochs overlapping those of Stirling et al. Our maps are consistent with several periodicities, including one near the period reported by Stirling et al. By comparing our position angle measurements with those of Stirling et al., we find strong consistent evidence for position angle variations of the inner core during the observed epochs. However, the claim for periodic variation is not convincing, especially when the most recent epochs (2000.60 - 2003.78) are included. A definitive resolution will require continued monitoring of the core structure over several periods.
1 Introduction
There is growing evidence that at least some active galactic nuclei (AGN) display periodic behavior on a timescale of years or decades. The observational evidence consists largely of periodicities in optical or radio light curves or periodic variations in the parsec-scale radio cores mapped by VLBI. Perhaps the best documented case study is that of the BL Lac object OJ287 for which a period of 11.6 year was found in the visible light curve (Sillanpää et al., 1988). This periodicity was confirmed by observations of a predicted outburst in 1994 (Sillanpää et al., 1996; Pursimo et al., 2000) but with a one year delay between the optical and radio peaks (Valtonen, Lehto, & Pietilä, 1999). Katz (1997) suggested that the observed periodicity is due to the sweeping of a relativistic beam aligned normal to a precessing accretion disk surrounding a supermassive black hole. Valtaoja et al. (2000) suggest a binary black hole model in which the secondary orbit penetrates the accretion disk of the primary, causing a thermal (optical) pulse, followed by enhanced accretion and increased particle flux in the relativistic jet, which is responsible for the time-delayed radio flare.
Precessing relativistic beams have also been invoked to explain the undulating jet structures in several compact radio sources, including 1928+738 (Roos, Kaastra, & Hummel, 1993; Murphy, Preston, & Hirabayashi, 2003), 0153+744 (Hummel et al., 1997), and 4C12.50 (Lister et al., 2003). Britzen et al. (2000, 2001) interpreted the strongly bent relativistic jet in PKS 0420-014 as evidence for a binary black hole system which precesses on a timescale 10 yr. Abraham & Romero (1999) analyzed eight superluminal jet components of the parsec-scale radio quasar 3C273 observed over the last 30 yr. They suggest that the observed velocities and position angles can be interpreted by ejection of synchrotron-radiating shocks moving outward in ballistic trajectories from the base of a precessing inner jet whose period is 16 yr.
These observations provide post facto evidence for precession in the central engines of AGN i.e., the observed jet morphology is interpreted as a record of the putative jet motion, but the jet oscillation itself has not been observed. However, in a recent paper Stirling et al. (2003) report that they have directly detected periodic changes in the parsec-scale radio jet orientation of the eponymous AGN BL Lacertae based on analysis of two independent datasets: Periodic variations in the polarization position angle at 1 mm wavelength, and in the direction of the innermost radio core component in 43 GHz VLBI maps. In the latter case, they find strong evidence of periodicity with a timescale of yrs and an angular amplitude of . The VLBI maps spanned 23 epochs over the time range 1997.58 – 2001.28. They modeled the source brightness at each epoch using a variable number of elliptical Gaussian components, including a two closely-spaced ( mas) circular Gaussian subcomponents in the core. The model component parameters were adjusted for a best-fit to the observed brightness distribution. They found a periodic variation in the core ‘structural position angle’ (SPA), defined as the relative position angle between the two closely spaced core subcomponents.
This paper reports results from a series of 43 GHz VLBI observations of BL Lac using very similar observing parameters during an overlapping time range (1998.73 – 2003.82). Although the primary purpose of the observations was rather different (monitoring the magnetic field structure of the radio jet, Mutel & Denn, 2004 in prep.), the resulting maps are of comparable quality to those of Stirling et al. (2003) and provide an independent test of the precession hypothesis.
2 Observations and Data Reduction
The observations were performed at regular 0.3 year intervals during nine epochs between 1998.76 and 2002.05 and a tenth epoch at 2003.82 using the 10-element Very Long Baseline Array 111The National Radio Astronomy Observatory is operated by the National Radio Astronomy Observatory by Associated Universities, Inc., under cooperative agreement with the National Science Foundation (VLBA). The observations consisted of a series of short scans at each of three observing frequencies (15.4, 22.2, 43.2 GHz) of BL Lac and three other AGN sources in sequence for 12 hours. We recorded both left and right circular polarization at each telescope and correlated all four cross-correlations pairs (RR, LL, RL, and LR) for each baseline. The data were recorded in standard VLBA mode using 128 MHz bandwidth and 1-bit sampling.
Prior to self-calibration, all fringe-fitting and visibility calibration was done using the Astronomical Imaging Processing System (AIPS, van Moorsel, Kemball, & Greisen, 1996). We performed amplitude calibration using the AIPS automated calibration transfer system (Ulvestad, 1999). Fringe fitting of the parallel (RR, LL) and cross-hand (RL, LR) polarization correlations, as well as removal of instrumental polarization were done using the scheme described in (Denn, Mutel, and Marscher, 2000). Hybrid mapping was done in AIPS and with the Caltech hybrid mapping program DIFMAP (Shepherd, 1997). The resulting Stokes I maps had typical RMS noise level mJy per beam at 43 GHz.
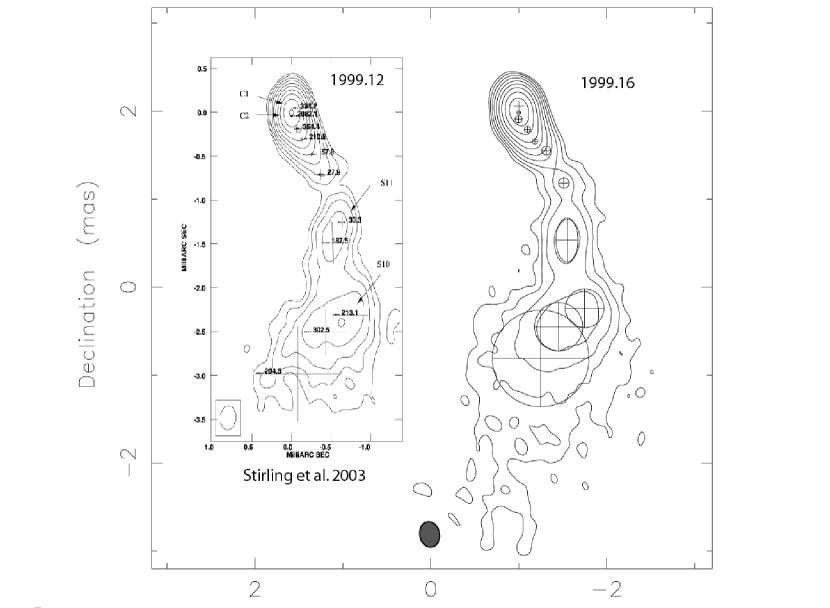
Figure 1 shows a comparison of 43 GHz contour maps of BL Lac observed by (Stirling et al., 2003) at epoch 1999.12 and our map 14 days later (epoch 1999.16). In both maps, eleven component best-fit elliptical Gaussian brightness models are shown overlaid by crosses and circles. The maps are very similar, both in dynamic range and angular resolution, as might be expected given the similarity in observing equipment and close proximity in time. However, there are small but statistically significant differences in the Gaussian component locations and sizes, which might reflect real differences in structure over 14 days, but could also be partially explained by subtle differences in the model fitting algorithms used– (Brandeis VLBP package, Roberts, Gabuzda, & Wardle, 1987) versus (DIFMAP, Shepherd, 1997). Nevertheless, the close similarity in image quality and resolution of the two datasets confirms that the present data comprise a comparable but independent test of the claim for periodic behavior in the inner core.
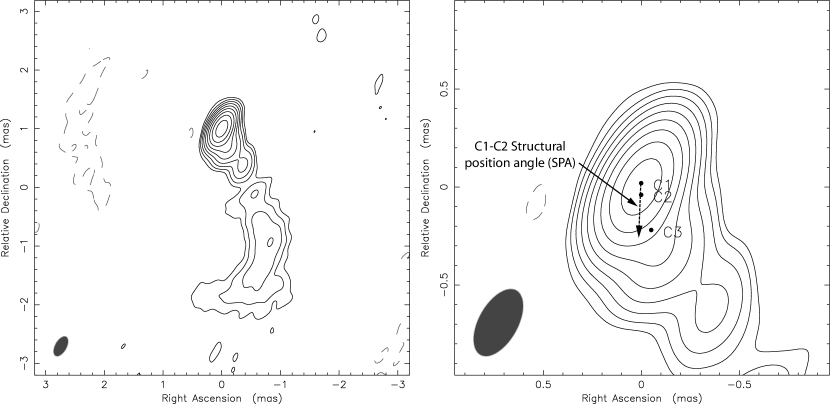
Gaussian component modeling of the inner core structure is illustrated in Figure 2. Figure 2 shows the full 43 GHz hybrid map of BL Lac at epoch 1999.73, while Figure 2 is a magnified view of the core only. The innermost part of the core was fit with three circular Gaussian components labeled C1, C2, and C3. The structural position angle (SPA) is defined as the position angle between the two innermost components C1 and C2. It is this orientation angle that Stirling et al. (2003) find exhibits periodic variation which they interpret as evidence for core precession. Note that the C1-C2 separation is only % of the restoring beam dimension along the structural position angle (lower left ellipse). Hence, the inner core substructure is not well resolved, which makes the Gaussian component decomposition non-unique. To check the reliability of the SPA determination, both Stirling et al. (2003) and us also fitted a single elliptical Gaussian component to the innermost core for each epoch. The resulting major axis orientation is compared with the SPA orientation using the C1-C2 position angle in Table 1. The differences are less than the uncertainties in the position angle determination, indicating that although the angular resolution of the 43 GHz maps is inadequate to determine details of the inner core substructure, the orientation of the inner core is probably accurately determined by Gaussian component modeling.
| Epoch | 2 Component Gaussian | Ellip. Gaussian | SPA | |
|---|---|---|---|---|
| yr | SPA() | r(mas) | SPA() | () |
| 1998.76 | ||||
| 1998.97 | ||||
| 1999.16 | ||||
| 1999.41 | ||||
| 1999.73 | ||||
| 2000.01 | ||||
| 2000.31 | ||||
| 2001.60 | ||||
| 2002.05 | ||||
| 2003.82 | ||||
2.1 Model Component Uncertainty Estimates
We used the program DIFWRAP (Lovell, 2000) to estimate uncertainties in fitted Gaussian components. DIFWRAP is a ‘front-end’ graphical user interface to DIFMAP which allows the user to constrain a selected subset of model parameters over a fixed grid of values while allowing other parameters to freely vary. For each set of model parameters, the visibilities are self-calibrated and hybrid mapped, with the adjustable model components varied so ensure a best-fit to the visibility data. This method has the advantage that it allows for the inter-dependence of model components to be taken into account during model fitting. The resulting self-calibrated maps are displayed for visual inspection with the value of each set of model components.
We used DIFWRAP to vary the separation and SPA of the core subcomponents C1 and C2 in steps of 0.02 mas and 5 respectively, followed by self-calibration and model fitting for each set of C1-C2 positions. We generated a sequence of hybrid maps corresponding to gridded values of separation and SPA over the ranges 0.02 to 0.20 mas and 180 to 240 respectively. At each epoch, the map corresponding to the minimum value was differenced from each of the other maps. In order to determine the uncertainties in the separation and SPA of the C1-C2 component pair, we adopted the heuristic criterion that the RMS noise level of the differenced map associated with a particular core separation and SPA did not increase by more than 50% from the lowest value for any map.
Comparison of the SPA uncertainties of Stirling et al. (2003) with the present data shows that the former are significantly smaller than ours: The mean uncertainties are and respectively. This is surprising, since although the detailed method to determine uncertainties differs, the instrumental technique, mapping procedures, and resulting maps are nearly identical (e.g. Figure 1). More important, the published Stirling et al. SPA data does not agree with their proposed periodic model: The formal fit of SPA angle vs. epoch to the periodic function described in Stirling et al. (2003) can be rejected at 99.9% confidence. Hence, in order to compare our SPA data with those of Stirling et al. (2003) in a consistent manner, we solved for a constant multiplicative factor to apply to their SPA uncertainties which would result in a reduced = 1 when their model was applied. The resulting factor (1.5) made their uncertainties comparable with ours. In the following, we refer to the Stirling et al. dataset with larger uncertainties as the rescaled Stirling et al. data set.
3 Results
The variation of inner core SPA’s versus epoch were compared with the periodic model of Stirling et al. as well as least-squares fitted periodic and constant models. We analyzed measurements derived from the ten epochs reported in this paper, the data of Stirling et al., and a combined dataset consisting of all 33 epochs. The fitted parameters as well as resulting reduced and agreement factors are listed in Table 2. The periodic models have the form
| (1) |
Column 1 lists the model being tested, while columns 2-5 list the model parameters. Columns 6 and 7 list the SPA dataset and number of epochs. Column 8 lists the reduced of the model fitted to the data, while column 9 lists the corresponding goodness of fit probability (i.e., the probability that an experimental data set consistent with the assumed model would result in a reduced value at least as large as the measured value). We refer to this as the acceptance probability in the following.
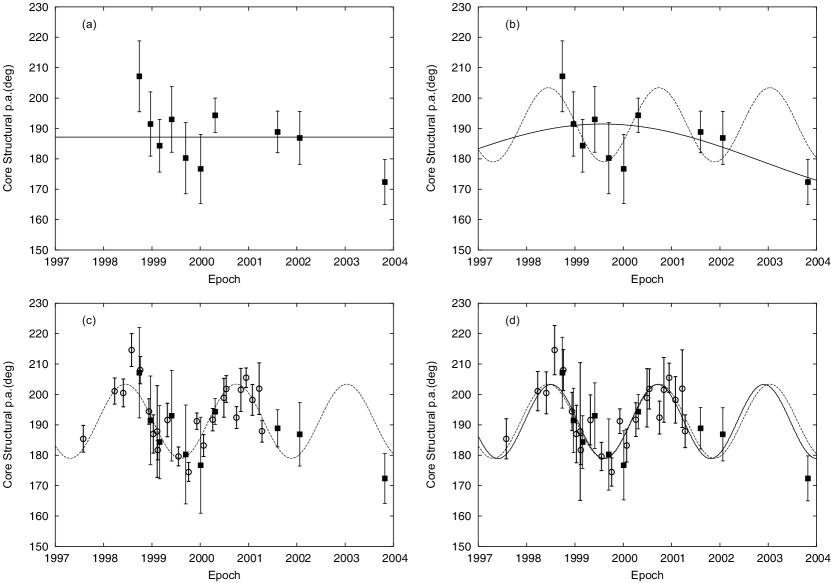
Figure 3 is a plot of core SPA (determined from C1-C2 position angle) versus epoch for all ten epochs listed in Table 1, along with the null hypothesis model (non-varying SPA, solid line). The reduced of the fit is 2.76 (acceptance probability ). Hence, at 99% () confidence the present SPA data indicates significant variations in the orientation of the inner core. Similarly, the one component elliptical Gaussian SPA data has a reduced of 2.24 (), implying significant variability at confidence. The Stirling et al. SPA data also indicate variability at high confidence ().
Figure 3 shows the same data, but with a least-squares fit to a periodic model (solid line, period 13.1 yrs), and the model of Stirling et al. (dotted line). While neither model can be excluded, the fits are not particularly good: The acceptance probabilities are respectively. By comparison, the one component elliptical Gaussian SPA data has a best-fit solution with a 1.43 yr period and is in good agreement (). The large difference in least-squares periodic solutions between the one and two-component SPA data, in spite of their similar values (Table 1), indicates that ten sampling epochs is probably insufficient to determine the true periodicity of the SPA data if it exists.
Figures 3 shows combined SPA measurements from Stirling et al. (open circles) along with the present data (solid squares), and the Stirling et al. periodic model (dashed line). The reduced of the fit is 1.88, or an acceptance probability . However, we have argued (see §2.1) that the uncertainties reported by Stirling et al. may be underestimated. Figure 3 shows the same data, but with rescaled Stirling et al. uncertainties. The Stirling et al. model (dashed line) and the least-squares best-fit periodic model (solid line) are also shown. The corresponding acceptance probabilities are 0.40 and 0.49 respectively. The best-fit period is yrs, in excellent agreement with the yr period determined by Stirling et al. (2003).
| Model | Model Parameters | SPA Data | Epochs | Prob. | ||||
|---|---|---|---|---|---|---|---|---|
| Stirling et al. | 12.2 | 2.29 | 1997.9 | 191 | This paper C1-C2 | 10 | 1.79 | 0.10 |
| ” | ” | ” | ” | This paper Gaussian | 10 | 1.47 | 0.18 | |
| ” | ” | ” | ” | Stirling et al. | 23 | 2.28 | 0.001 | |
| ” | ” | ” | ” | Stirling rescaled | 23 | 1.01 | 0.44 | |
| ” | ” | ” | ” | Combined | 33 | 1.88 | 0.003 | |
| ” | ” | ” | ” | Combined rescaled | 33 | 1.05 | 0.40 | |
| Best-fit periodic | 12.1 | 13.1 | 1996.3 | 179 | This paper C1-C2 | 10 | 1.61 | 0.14 |
| 12.0 | 1.43 | 1997.2 | 183 | This paper Gaussian | 10 | 1.07 | 0.38 | |
| 12.2 | 2.29 | 1997.9 | 191 | Stirling et al. | 23 | 2.27 | 0.001 | |
| 12.2 | 2.29 | 1997.9 | 191 | Stirling rescaled | 23 | 1.01 | 0.45 | |
| 12.1 | 2.24 | 1997.9 | 191 | Combined | 33 | 1.82 | 0.004 | |
| 12.1 | 2.22 | 1997.9 | 191 | Combined rescaled | 33 | 0.99 | 0.49 | |
| Non-varying | - | - | - | 187 | This paper C1-C2 | 10 | 2.78 | 0.01 |
| - | - | - | 192 | This paper Gaussian | 10 | 2.24 | 0.04 | |
| - | - | - | 192 | Stirling et al. | 23 | 7.12 | ||
| - | - | - | 192 | Stirling rescaled | 23 | 3.16 | ||
| - | - | - | 191 | Combined | 33 | 5.35 | ||
| - | - | - | 192 | Combined rescaled | 33 | 4.98 | ||
,
4 Discussion
Do the present observations support Stirling et al.’s claim of core orientation periodicity? The results are ambiguous: While the SPA’s derived from the present data are consistent with the Stirling et al. model, they are also consistent with several other periodic models. This is not surprising given the relatively large uncertainty of each SPA measurement with respect to the half-amplitude of the putative periodic variations.
Given this ambiguity, it is useful to inquire whether agreement with the Stirling et al. model is statistically significant. The acceptance probability of the combined dataset to the best-fit periodic model () is only marginally better than that of the rescaled Stirling et al. dataset alone (). However, even with the relatively large uncertainties of the present SPA data, would a different set of measurements been able to falsify the periodic model of Stirling et al.? In order to test this, we randomly reassigned the epochs of our ten SPA measurements and calculated the goodness of fit to the Stirling et al. model. We generated 10,000 shuffled datasets and calculated the resulting reduced and acceptance probabilities for all cases. More than 96% of these shuffled datasets had acceptance probabilities , i.e., they could be rejected at 95% () confidence or higher. We conclude that the current SPA data does provide independent confirmation (at confidence) of SPA variations similar to those reported by Stirling et al. during the time interval spanned by both sets of observations.
A more critical question is whether the combined dataset provides convincing evidence for (or against) periodic SPA variations. Since the combined dataset spans less than two periods with adequate sampling intervals (1998.23 - 2002.05), it is difficult to to make strong case for periodicity as opposed to episodic variations. If the variations are regular and periodic, measurement of SPA orientations over a longer timescale provides a critical test of periodicity. We can use the three epochs observed since the last SPA measurement of Stirling et al. (epochs 2001.60, 2002.05, 2003.82) to test periodic models. A goodness of fit analysis of these three measurements using the periodic model of Stirling et al. and the best-fit model in Table 2 results in acceptance probabilities i.e., rejection of the model at slightly less than confidence. While this result is not definitive, it calls into doubt the periodic nature of the SPA variations.
If the inner core of BL Lac is precessing, one might expect periodic variations in the radio flux, since the relativistically beamed jet emission will be strongly modulated by the line of sight angle. The Doppler-boosted flux will depend on the Lorentz factor of the emission region and its angle to the observer’s line of sight. Denn, Mutel, and Marscher (2000), in analyzing 17 epochs of BL Lac radio jet maps, fit a helical jet model inclined at an a angle of to the observer’s line of sight. The four observed superluminal component Lorentz factors were in the range ( km s-1 Mpc-1). Since the observed half-angle of precession is , the deprojected angle is . The expected flux ratio would be
where is the Doppler factor, is the source spectral index, and are the extremal values of the line of sight angle. At centimeter wavelengths BL Lac is nearly always a flat spectrum source (), so the expected flux ratio over one precession cycle ranges from 1.1 () to 2.5 (). Stirling et al. (2003) used their kinematic model for BL Lac and obtained similar results.
Kelly, Hughes, Aller, & Aller (2003) have recently reported detection of quasi-periodic variations in the radio flux of BL Lac. They analyzed 20 years of synoptic radio flux measurements at 4.8, 8.4, and 14.5 GHz from the University of Michigan Radio Astronomy Observatory (UMRAO) using a cross-wavelet transform algorithm. They report significant frequency-dependent peaks: 1.4 yr (4.8 GHz), 3.7 yr (8.4 GHz) and multiple periods (0.7, 1.6, and 3.5 yr) at 14.5 GHz. These are near, but not definitely not within the uncertainty range of the proposed precession period of yr of Stirling et al., or the amended period yr determined using all 33 epochs. Villata et al. (2004) have searched for periodicities in historical radio and optical light curves for BL Lac from 1968-2003. They analyzed multi-frequency radio observations from 4.6 to 37 GHz using several statistical methods suitable for unevenly spaced samples. Although they found that radio outbursts tend to repeat every years, there is no evidence for flux modulation at the proposed precession period.
The non-detection of flux periodicity at the precession period is not necessarily a serious objection to the precession hypothesis since a large fraction of the total radio flux arises from the extended jet which clearly does not systematically vary in position angle (Denn, Mutel, and Marscher 2000; Stirling et al. 2003).
5 Summary
We have searched for confirmation of the periodic inner-core orientation changes reported by Stirling et al. (2003) in the parsec-scale radio jet of the AGN BL Lac. We analyzed 43 GHz VLBA observations over ten epochs from 1998.76 – 2003.82 which overlap the time range reported by Stirling et al. As expected, the resulting maps are very similar in quality and angular resolution to those of Stirling et al. Using a Gaussian model-fitting procedure similar to that of Stirling et al. (2003) but with different criteria for estimating the uncertainties, we find:
-
1.
We confirm (at 95% confidence) variability of the structural position angle (SPA) of the the inner core. The acceptance probability of the null hypothesis (no variation) was for the one and two-component Gaussian model fits to the inner core.
-
2.
Our SPA orientation measurements are consistent with those of Stirling et al. (2003) during overlapping epochs, after multiplying their uncertainties by a constant factor of 1.5. This adjustment also makes their periodic model agree (in a statistical sense) with their SPA data: The acceptance probability is reduced from to .
-
3.
Our SPA data is best-fit by periodic functions with periods 12.0 yr () and 12.1 yr () for one and two-component Gaussian models respectively. However, the 2.29 yr periodic model of Stirling et al. was also a plausible fit to our data (acceptance probabilities ).
-
4.
Combining the rescaled Stirling et al. (2003) SPA data with the present dataset, we find a best-fit periodic model with a period of yrs (), very close to the 2.29 year period found by Stirling et al..
-
5.
Using the best-fit model, a test of agreement with three SPA measurements made since the last Stirling et al. (2003) epoch (2000.6- 2003.78) results in an acceptance probability , i.e. rejection of the periodic model at slightly less than confidence.
If the relativistic jet is precessing, the consequent variation in line-of-sight angle implies periodic flux modulation of the inner core component. We estimate the flux ratio to be 1.1 to 2.5 based on jet parameters modeled from studies of superluminal components (Denn, Mutel, and Marscher 2000). However, studies of the radio and optical light curve of BL Lac over several decades (Kelly, Hughes, Aller, & Aller 2003, Villata et al. 2004) find no periodic variation at the suggested precession period.
In summary, our although our SPA data provides confirming evidence for orientation variability in the inner core of BL Lac consistent with the measurements of Stirling et al. (2003), the evidence for periodic variations is less compelling. A definitive resolution will require continued monitoring of the inner core radio structure over several periods.
References
- Abraham & Romero (1999) Abraham, Z. & Romero, G. E. 1999, A&A, 344, 61
- Aloy et al. (2003) Aloy, M., Martí, J., Gómez, J., Agudo, I., Müller, E., & Ibáñez, J. 2003, ApJ, 585, L109
- Blaes, Lee, & Socrates (2002) Blaes, O., Lee, M. H., & Socrates, A. 2002, ApJ, 578, 775
- Britzen et al. (2000) Britzen, S., Witzel, A., Krichbaum, T. P., Campbell, R. M., Wagner, S. J., & Qian, S. J. 2000, A&A, 360, 65
- Britzen et al. (2001) Britzen, S., Roland, J., Laskar, J., Kokkotas, K., Campbell, R. M., & Witzel, A. 2001, A&A, 374, 784
- Denn, Mutel, and Marscher (2000) Denn, G. R., Mutel, R. L., and Marscher, A. H. 2000, ApJS 129, 61.
- Gabuzda & Cawthorne (2003) Gabuzda, D. C. & Cawthorne, T. V. 2003, MNRAS, 338, 312
- Hummel et al. (1997) Hummel, C. A., Krichbaum, T. P., Witzel, A., Wuellner, K. H., Steffen, W., Alef, W., & Fey, A. 1997, A&A, 324, 857
- Katz (1997) Katz, J. I. 1997, ApJ, 478, 527
- Kelly, Hughes, Aller, & Aller (2003) Kelly, B. C., Hughes, P. A., Aller, H. D., & Aller, M. F. 2003, ApJ, 591, 695
- Lehto & Valtonen (1996) Lehto, H. J. & Valtonen, M. J. 1996, ApJ, 460, 207
- Linfield (1981) Linfield, R. 1981, ApJ, 250, 464
- Lister et al. (2003) Lister, M. L., Kellermann, K. I., Vermeulen, R. C., Cohen, M. H., Zensus, J. A., & Ros, E. 2003, ApJ, 584, 135
- Lovell (2000) Lovell, J. 2000, Astrophysical Phenomena Revealed by Space VLBI, Proceedings of the VSOP Symposium, held at the Institute of Space and Astronautical Science, Sagamihara, Kanagawa, Japan, January 19 - 21, 2000, Eds.: H. Hirabayashi, P.G. Edwards, and D.W. Murphy, Published by the Institute of Space and Astronautical Science, p. 301-304., 301 (http://www.atnf.csiro.au/people/jlovell/difwrap/).
- Murphy, Preston, & Hirabayashi (2003) Murphy, D. W., Preston, R. A., & Hirabayashi, H. 2003, New Astronomy Review, 47, 633
- Pursimo et al. (2000) Pursimo, T. et al. 2000, A&AS, 146, 141
- Roberts, Gabuzda, & Wardle (1987) Roberts, D. H., Gabuzda, D. C., & Wardle, J. F. C. 1987, ApJ, 323, 536
- Roos, Kaastra, & Hummel (1993) Roos, N., Kaastra, J. S., & Hummel, C. A. 1993, ApJ, 409, 130
- Schilizzi, Miley, Romney, & Spencer (1981) Schilizzi, R. T., Miley, G. K., Romney, J. D., & Spencer, R. E. 1981, Nature, 290, 318
- Shaham (1980) Shaham, J. 1980, Astrophys. Lett., 20, 115
- Shepherd (1997) Shepherd, M. C. 1997, ASP Conf. Ser. 125: Astronomical Data Analysis Software and Systems VI, 6, 77
- Sillanpää et al. (1988) Sillanpää, A., Haarala, S., Valtonen, M. J., Sundelius, B., & Byrd, G. G. 1988, ApJ, 325, 628
- Sillanpää et al. (1996) Sillanpää, A. et al. 1996, A&A, 305, L17
- Stirling et al. (2003) Stirling, A. M. et al. 2003, MNRAS, 341, 405
- Torres, Romero, Barcons, & Lu (2003) Torres, D. F., Romero, G. E., Barcons, X., & Lu, Y. 2003, ApJ, 596, L31
- Ulvestad (1999) Ulvestad, J. 1999, NRAO VLBA Memo 34, July 1999.
- Valtonen, Lehto, & Pietilä (1999) Valtonen, M. J., Lehto, H. J., & Pietilä, H. 1999, A&A, 342, L29
- Valtaoja et al. (2000) Valtaoja, E., Teräsranta, H., Tornikoski, M., Sillanpää, A., Aller, M. F., Aller, H. D., & Hughes, P. A. 2000, ApJ, 531, 744
- van Moorsel, Kemball, & Greisen (1996) van Moorsel, G., Kemball, A., & Geisen, E. 1996, in Astronomical Data Analysis Software and Systems V, ed. G. H. Jacoby & J. Barnes (San Francisco: ASP), 37.
- Villata et al. (2004) Villata, M., et al. 2004, å, 424, 497