A deep, narrow –band search for proto–galactic Ly emission at redshifts ††thanks: Based on observations collected at the European Southern Observatory, Chile (ESO Programme 69.A–0330)..
Abstract
We present a deep, narrow –band search for proto–galactic Ly emission at redshifts . We combine an exceptionally deep image of the Hubble Deep Field South, obtained using a narrow band filter centred on the wavelength 1.187m using the VLT/ISAAC facility, with existing deep, broad band images covering optical to near infrared wavelengths. We search for Ly–emitting galaxies displaying a significant narrow band excess relative to the –band that are undetected at optical wavelengths. We detect no sources consistent with this criterion to the 90% point source flux limit of the NB image, . The survey selection function indicates that we have sampled a volume of approximately to a Ly emission luminosity of . We conclude by considering the potential implications for the physics of the high–redshift universe.
keywords:
galaxies: high redshift1 Introduction
1.1 The high–redshift universe
Studies of galaxies and QSOs at the highest known redshifts have historically provided some of the strongest constraints upon theories of galaxy formation and the physical state of the Inter–Galactic Medium (IGM). Observations of the high–redshift universe have been extended progressively during the past decade via a series of dedicated studies: Steidel et al. (1996) demonstrated that optical colour selection techniques, tuned to identify the spectral signature of young star forming galaxies attenuated by intervening neutral hydrogen, are highly effective at identifying large numbers (hundreds per square degree) of galaxies at redshifts . Spectroscopic observations of large samples (approximately 1000 to date) of so–called ‘Lyman–Break’ galaxies has permitted computation of the galaxy luminosity function (Steidel et al., 1999), composite stellar populations (Pettini et al. 2001; Shapley et al. 2001) and the amplitude of large scale structure variations (Giavalisco et al., 1998). Employing similar colour selection techniques, samples of distant galaxies have been extended to redshifts , with the advent of the Advanced Camera for Surveys (ACS) facility deployed on the Hubble Space Telescope (HST; Dickinson et al. 2004; Stanway et al. 2004a). Though such distant surveys constrain the volume averaged star formation rate (SFR) for a flux limited sample at early cosmic times (Giavalisco et al., 2004), detailed statistical conclusions await the compilation of larger samples. Although the detection of a Ly–emitting galaxy at a redshift was recently reported by Pello et al. (2004) following a colour–selected survey for redshift galaxies located behind well–studied gravitational lens clusters, the exact nature of the source remains contentious (e.g. Weatherley et al. 2004; Bremer et al. 2004).
Observational programmes employing narrow band (NB) imaging techniques combine the advantage of wide area imaging surveys with enhanced sensitivity to discrete spectral features. Though NB selection techniques restrict such programmes to line–emitting galaxies at specific redshifts, spectroscopic confirmation of sources pre–selected to to display strong spectral features is relatively straightforward compared to continuum selected samples. A number of NB imaging programmes have successfully extended the study of high–redshift objects from redshifts (Cowie and Hu, 1998), through redshifts (Malhotra and Rhoads 2002; Rhoads et al. 2003; Hu et al. 2004) to redshifts (Hu et al. 2002a; Hu et al. 2002b; Kodaira et al. 2003). Such studies have extended current constraints upon the star formation history of the universe to redshifts , albeit incorporating a bias toward emission line sources (i.e. unobscured star formation).
Studies of high-redshift QSOs (of greater apparent brightness than galaxies at the same luminosity distance yet presenting surface densities lower by several orders of magnitude to a given flux limit) have been revolutionised by the Sloan Digital Sky Survey (SDSS; Fan et al. 2003). Detailed study of the current sample of QSOs identified at redshifts have provided compelling evidence for the onset of neutrality of the hydrogen component of the IGM (Becker et al., 2001), the existence of sustained metal production in QSOs (Pentericci et al., 2002) and the presence of massive black holes in the universe approximately 0.9 Gyr after the epoch of recombination (Fan et al., 2001).
1.2 H I absorption: the Ly forest and the IGM
Though evidence exists that star forming structures are present in the universe at redshifts , the possibility to observe such structures is dependent critically upon the opacity of intervening material. The observed spectral energy distributions (SEDs) of high redshift sources display Lyman series absorption arising from two distinct phenomena: discrete structures and continuous, diffuse absorption. Discrete H I structures along the line–of–sight to background sources each give rise to an individual Ly absorption feature. As the absorption redshift increases, the discrete ‘forest’ of Ly absorption merges to create a blanketed region of near contiuous absorption at wavelengths blueward of the Ly transition in the background source. It is this absorption that gives rise to the Lyman–Break discontinuity present in the SEDs of all high–redshift sources. Songaila and Cowie (2002) estimate the amplitude of the Lyman Break discontinuity to be
| (1) |
from the average transmission of the Ly forest region in the spectra of a sample of 15 QSOs located over the redshift interval . However, extrapolation of this relation to redshifts is complicated as the optical depth of the intervening IGM potentially approaches and exceeds unity. The high redshift IGM can be approximated to a continuous spatial distribution of hydrogren gas. A uniform IGM becomes opaque () to wavelengths Å at a neutral hydrogen fraction of (Gunn and Peterson, 1965). As the fraction of neutral gas increases, the absorption saturates and develops a characteristic ‘damping wing’ – extending the absorption profile to wavelengths redward of Ly and potentially attenuating Ly emission in the embedded source. Spectroscopic observations of a subset of high–redshift QSOs identified within the SDSS (Becker et al., 2001) indicate the presence of absorption troughs where the line–of–sight transparency is zero, i.e. apparently indicating . However, associating extended regions of zero transmitted flux with the Gunn–Peterson (GP) effect is complicated by the requirement to disentangle the effects of line blanketing in the Ly forest from the excess absorption arising from the onset of neutrality in the IGM itself (Songaila and Cowie 2002). Although the above observations may have detected initial indications of the onset of neutrality in the IGM, it is important to note that, due to density fluctuations in the IGM and clustering of sources of ionising radiation, the apparent onset of neutrality in the IGM may be a strong function of the line–of–sight. Further observations are required to determine the extent of variations in the properties of the IGM due to these sources of cosmic variance (White et al., 2003). Furthermore, the observation of a Ly emitting galaxy at redshift (Hu et al., 2002a) is not inconsistent with observation of a possible GP effect in lower redshift QSOs. Haiman (2002), Santos (2004) and Barton et al. (2004) describe the ionising effect of a star forming galaxy embedded in a neutral IGM and note that, depending upon the exact assumptions made regarding the mass and star formation properties of the source and the physical conditions present in the IGM, the galaxy will form a local H II region of sufficient size to permit transmission of a partially attenuated Ly line and associated continuum.
In contrast to observations of absorption troughs in redshift QSO spectra, observations of the Cosmic microwave Background (CMB) have the potential to constrain the properties of the universe during the reionisation epoch optical depth regime . Observation of a positive correlation in the Wilkinson Microwave Anisotropy Probe (WMAP) CMB polarisation–temperature map at large angular scales can be interpreted as a scattering event with an optical depth – consistent with the reionisation of the universe at redshifts (Kogut et al., 2003). Although the exact variation of the mean neutral hydrogen fraction as a function of redshift is strongly model dependent, the initial WMAP results support an early commencement of the reionisation epoch.
The present paper describes a dedicated search for high–redshift star forming galaxies, employing an extension of broad and narrow–band selection techniques applied at optical wavelengths to the near infrared (NIR) wavelength regime. In particular we focus upon the application of a narrow –band filter centred at µm to detect the signature of Ly emitting galaxies located about a redshift (termed in the following text). The present work builds upon earlier searches for galaxies at extreme redshift employing a similar narrow –band approach (Parkes et al., 1994), in addition to narrow –band studies potentially sensitive to galaxies at even greater redshift (Bunker et al., 1995). The following sections are organised as follows: in Section 2 we describe the observational strategy, the choice of target field and we describe the narrow –band data acquisition and reduction. We further describe the archival data employed and the creation of a multi–colour catalogue for the field. In Section 3 we discuss source detection, completeness and contamination within the multi–colour catalogue. In Section 4 we describe candidate emission line objects detected in the field and we present our conclusions is Section 5. Unless otherwise indicated, values of , and kms-1 Mpc-1 are adopted for the present epoch cosmological parameters describing the evolution of a model Friedmann–Robertson–Walker universe. Where used, is defined as kms-1 Mpc-1.
2 Observations
2.1 Observing strategy and field selection
Following the discussion in Section 1.2 it is clear that candidate redshift galaxies will display a well defined photometric signature in a search employing optical to NIR broad band photometry with a narrow band centred on Ly emission. The combination of Ly forest and IGM absorption will result in effectively zero flux transmission at rest wavelengths Å. However, uncertainty regarding the physical state of the IGM and the potential for sources to create local H II regions ensures that a range of Ly emission properties may result from a given star forming galaxy population. Throughout this paper, we consider that a redshift Ly–emitting galaxy will display a significant narrow band excess relative to the –band, in addition to displaying a continuum break consistent with almost complete attenuation of photons at rest frame Å. In order to generate an effective survey for such sources certain additional factors must be considered:
-
1.
NIR continuum imaging data must achieve a limiting depth of . The brightest emission line galaxies confirmed at redshifts display AB magnitudes111Source magnitudes are computed using the AB system (Oke, 1974), i.e. , where is the spectral energy density within a particular passband in units of . (Hu et al., 2004)222Note that we employ this comparison as, at redshifts and , redshifted H I absorption lies at the blue edge of the and bandpasses respectively.. The additional distance modulus between a redshift and results in an additional dimming term of 1 magnitude.
-
2.
Optical imaging data must reach a limiting depth typically 1.5 magnitudes fainter than NIR data. Early–type galaxies located at redshifts can generate a spectral discontinuity between optical and NIR continuum bands of amplitude mag. (Stanway et al., 2004b). Failure to identify the continuum break directly could lead to the mis–identification of redshifted [OII]3727 emission in such sources as candidate Ly emission.
Following these considerations the Hubble Deep Field South (HDFS; Williams et al. 2000) Wide field Planetary Camera 2 (WFPC2) apex pointing (, J2000) was selected as the target field in order to exploit the high quality of optical to NIR image data available for the field. In particular, the combination of HDFS WFPC2 and Very Large Telescope (VLT) Infrared Spectrometer And Array Camera (ISAAC; Moorwood 1997) observations of the field provide images to typical depths AB=28 and AB=26 in optical and NIR bandpasses respectively (Labbé et al., 2003).
2.2 Narrow–band near infrared observations
Narrow –band observations of the HDFS WFPC2 pointing were obtained during ESO Period 69 (May 19th to September 17th 2002) employing the ISAAC facility mounted on the Nasmyth–B focus of the 8.2 meter VLT Antu telescope. The ISAAC short wavelength camera is equipped with a Rockwell Hawaii HgCdTe array. The pixel scale is 01484 pix-1 and the field size is . The read noise of the detector is 16.7 electrons and the gain is 4.5 electrons ADU-1. Observations were performed employing the NB119 filter (Figure 1). The filter has an effective width of 89.5Å and is centred at a wavelength 1.187m (corresponding to the location of Ly emission at a redshift ). The NB119 filter is particularly effective for the detection of faint emission as it is located in a region of low sky noise, largely isolated from the ‘forest’ of bright OH emission that dominates the sky background in the –band.

The science programme was allocated 32 hours of service mode observations, to be obtained in seeing conditions of 06 or better. Observations were scheduled as 32 one hour observing blocks (OBs), each consisting of ten, 300 second exposures dithered spatially according to a Poissonian random offset located within a box size of 20″ in right ascension and declination. The choice of pointing centre and dither sequence were made to produce a final NB image of the HDFS that was well matched to the available deep, broad NIR band observations obtained as part of the Faint Infra–Red Extragalactic Survey (FIRES) project (Labbé et al., 2003). The final data set consists of 42 hours of narrow band observations. This represents all usable data, including observations obtained outwith the specified observing constrains (sky transparency, moon phase and atmospheric seeing). The data consists of 420 individual science images corresponding to a total exposure time of 126,000 seconds.
2.2.1 Data reduction
Narrow band imaging data were a) corrected for varying pixel response using twilight sky exposures, b) sky-subtracted having masked array regions containing objects detected above a specified ADU level, c) corrected for both high– and low–frequency spatial artefacts, d) shifted to a common pixel scale and coadded using a suitable pixel rejection algorithm and bad pixel mask. The applied data reduction techniques are broadly similar to those described in Labbé et al. (2003) for deep observations of the HDFS and are summarised below.
Individual narrow band exposures were dark subtracted using the master dark frame obtained during each observing night. The flat field response and bad pixel masks were constructed using the flat routine in ECLIPSE333ECLIPSE is an image processing package written by N. Devillard, and is available at ftp://ftp.hq.eso.org/pub/eclipse/. Twilight flat field exposures were obtained employing a fixed exposure time and display uniformly decreasing/increasing count levels throughout a given sequence. Exposures displaying count levels less than 5000 ADUs were excluded as computation of pixel responses based upon these frames display a characteristic discontinuity at the location of the array read junction indicating the presence of a residual dark signature. The residual dark signature represents an additive effect that can be minimised by constructing the flat field frame employing twilight exposures displaying ADU levels greater than 5000. The pixel response is defined as the gradient of a linear regression fit to the set of values returned by a given pixel over the twilight sequence (the gain) normalised by the median gain of the array. Pixels displaying gain values outwith the interval [0.5,2] were defined as deviant pixels and added to the bad pixel mask. Flat field frames constructed from individual twilight sequences obtained over ESO Period 69 were compared. The pixel-to-pixel root mean square (rms) deviation between flat field frames is at the level of % per pixel. Large scale gradients in individual frames do not exceed 2%. A master flat field frame was then constructed from all suitable twilight exposures and employed to correct the pixel response in the science exposures.
The NB119 filter samples an exceptionally low sky background and relatively long individual exposure times are required to ensure that resulting images are limited by Poissonian sky noise and not by detector read noise. The median sky value in a typical 300 second exposure obtained with the NB119 filter is 300 ADU pixel-1 where the exact value varies most significantly as a function of airmass (Figure 2).

Large variations in total sky emission or the presence of gradients are not noted within a typical one hour observing sequence (10 science frames). Accurate sky subtraction can therefore be achieved employing standard techniques employing a measure of the sky in a given frame drawn from a statistical combination of science frames obtained adjacent in time. The sky contribution in each pixel within a given science frame is computed from the six adjacent frames in time. The sky contribution per pixel is estimated via scaling the six frames to a common median level and computing the average pixel value after rejection of the highest and lowest values.
Pixel values in the sky image created for each frame are biased to higher ADU levels by the contribution of astronomical sources. Therefore, the location of bright objects within individual images must be identified with an object mask and removed from second computation of the sky level. Relative integer pixel shifts generated by the dithered observing sequence are computed using the relative location of bright stars in the sky subtracted images. The 420 individual images are registered and co–added (averaged) having rejected the 10 highest and lowest pixels to produce an intermediate image. All astronomical sources displaying a peak ADU level greater than a threshold are identified within the co–added image and a set of masklets are created corresponding to the location of all objects in the dithered images. The above sky subtraction procedure is then repeated excluding pixels identified by the object masklet associated with a particular frame.
Sky subtracted images contain low level residuals (of the order of a few ADUs) at both high and low spatial frequencies. High frequency residuals arise from a residual dark signature (also termed pattern noise), the amplitude of which is related to gradients in the dark signal, i.e. it is largest at low row numbers (1,2,…) and those following the read junction (513, 514, …). This signature was removed by computing the median value of all pixels contributing to a given row, having first masked both bad pixel and object locations. Analysis of corrected images indicated a residual signature associated with the columns of each image. Therefore, the residual dark signature in each column was corrected for via application of the same procedures. Low frequency residuals largely arise from imperfect sky subtraction and are removed by fitting a slowly varying function (2nd order cubic spline) along rows and columns incorporating bad pixel and object masking.
At this stage, background corrected, sky subtracted images contain cosmic ray events and additional bad pixels not identified within the flat field computation. Cosmic rays are identified employing the PHIIRS444Pat Hall’s Infrared Imaging Reduction Software. routine crzap: each image is median smoothed over a given spatial scale and the result is subtracted from the original image. Application of a sigma threshold based upon the sky noise in each frame identifies the signature of cosmic ray events. Events thus identified are added to the bad pixel mask associated with that frame. Unidentified bad pixels remaining in each frame are identified via analysis of the rms–normalised pixel distribution in each frame with bad pixel and object masking applied. Pixels displaying absolute rms–normalised values greater than six are added to the bad pixel mask associated with the particular frame. This procedure typically identifies additional bad pixels per ten frame observing sequence. Images analysed in this manner were then registered employing integer pixel shifts and co–added employing both a bad pixel mask and a pixel rejection criteria that rejected the 10 highest and lowest values associated with a particular pixel. A pixel rejection criteria was still found to be necessary in order to exclude deviant pixels associated with objects (11% of the image area) from the co–added image.
The quality of the coadded image was improved employing a weighting scheme to optimize the image combination given variations in seeing, sky transparency and background noise within individual images. Individual shifted images, , were combined to produce a final image, , employing a weighting scheme such that , where . The applied weighting scheme respectively corrects for relative variations in sky transparency via , derived from the mean 5″ diameter aperture flux of four bright reference stars within the HDFS field, variations in background noise via, , the measured variance per pixel and variations in atmospheric seeing, , measured from the profiles of the same four bright reference stars. The distribution of image weights are normalised such that . The Full–Width at Half–Maximum (FWHM) of the Point Spread Function (PSF) in the reduced image is 047. The dimensions of the final coadded image are 29 29. A science image was created from this frame based upon pixels displaying weighted exposure times greater than a fraction 0.95 of the 126,000 on–sky exposure time. The dimensions of this science image are 22 22.
2.2.2 Flux calibrating the NB119 image
The photometric zero point for the NB119 image was computed employing 47 bright, isolated sources common to the NB119 and FIRES –band images. Assuming that the SEDs of these calibration sources display no strong discontinuities, the –band flux density provides an accurate estimate of the flux density with the NB119 filter, i.e. . Source detection was performed on the NB119 image and apertures were transformed to the FIRES image to compute magnitude values. The transformation was computed using the IRAF555IRAF is distributed by the National Optical Astronomy Observatories, which are operated by the Association of Universities for Research in Astronomy, Inc., under cooperative agreement with the National Science Foundation. routines geomap and geoxytran. Twenty bright, nucleated galaxies were employed as reference sources and the root mean square deviation of the reference sources about the computed transformation was 0.2 pixels in the – and –pixel directions. Source brightness measures were computed within 5″ diameter circular apertures and the distribution of versus NB119 instrumental magnitude was found to be linear with a gradient of unity. The relationship is displayed in Figure 3 and indicates that 1 ADU s-1 received in the NB119 image corresponds to an AB magnitude of .

2.3 Archival optical and near infrared observations
Optical to NIR broad band photometry of the HDFS is taken from the catalogue of Labbé et al. (2003). The authors employ as input material for the multi–colour catalogue seven images, corresponding to the filters, that have each been transformed and resampled to the astrometric system defined by the F814W HST image and have been convolved with a kernel that reproduces the seeing of the FIRES –band image as determined via the median FWHM of bright stars (.). Photometric measures are computed employing 07 diameter apertures and are zero pointed on the AB magnitude system. As noted in Section 2.2.2, the NB119 image is not transformed to the astrometric system defined by the FIRES catalogue images as this would require a resampling of the data and the unnecessary introduction of correlated noise between adjacent pixels within our detection image. Instead, the set of 07 diameter detection apertures generated by the NB119 image (see Section 3 below) are transformed to the FIRES astrometric system employing the transformation described in Section 2.2.2. Finally, no additional kernel is applied to correct for the slight difference in the measured seeing between the NB119 and FIRES –band image as the measured difference () is smaller than the 004 variation in seeing over the –band image reported by Labbé et al. (2003).
3 Source detection and completeness
Source detection and analysis was performed on the NB119 image using the SExtractor software package (Bertin and Arnouts, 1996). Circular apertures of diameter 07 were employed to compute source fluxes. Source detection criteria were tuned to select objects displaying at least 12 pixels above a threshold of 0.4. Prior to source detection, the image was convolved with a ‘mexican hat’ filter of FWHM 055. As a band-pass filter, the mexican hat emphasizes sources of extent comparable to its width, i.e. close to the PSF extent in this case. This was deemed an acceptable choice given the assumption that target sources will appear unresolved in both the NB119 and images.
The flux completeness limit of the NB119 image was estimated by introducing and recovering artificial sources within the field. The same analysis was performed upon the FIRES –band image for comparison. Redshift sources are assumed to be unresolved in both images. The simulation proceeded by sub–dividing each image into 2828 cells of 5″ side length. Each of the 784 cells was further divided into 256 regularly spaced points and an artificial source was constructed at each point in the grid. All simulated sources in a particular image are introduced with the same source profile and flux. The image containing the artificial sources is then added to the original image. Simulated sources possess low brightness values () and their contribution to the total photon noise per pixel is negligible. Source extraction is then performed on the image containing simulated sources. To avoid image blending among the simulated sources, the source simulation and image addition plus recovery operation is performed for each of the 256 locations within the grid of 5″ cells in the simulated frame. For each 5″ cell the detection probability is the ratio of recovered to introduced sources.
Variations in the detection probability within a given map are dominated by the local effect of bright objects within the image on the likelihood to detect and extract simulated sources. The simulation of 256 source positions within each 5″ cell generates a grid of source centroids separated by 03. The presence of a bright object within a particular 5″ cell will effectively mask all sources simulated in that cell and reduce the corresponding detection probability. The effect is highly localised and results in the apparently noisy aspect in the detection probability maps. These detection probability variations are of considerable importance to any measure of the clustering of faint sources in the field but do not compromise the estimation of the mean completeness within a given source flux interval. The mean value of the detection probability at a given flux level, computed over the entire field, corresponds to the completeness as a function of source flux and is displayed for the NB119 and images in Figure 4. Adopting the 90% point source recovery threshold as the limiting magnitude in each band generates magnitude limits of and respectively. The rms amplitude of sky counts measured in the NB image within the applied 07 aperture corresponds to a magnitude . This figure is approximately 20% higher than the rms variation anticipated from the extrapolation of background counts in raw data frames. The integrated signal–to–noise ratio (SNR) of an NB detection at is therefore 13.8. The corresponding SNR value of a –band detection at is approximately 10. The detectability of such apparently significant sources is primarily affected by the additional photon noise contributed by bright sources within the image area. We note that the computed 90% point source completeness limit of agrees well with the corresponding value of derived by Labbé et al. (2003) given the slight differences between the applied source simulation method and SExtractor source detection parameters in each case. In common with Labbé et al. (2003) we present 07 aperture photometry throughout this paper. The correction required to convert photometric measures computed in 07 apertures to 5″ apertures (which we assume to be ‘total’ measures) was determined to be 0.7 magnitudes via analysis of bright stars in the NB image.

In addition to determining the completeness properties of the NB119 image, the false detection rate was also estimated. A set of 100 artificial images, containing no objects, and displaying random background noise properties consistent with the final NB119 image, was constructed. Source extraction was performed for each artificial image and the mean false detection rate was computed. With the combination of SExtractor parameters described above, a false detection rate of 0.7 events per NB119 ‘noise’ image resulted.
4 Results
Figure 5 displays NIR narrow band excess, expressed as , versus magnitude for all sources extracted from the total area covered by the optical and NIR data for the HDFS field (Figure 6). Sources displaying and are flagged as potential emitting galaxies. This NB excess figure corresponds to a rest frame Ly equivalent width (EW) of approximately 3Å (Appendix A) and represents a deviation from the flat spectrum hypothesis at the NB magnitude threshold () – itself the 90% point source completeness limit (Figure 4).

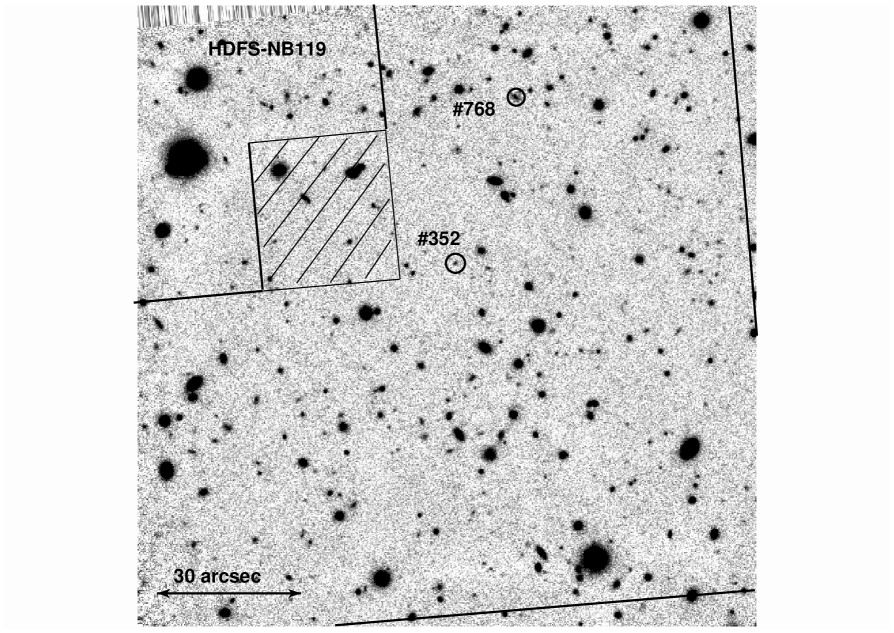
Two sources are identified by the above selection criteria, HDFS–352 and HDFS–768, where the identification numbers refer to the HDFS photometric catalogue of Labbé et al. (2003). The photometric spectrum formed by the plus NB photometry of each object is displayed in Figure 7. In each case the addition of deep optical photometry is sufficient to exclude each NB excess detection as a potential source: each NB excess object is detected in all optical bands and the photometric redshift of each source (Rudnick et al., 2001) – (HDFS–352) and (HDFS–768) – is consistent with a NB excess arising from redshifted H and H emission respectively.

Although no candidate sources are detected within the HDFS survey area, the confirmation of two sources whose photometric redshifts are consistent with the observed NB excess arising from narrow line emission lends support to the assertion that the adopted selection criteria identify faint, narrow emission line galaxies.
The Ly emission line selection function generated by the NB excess search technique is described in Appendix A. Although the applied magnitude threshold corresponds to a total flux integrated across the NB filter of , computation of the flux transmitted from a Ly–emitting galaxy located at a redshift and displaying a rest frame velocity width , requires a more detailed investigation of the applied selection criteria, the spectral response of the NB119 filter and the assumed Ly source properties. Figure 9 displays the co–moving volume sampled as a function of Ly emission luminosity for three values of the rest frame velocity width of the Ly–emitting source. For the case where the rest frame velocity width of putative sources is , the NB excess survey area samples a co–moving volume of to a Ly emission luminosity of .
5 Conclusions
No candidate Ly emitting sources at redshifts have been identified within the HDFS survey area by the selection criteria described in Section 4. Expressing the observational selection criteria in terms of the volume of the universe sampled to a given Ly luminosity permits an investigation of this null result in terms of the instrinic space density and luminosity of putative Ly emitting sources at . It must be noted however, that we currently only consider the case where the Ly emission from sources is unobscured, i.e. the escape fraction of Ly photons is unity. This scenario corresponds to the case where the Ly absorption opacity due to the intervening IGM, and to the Ly emitting source itself, is zero. Decreasing the relative fraction of Ly photons that escape from sources will increase the corresponding upper limit on the unobscured volume averaged luminosity density derived from the NB excess survey. However, the degeneracy that exists between the absorption properties of the IGM and the unobscured versus observed volume averaged Ly luminosity density at complicates a more complete investigation of the null result generated by the current NB excess survey. The range of star formation conditions required to maintain an ionised IGM at a redshift remains a subject of active discussion (c.f. Haiman 2002; Santos 2004) and is not considered further in this paper.
A more empirical approach is to consider known Ly–emitting sources and to transpose their properties to redshift . Hu et al. 2004 (hereafter H04) present a search for Ly emitting galaxies at employing a narrow band filter centred on the wavelength 8150Å. Though the H04 study does not present the highest redshift Ly sources currently known (c.f. Kodaira et al. 2003), their study is based upon near complete spectroscopic follow–up observations – 19 out of 23 observed sources (from a total sample of 26 candidates) were confirmed as Ly at – and the overall design of their study is very close to the NIR selected survey presented in this paper. H04 report a surface density of Ly emitting galaxies of 0.03 arcmin-2 to a Ly flux limit of ergs s-1 cm-2 from a total areal coverage of 700 arcmin2.
Within our adopted cosmological model, an unresolved source at a redshift is 2.7 times fainter than an identical source viewed . A further factor of 0.5 must be applied to account for the different fraction of total flux measured by the 3″ diameter apertures applied by H04 and the 07 diameter apertures employed in the current study. The H04 flux limit therefore corresponds to an approximate limit of ergs s-1 cm-2 when transposed to a redshift and employing 07 diameter apertures, i.e., assuming that no additional evolution occurs, the sources observed by H04 are sufficiently bright to be observed within our NIR selected survey. Applying the surface density of confirmed Ly emitting galaxies to the areal coverage of the current NIR survey, indicates a probability to detect a galaxy of 0.12 – assuming no evolution between the two redshifts. This ‘volume shortfall’ indicates that the current NIR selected survey will have to be extended by up to eight times the currently sampled area in order to realistically probe the no evolution scenario.
The present narrow –band selected survey has successfully demonstrated that the sensitivity required to detect putative Ly emitting galaxies emission has been achieved for the case where no evolution occurs between the redshifts and . However, it is clear that, in order to place stronger limits on the space density of such sources, the areal coverage of the current study must be extended. These observations are currently in progress and will be presented in a future paper.
Acknowledgements
The authors wish to acknowledge the members of the ESO ISAAC instrument team for their exceptional support in preparing and executing this programme. The authors further wish to thank J.P. Kneib and P.C. Hewett for useful comments during the preparation of this paper.
References
- Barton et al. (2004) Barton, E. J., Davé, R., Smith, J.-D. T., Papovich, C., Hernquist, L., Springel, V., 2004 ApJL, 604, 1
- Becker et al. (2001) Becker, R. et al., 2001, AJ, 122, 2850
- Bertin and Arnouts (1996) Bertin, E., Arnouts, S., 1996, A&AS, 117, 393
- Bremer et al. (2004) Bremer, M.N., Jensen, J.B., Lehnert, M.D., Foerster-Schreiber, N.M., Douglas, L., 2004, ApJL, accepted (astro-ph/0409485).
- Bunker et al. (1995) Bunker, A.J., Warren, S.J., Hewett, P.C., Clements, D.L., 1995, MNRAS, 273, 513
- Charlot and Fall (1993) Charlot, S., Fall, S.M., 1993, ApJ, 415, 580
- Cowie and Hu (1998) Cowie, L.L., Hu, E.M., 1998, AJ, 115, 1319
- Dickinson et al. (2004) Dickinson, M., Stern, D., Giavalisco, M., Ferguson, H.C., Tsvetanov, Z., Chornock, R., Cristiani, S., Dawson, S., Dey, A., Filippenko, A.V., Moustakas, L.A., Nonino, M., Papovich, C., Ravindranath, S., Riess, A., Rosati, P., Spinrad, H., Vanzella, E., 2004, ApJL, 600, 99
- Fan et al. (2001) Fan, X. et al., 2001, AJ, 122, 2833
- Fan et al. (2002) Fan, X., Narayanan, V.K., Strauss, M.A., White, R.L., Becker, R.H., Pentericci, L., Rix, H.-W., 2002, AJ, 123, 1247
- Fan et al. (2003) Fan, X. et al., 2003, AJ, 125, 1649
- Giavalisco et al. (1998) Giavalisco, M., Steidel C.C., Adelberger, K., Dickinson, M., Pettini, M., Kellogg, M., 1998, ApJ, 503, 543
- Giavalisco et al. (2004) Giavalisco, M., Dickinson, M., Ferguson, H.C., Ravindranath, S., Kretchmer, C., Moustakas, L.A., Madau, P., Fall, S.M., Gardner, J.P., Livio, M., Papovich, C., Renzini, A., Spinrad, H., Stern, D., Riess, A., 2004, ApJL, 600, 103
- Gunn and Peterson (1965) Gunn, J.E., Peterson, B.A., 1965, ApJ, 142, 1633
- Haiman (2002) Haiman, Z., 2003, ApJ, 578, 702
- Hu et al. (2002a) Hu, E.M., Cowie, L.L., McMahon, R.G., Capak, P., Iwamuro, F., Kneib, J.-P., Maihara, T., Motohara, K., 2002a, ApJL, 568, 75
- Hu et al. (2002b) Hu, E.M., Cowie, L.L., McMahon, R.G., Capak, P., Iwamuro, F., Kneib, J.-P., Maihara, T., Motohara, K., 2002b, ApJL, 576, 99
- Hu et al. (2004) Hu, E. M., Cowie, L. L., Capak, P., McMahon, R. G., Hayashino, T., Komiyama, Y., 2004, AJ, 127, 563
- Kodaira et al. (2003) Kodaira, K. et al. 2003, PASJL, 55 17
- Kogut et al. (2003) Kogut, A., Spergel, D.N., Barnes, C., Bennett, C.L., Halpern, M., Hinshaw, G., Jarosik, N., Limon, M., Meyer, S.S., Page, L., Tucker, G.S., Wollack, E., Wright, E.L., 2003, ApJSS, 148, 161
- Labbé et al. (2003) Labbé, I., Franx, M., Rudnick, G., Förster-Schreiber, N., Rix, H.-W., Moorwood, A., van Dokkum, P.G., van der Werf, P., Röttgering, H., van Starkenburg, L., van de Wel, A., Kuijken, K., Daddi, E., 2003, AJ, 125, 1107
- Malhotra and Rhoads (2002) Malhotra, S., Rhoads, J.E., 2002, ApJ, 565, 71
- Moorwood (1997) Moorwood, A., 1997, Proc. SPIE, 2871, 1146
- Oke (1974) Oke, J.B., 1974, ApJS, 27, 21O
- Parkes et al. (1994) Parkes, I.M., Collins, C.A., Joseph, R.D., 1994, MNRAS, 266, 983
- Pello et al. (2004) Pelló, R., Schaerer, D., Richard, J., Le Borgne, J.-F., Kneib, J.-P., 2004, A&A, 416, L35
- Pentericci et al. (2002) Pentericci, L., Fan, X., Rix, H.-W., Strauss, M. A., Narayanan, V. K., Richards, G. T., Schneider, D. P., Krolik, J., Heckman, T., Brinkmann, J., Lamb, D. Q., Szokoly, G. P., 2002, AJ, 123, 2151
- Pettini et al. (2001) Pettini, M., Shapley, A., Steidel C.C., Cuby, J.-G., Dickinson, M., Moorwood, A.F.M., Adelberger, K., Giavalisco, M., 1996, ApJ, 554, 981
- Rhoads et al. (2003) Rhoads, J.E., Dey, A., Malhotra, S., Stern, D., Spinrad, H., Jannuzi, B.T., Dawson, S., Brown, M., Landes, E., 2003, ApJ, 125, 1006
- Rousselot et al. (2000) Rousselot, P., Lidman, C., Cuby, J.-G., Moreels, G., Monnet, G., 2000, A&A, 354, 1134
- Rudnick et al. (2001) Rudnick, G., Franx, M., Rix, H.-W., Moorwood, A., Kuijken, K., van Starkenburg, L., van der Werf, P., Röttgering, H., van Dokkum, P., Labbé, I., 2001, AJ, 122, 2205
- Santos (2004) Santos, M., 2004, MNRAS, 349, 1137
- Shapley et al. (2001) Shapley, A., Steidel C.C., Adelberger, K., Dickinson, M., Giavalisco, M., Pettini, M., 1996, ApJ, 562, 95
- Stanway et al. (2004a) Stanway, E., Bunker, A.J., McMahon, R., Ellis, R., Treu, T., McCarthy, P., 2004, ApJ, 607, 704
- Stanway et al. (2004b) Stanway, E., McMahon, Bunker, MNRAS, 2004, submitted (astro–ph/0403585)
- Steidel et al. (1996) Steidel C.C., Giavalisco, M., Pettini, M., Dickinson, M., Adelberger, K., 1996, ApJ, 462, 17
- Steidel et al. (1999) Steidel C.C., Adelberger, K., Giavalisco, M., M., Dickinson, M., Pettini, 1999, ApJ, 519, 1
- Weatherley et al. (2004) Weatherley, S. J., Warren, S. J., Babbedge, T. S. R., 2004, MNRAS, submitted (astro–ph/0407150)
- White et al. (2003) White, R.L., Becker, R.H., Fan, X., Strauss, M.A., 2003, AJ, 126, 1
- Williams et al. (2000) Williams, R. E., Baum, S., Bergeron, L. E., Bernstein, N., Blacker, B. S., Boyle, B. J., Brown, T. M., Carollo, C. M., Casertano, S., Covarrubias, R., de Mello, D. F., Dickinson, M. E., Espey, B. R., Ferguson, H. C., Fruchter, A., Gardner, J. P., Gonnella, A., Hayes, J., Hewett, P. C., Heyer, I., Hook, R., Irwin, M., Jones, D., Kaiser, M. E., Levay, Z., Lubenow, A., Lucas, R. A., Mack, J., MacKenty, J. W., Madau, P., Makidon, R. B., Martin, C. L., Mazzuca, L., Mutchler, M., Norris, R. P., Perriello, B., Phillips, M. M., Postman, M., Royle, P., Sahu, K., Savaglio, S., Sherwin, A., Smith, T. E., Stiavelli, M., Suntzeff, N. B., Teplitz, H. I., van der Marel, R. P., Walker, A. R., Weymann, R. J., Wiggs, M. S., Williger, G. M., Wilson, J., Zacharias, N., Zurek, D. R., 2000, AJ, 120, 2735
Appendix A The emission line selection function for the NB119 filter and the volume sampled as a function of Ly emission luminosity
The survey sensitivity to Ly emission at a redshift may be quantified by considering the volume sampled as a function of Ly emission luminosity. In order to constrain the volume averaged Ly emission at redshifts , a detailed understanding of the emission line selection function generated by the NB119 filter is required, i.e. the probability to identify an emission line of given total flux, velocity width and central wavelength.
The flux ratio implied by the selection criterion corresponds to an oberved frame Ly equivalent width limit of 27Å666The effective width of the NB119 filter is 85.3Å. We do not consider the attenuation of the putative emission spectrum by the intervening IGM in this calculation. However, as the NB119 spectral response lies very close to the blue wavelength cut–off of the filter, partial absorption of the flux compared to the NB119 flux is not considered to be a major systematic uncertainty., or 2.8Å in the rest frame of a source. For comparison, the observed frame EW limit employed by H04 is approximately 110Å. The lower limit achieved in the current study results from a lower narrow– minus reference–band selection limit and the use of a narrower filter. The applied magnitude threshold corresponds to a total flux integrated across the NB filter of . The above EW threshold therefore indicates that the Ly emission flux contributing to this NB flux is approximately one–third of the total received flux, i.e. . The flux sensitivity calculation is applicable to continuum sources of spectral slope similar to the mean slope of bright calibration sources within the HDF South (stars and bright galaxies), i.e. (Section 2.2.2). However, computation of the emission line selection function requires the colour term describing the fractional difference in flux received from an emission line of particular velocity width and central wavelength (assuming a Gaussian line profile) compared to the mean calibration source. The NB119 filter transmits approximately 85% of the total flux received from a narrow emission line located at the central wavelength of the filter. The fraction of the incident flux received from a Gaussian emission line of varying velocity width and central wavelength, , may be computed by convolving the emission line profile with the spectral response of the NB119 filter, i.e.
| (2) |
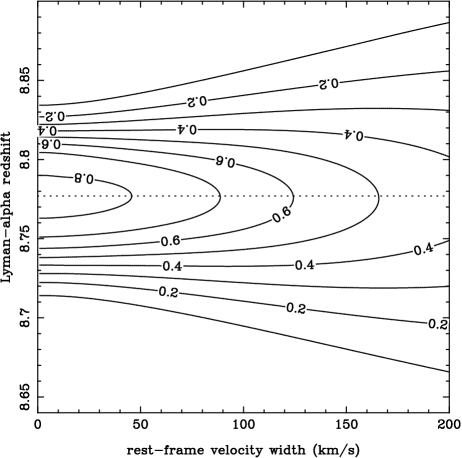
where is a Gaussian line profile of central wavelength, , and observed–frame velocity width, . The NB119 filter response is given by . The quantities of central wavelength and velocity width are readily expressed as redshift, , and rest frame velocity width, , assuming that the emission is Ly. Contours describing are displayed in Figure 8. We do not consider the case where the Ly emission profile is non–Gaussian.
As noted above, a source satisfying and corresponds to a transmitted Ly emission flux . The incident Ly flux, , is equal to this transmitted flux divided by the transmitted fraction, i.e.
| (3) |
The flux limit for a line of fixed rest frame velocity width corresponds to a varying Ly emission luminosity limit as a function of redshift within the assumed cosmological model according to , where is the luminosity distance as a function of redshift. The co–moving volume sampled as a function of Ly emission luminosity, is then expressed as
| (4) |
where corrects for the photometric completeness (), d is the survey solid angle, and
Figure 9 displays the volume sampled as a function of Ly emission luminosity by the NB119 image presented in this paper. Three rest frame velocity width values are considered to demonstrate the dependence of the luminosity versus volume sampled values upon the assumed velocity width. The analysis indicates that the NB survey selection criteria sample a volume of approximately 340 Mpc3 to a Ly emission luminosity of ergs s-1 in the case where the rest frame velocity width of the source is .
