The dust SED in the dwarf galaxy NGC 1569: Indications for an altered dust composition?
Abstract
We discuss the interpretation of the dust SED from the mid-infrared to the millimeter range of NGC 1569. The model developed by Désert et al. des90 including three dust components (Polyaromatic Hydrocarbons, Very Small Grains and big grains) can explain the data using a realistic interstellar radiation field and adopting an enhanced abundance of VSGs. A simple three-temperature model is also able to reproduce the data but requires a very low dust temperature which is considered to be unlikely in this low-metallicity starburst galaxy. The high abundance of Very Small Grains might be due to large grain destruction in supernova shocks. This possibility is supported by ISO data showing that the emission at 14.3 m, tracing VSGs, is enhanced with respect to the emission at 6.7 m and 850 m in regions of high star formation.
1 Introduction
The dust abundance and properties in galaxies are expected to depend on their metallicity and interstellar radiation field (ISRF). In fact, the IRAS colours in dwarf galaxies are found to be different from those in spirals mel94 implying that the low-metallicity environment in these galaxies indeed has an effect on the dust. NGC 1569 is a nearby (2.2 Mpc) dwarf galaxy in a post-starburst phase but still exhibiting a high star formation rate. It is an excellent candidate to study the dust amount and properties in a low-metallicity (12+log(O/H)=8.19) galaxy with a high ISRF.
We observed NGC 1569 at 1200 m with MAMBO at the IRAM 30m telescope and at 450 and 850 m with SCUBA at the JCMT between 1998 and 2000. A detailed description of the observations, data reduction and modelling is given in Lisenfeld et al. lis02 . Here we give a summary of the observations and modelling, compare them to more recent results and include a discussion of the spatial variations of the dust SED.
2 The data
We determined total galaxy flux-densities from the maps at 450, 850 and 1200 m by integrating them over increasingly larger areas until the cumulative flux-densities converged to a final value. However, it was found that low-level emission from NGC 1569 extended over most of the SCUBA field of view of 2 arcmin due to the relatively large size of NGC 1569. This low-level emission made a reliable determination of the zero-level of the maps impossible. Fortunately, this was not a problem with the larger IRAM 1200 m field. Therefore, we solved the problem by fitting the 850 and 450 m cumulative growthcurve to the scaled growthcurve at 1200 m, increasing the total fluxes at 850 and 450 m by about 30% in this way.
The data, together with the IRAS data at 12, 25, 60 and 100 m taken from the IRAS Point Source Catalog, indicate various pecularities in comparison to spiral galaxies. The high 25/12 m ratio indicates that the PAH contribution, dominating the 12 m emission of our Galaxy, must be low with respect to the contribution of Very Small Grains dominating at 25 m. Furthermore, we found a high 25/850 m ratio and a relatively flat spectrum in the (sub)millimeter range.
3 Modelling the dust SED

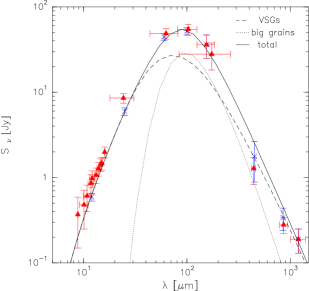
We used the model of Désert et al. des90 (hereafter DBP90) in order to fit the data. This model includes three components: (i) big grains that are in equilibrium with the ISRF, (ii) stochastically heated Very Small Grains (VSGs) and (iii) Polyaromatic Hydrocarbons (PAHs). Since we only have a limited number of the data points we did not try to exploit the full parameter range of this model and only changed the relative contribution of the three components. We used the ISRF shown in Fig. 1 (left) derived from ultraviolet to infrared observations of NGC 1569 and corrected for Galactic extinction which is globally much more important than intrinsic extinction in NGC1569.
In Fig. 1 (right) we show the best fit result, together with our (sub)millimeter data and the IRAS data points. As stated above, the low 12/25 m ratio indicates a relatively low contribution of PAHs with respect to the VSGs. Within the limited data, we are not able to constrain the contribution of PAHs any further and therefore do not include them in the fit here. The contribution of VSGs with respect to big grains is enhanced by a factor of 5.3 in this fit with respect to the Galactic value. Varying the ISRF in a reasonable way, we found that enhancements of the VSGs between factors of 2 and 7 give good fits to the data. In our fit the VSGs are responsible both for the mid-infrared and for the (sub)millimeter emission. Their broad emission spectrum is due to (i) the broad temperature range and (ii) the fact that the frequency dependence of their dust emissivity is assumed to be (DBP90).
In this figure we also include data by Galliano et al. gal03 . The agreement is generally good with the exception of the data point at 60 m and the SCUBA points which are lower than ours. The difference between the two sets of SCUBA data can be explained by the aperture correction that we applied.
As an alternative we tested a multi-temperature model. Because of the limited amount of data points we were only able to constrain three temperature components. In spite of the simplicity of the model, the results are expected to give a reasonable upper limit to the cold dust temperature. We needed very cold dust temperatures in order to explain the relatively high flux and the flatness of the spectrum in the (sub)mm range. The best fit to the data was achieved with a cold dust temperature of 7 K. A dust temperature of 11 K still yielded acceptable agreement with the data within the error limits. Such low dust temperatures can only be achieved in clouds with a very high opacity and a low filling factor gal03 . However it needs to be tested whether the overall emission of such clouds in the high ISRF of NGC 1569 is in agreement with the observed dust SED of NGC 1569.
4 Spatial variations of the dust SED


Haas et al. haa00 compared ISO images at 6.7m and 14.3m to SCUBA images at 850 m. They found that the emission at 14.3m in NGC 1569 is enhanced with respect to 6.7m and 850m in regions of high dust emission, corresponding to regions of high star formation. A similar enhancement was found in the nuclear region of NGC 6946 and in the starbursting overlap region in Arp 244. In spiral galaxies like NGC 891 or NGC 7331, on the other hand, there is a very close correlation between the emissions at 6.7m, 14.3m and 850m.
This indicates that there is a relation between the star formation intensity and the abundance of VSGs which are dominating the emission at 14.3m. A possible interpretation is that the supernova shocks produced by the star formation destroy the large dust grains by grain-grain collisions bor95 ; jon96 .
The comparison of the maps at different wavelengths in haa00 show that for NGC 1569 the ratio between 6.7m and 850m is constant with a value of (and the ratio between 7.7m, coinciding with a peak in the PAH emission, and 850m is similarly constant with a ratio of ) whereas the ratio between 14.3m and 6.7m is 1 in low emission regions and up to 10 in high-emission regions. In Fig. 2 we fit the two sets of data points with the model of DBP90. The emission in low-emission region is very similar to the emission of our Galaxy and can be fitted by a low ISRF and solar neighborhood abundances of VSGs and PAHs. In regions where the emission at 14.3m is increased with respect to 6.7m, 7.7m and 850 m, an ISRF as in NGC 1569, an enhanced abundance of VSGs and a decreased abundance of PAHs are able to explain the observations.
References
- (1) Borkowski, K.J., Dwek, E., 1995, ApJ, 90, 1163
- (2) Désert, F.–X., Boulanger, F., Puget, J.L., 1990, A&A, 237, 215 (DBP90)
- (3) Haas, M., Klaas, U., Bianchi, S., 2000, A&A, 385, L23
- (4) Israel F.P., 1988, A&A, 194, 24
- (5) Jones, A.P., Tielens, A.G.G.M., Hollenbach, D., J., 1996, ApJ, 469, 740
- (6) Galliano, F., Madden, S.C., Jones, A.P., Wilson, C.D., Bernard, J.-P., Le Peintre, F., 2003, A&A 407, 159
- (7) Lisenfeld, U., Israel, F.P. Stil, J., Sievers, A., 2002, A&A 382, 860
- (8) Melisse, J.P.M, Israel, F.P., 1994, A&A 285, 51