Applications of precision astrometry to studies of massive YSOs
Abstract
We present VLBI observations of the H2O maser emission towards a selection of massive young stellar objects (YSOs). In one of these sources, IRAS20126+4104, the measured proper motions confirm that the H2O masers spots are tracing the very root ( 100 AU) of a conical bipolar outflow emerging near the position of the embedded YSO, and are an excellent tool to investigate the structure and kinematics of the outflow/jet. We also present preliminary results of a first epoch EVN observations of a selection of 5 high-mass YSO to assess the precise association of maser spots and molecular outflows in these sources.
1 Introduction
There is still much to learn about the role played by molecular outflows
in the context of star formation processes.
This phenomenon presents many interesting aspects
ranging from the possible role in supporting molecular clouds against
gravitational collapse, to the collimation mechanism, to the velocity
structure of the outflows on different scales. From an observational
point of view, answering these questions is equivalent to attaining the best
possible picture of an outflow in space and velocity. Since the outflowing
material is mostly molecular, normally the means used to image these
objects are the transitions of molecules such as CO, HCO+, and a few
others (see e.g. Bachiller and Pérez Gutiérrez, 1997),
which usually lie in the millimeter range. However, these tracers
can be used only to map the large scale structure of the flow (0.1-1 pc)
and not the very root of it, which is likely to convey the most important
information on the ejection mechanism, being very close to the central
engine. Such a region has a size of a few 10 AU, not accessible even with
the most powerful millimeter interferometers, but easy to study with VLBI
techniques at centimeter wavelengths. The molecular transitions commonly used
to map outflows lie in the millimeter range; however, molecular outflows
from high-mass YSO are often associated with H2O maser emission at 22 GHz
(Felli et al. 1992), which hence represents the best tracer for studies of the
flow at a small scale. Water masers have very large brightness temperatures,
which make them ideal targets for VLBI studies.
With this in mind we have carried out VLBI observations of H2O
masers in a selection of high-mass young stellar objects which belong to
the list studied by Tofani et al. ([1995]) with the VLA in the
most extended configuration, to take one step further in the analysis of
spatial distribution and kinematics of the masers.
The case of IRAS20126+4104 deserves special mention due to the numerous
studies of different molecular tracers on scales ranging
from 100 AU to 1 pc
(Cesaroni et al. 1997; Zhang et al. 1998; Cesaroni et al. 1999a; Hofner et al.
1999; Zhang et al. 1999)
that resulted in the detection of a rotating Keplerian
disk around the YSO and a detailed analysis of the jet/outflow, with the
large scale outflow being fed by a narrow jet, which is ionised on a scale
of (1700 AU) and becomes neutral on (0.16pc).
IRAS20126+4104 is considered to be the most convincing case of a disk-outflow
system in a massive YSO. Moreover, our VLBI observations of H2O
maser emission (Moscadelli et al. 2000) showed a very good agreement
with a jet model
which assumes that the masers arise on the surface of a conical bipolar jet,
at the interaction zone between the ionised jet and the surrounding neutral
medium. Hence the spots are tracing the very root ( 50 AU) of a
bipolar outflow.
Follow up proper motion measurements of the H2O maser spots with
new multi-epoch VLBI observations have
proved the uniqueness of this interpretation. Throughout this paper we
assume a distance to IRAS20126+4104 equal to 1.7 kpc.
The encouraging results found for IRAS20126+4104 provided the ground for more VLBI observations towards other sources from the Tofani et al. ([1995]) sample, aiming to assess the precise association of maser spots and molecular outflows. Table 1 lists the selected sources on the basis of the following criteria: (i) to be deeply embedded in dense molecular clumps; (ii) to be undetected in the free-free radio continuum (i.e. not associated with HII regions); (iii) to have luminosities above 1000 ; (iv) to lie close to a compact (in VLBI scales) continuum reference source (for observations in phase referencing mode). The third condition guarantees that one is dealing with high-mass YSOs,while the first two bias the sample towards the youngest, least evolved star-forming regions. For all selected sources Cesaroni et al. ([1999b]) detected high density molecular clumps around the H2O masers.
2 Observations and data reduction
We carried out VLBA 22 GHz observations of the
young massive (proto)star IRAS20126+4104 on November 21-22, 1997,for a total
of 12 hours.
The analysis of these observations proved the association of the maser
spots with the bipolar outflow and provided an estimate of the velocity
field on a scale of AU. A complete description can be found
in Moscadelli et al. ([2000]).
The study of the source was followed up with 3
VLBA+EVN (global) astrometric observations to measure H2O maser spot
proper motions. The multi epoch observations were scheduled in the course of
4 months to match the mean lifetime of maser lines, estimated on the
basis of our single dish monitoring.
The global campaign included all VLBA, and 8 EVN antennas:
Effelsberg (100m, Germany), Medicina (32m, Italy), Noto (32m, Italy),
Onsala (20m, Sweden), Jodrell Bank (25m, UK), Metsahovi (14,Finland), Sheshan
(25m, China) and DSS63 (70m, Spain)
observing on Nov. 9th and 26th, 2000, and March 1, 2001, for a total
of 18 hours, at 22 GHz. During the observations, the antennas switched
every 30 s between IRAS20126+4104 and the continuum calibrator source
J2007+4029, .5 apart. The quasar J2007+4029
belongs to the list of sources used to define the International Celestial
Reference Frame (ICRF) and has very accurate coordinates (uncertainties
in RA and DEC mas).
All stations recorded an aggregate of 16 MHz bandwidth in each (left and
right circular) polarization for each scan, centered at the LSR velocity
of -3.5 km s-1 (based upon a rest frequency of 22235.0798 MHz),
using 2-bit sampling (mode 128-2-2).
The correlation was made at the VLBA correlator in Socorro (New Mexico)
using 1024 spectral points which led to a channel separation of 0.21
km s-1.
The data reduction was done using the NRAO AIPS software package.
The information on system temperatures (Tsys), gain curves
and telescope gains measured at the individual array elements was used
to calibrate the raw correlation coefficients of the line and reference
sources. The application of standard fringe-fitting, amplitude and phase
(self-)calibration techniques produced a hybrid map of the reference
source.
The phase calibration of the line source involved a temporal
interpolation between adjacent scans on the reference source.
This strategy preserves the signature of the relative separation,
between the target and reference source pair, present in the calibrated phase.
In our series of observations the rapid antenna switching matched the
requirements for a succesfull astrometric analysis and
the Fourier Transformation of the calibrated visibility function of the line
source produced multiple “phase referenced” maps, corresponding to
different spectral channels with line emission. At each epoch, the offsets
of the maser spots from the center of the map are estimates
of the absolute position parameters in the astrometric analysis.
Moreover, a multi epoch comparison (at least 3 different epochs
in the course of year) leads to proper motion estimates.
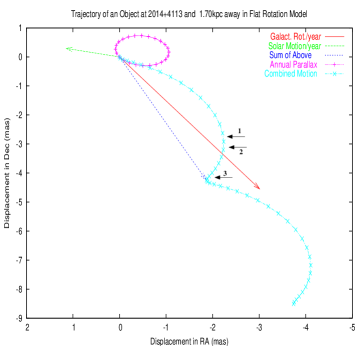
Fig. 1 shows the displacements, in RA and DEC coordinates,
for a galactic source 1.7 kpc away due to the
Galactic rotation, the annual parallax and the solar motion, for
a time span equal to 2 years.
We have implemented this “galactic motion” effect in the calculus of the
maser proper motions. A more detailed description of the analysis of the
multi epoch observations will be given in Moscadelli et al.
([2004]).
Also, EVN observations of H2O maser emission towards other 5 high-mass young stellar objects, along with nearby ( apart) continuum calibrator sources, were carried out on February 10-11, 2004. We observed with an array of 9 antennas for a total duration of 15 hours, at 22 GHz. The observing network was composed of the following antennas: Cambridge (32m, UK), Jodrell Bank (25m, UK), Effelsberg (100m, Germany), Noto (32m, Italy), Onsala (20m, Sweden), Metsahovi (14m, Finland), Sheshan (25m, China) plus 2 other antennas wich failed to produce interferometric fringes. At the observations, all stations used a similar configuration as the one described above for IRAS20126+4104. For a given pair of line/continuum calibrator sources the recorded bandwidth was centered at the LSR velocity of the line source (based upon a rest frequency of 22235.0798 MHz), derived from single dish observations obtained with the Medicina radiotelescope few days before the VLBI run. The processing of the data was done at the JIVE correlator, in Dwingeloo, using 1024 spectral channels. For most of the time the antennas were switching, with 3 minutes duty cycles, between the 2 sources at each pair. This sequence was interrupted every 2 hours with 3 minutes scans on the continuum calibrator sources 3C84 and 0528+134. Our preliminary analysis of the EVN observations does not implement phase referencing techniques, and follows the standard procedure for the analysis of spectral line data within AIPS.
3 The interesting case of IRAS20126+4104
Our previous single epoch VLBA observations (Moscadelli et al. 2000)
detected 26 H2O maser spots spread over a region of
(1200 AU).
The VLBI data are in excellent agreement with the predictions of a
model which assumes that the H2O masers lie on the surface of a conical
bipolar jet, and expand radially away with constant velocity from a
common centre coincident with the position of the YSO. Figure 5 in
Moscadelli et al. (2000)
show a map with the spatial distribution of the H2O maser spots and
a comparison
between the spot LSR velocities observed and computed from the
best fit of the free parameters of the model (vertex position, opening angle
of the cone, inclination of the cone axis with respect to the line of
sight, and velocity of the spots).
Fig. 2 shows the map of the H2O maser spots for the new
multi epoch global observations, along with measured proper motions.
The best fit of model parameters to the data from multi epoch global
observations is obtained for a well collimated
(semi opening angle=170) conical bipolar jet model
with the vertex near the peak of the 3.6 cm and 7 mm continuum emission
recently observed with the VLA (Hofner personal comm.),
and its axis closely aligned to the plane of the sky (the angle between the
jet axis and the line of sight is 960) and with the direction of measured
proper motions (position angle north-to-east=1220).
The fit of the multi epoch observations
implements a Hubble velocity outflow, with a variation of the velocity
proportional to the distance to the vertex of the cone.
Fig. 3 shows a comparison between the observed maser
velocity components and those obtained from the best model fit.
Given the goodness of the fit, the new results prove the uniqueness
of the interpretation proposed by Moscadelli et al. ([2000]),
thus validating the use of H2O masers as excellent tools
to investigate the structure and kinematics of the jet/outflows
in massive YSOs.
The combination of the proper motion measurements, from the astrometric
analysis of the multi epoch observations, and the velocities along the
line of sight, allows us to compute total velocities. We
stress that this is completely independent of the conical model.
The measured total velocities of the H2O maser spots are in a range
between 11 km s-1 and 113 km s-1, with most of them with
velocities around 60 km s-1.
This value is larger than our previous estimate (23 km s-1),
from the best fit of the single VLBA observations to the conical model
(Moscadelli et al. 2000). Interestingly, the new velocities are closer
to the values estimated by Cesaroni et al. (1999a) from the SiO jet,
between 60 and 200 km s-1, on a much larger scale.
| Source | Radio Coordinates (B1950) | Peak Flux | Integ. Flux | velocity (km s-1) | |||
|---|---|---|---|---|---|---|---|
| Component | R.A. | Decl. | (Jy) | (Jy km s-1) | |||
| NGC281-W | 00 49 28.233 | 56 17 26.408 | 9.38 0.48 | 17.66 0.46 | -27.9 | -39.8 | -25.9 |
| S233 | 05 35 51.199 | 35 44 12.975 | 5.39 0.27 | 12.29 0.29 | -16.9 | -18.9 | -14.3 |
| S235 B | 05 37 31.864 | 35 40 17.775 | 165.73 8.29 | 257.51 6.38 | -61.2 | -69.1 | -55.3 |
| GGD 12-15 | 06 08 25.662 | -06 10 49.60 | 104.67 5.24 | 240.48 4.71 | -22.6 | -31.8 | -11.4 |
| NGC2264 | 06 38 25.385 | 09 32 14.459 | 44.18 2.21 | 60.55 1.89 | 7.1 | 6.5 | 9.1 |


4 Preliminary Results on other YSOs
In this section we present very preliminary results of a H2O maser survey performed by us towards a sample of 5 massive YSOs similar to IRAS 20126+4104 (see Table 1). All of our maser sources are associated with molecular outflows, have luminosities in excess of 2000 , and are not associated with a detectable HII region (see Tofani et al. 1995). Although the data reduction is still in progress and only maps for the most intense spectral features have been produced so far, we may summarize the results obtained for two of the sources: NGC281-W and GGD 12-15.
NGC281-W
Fig. 4 (upper) shows the total power spectrum obtained with the Effelsberg radiotelescope. The systemic LSR velocity, derived from single dish observations is indicated with a dotted line. The labels on top of the most prominent features correspond to the velocities of the channels, in units of [km s-1], for which we have produced maps.
The lower plot in Fig. 4 shows the distribution of
H2O maser spots corresponding to the most prominent features in the total
spectrum shown above.
The location of the spots is given by the crosses, whose size is proportional
to the square root of the peak flux in the individual maps for the velocities
indicated aside. The channel containing the most prominent peak
of emission (velocity -31.5 km s-1) was selected as reference in the
analysis, and corresponds to the spot with null righ ascension and declination
offsets in the map.
The other spots correspond to emission from secondary peaks in the total
spectrum, with red-shifted emission with respect to the systemic LSR velocity
of the bulk material (velocities -6.3,-0.6 and -20.6 km s-1).
The spots in the map appear aligned along NW-SE direction. This direction
does not seem to coincide with that from larger scale structures seen in
observations of other outflow tracers (Cesaroni et al. 1999b, and references
herein). On the other hand, large scale structures can also be affected by the
presence of multiple outflows arising from a common star forming region.


GGD 12-15
Fig. 5 (upper) shows the total power spectrum obtained with the Effelsberg radiotelescope, along with the systemic LSR velocity obtained from single dish observations (dotted line). Also, it includes labels indicating the velocity of the dominant features in the spectrum, for which we have produced maps.
The lower plot in Fig. 5 shows the distribution of H2O maser spots corresponding to the most prominent features in the total spectrum shown above. The sizes of the crosses, and the labels in the plot have the same meaning as explained for the other source. In the analysis, the channel with the most prominent peak of emission (velocity -30 km s-1) was selected as reference. The spots corresponding to secondary peaks of emission in the total spectrum are located on opposite sides of the reference maser feature, but the fact that all spots are blue-shifted does not seem to support an association of the H2O maser emission with a bipolar outflow, although this cannot be ruled out (see the case of IRAS20126+4104). In fact, the (NW-SE) direction of H2O maser emission in our phase referenced maps is in agreement with that of J=2-1 CO line emission from the bipolar outflow detected by Little et al. 1990.


5 Conclusions
We have used global VLBI multiepoch observations to study the H2O maser emission towards IRAS 20126+4104, using phase referencing techniques. The map of the H2O maser spots, along with the measured proper motions, prove that the water masers are clearly tracing a well collimated outflow. Hence, are excellent tools to investigate the structure and kinematics of molecular jet/outflows in massive YSO.
We aim to extend the observations to a larger sample of protostars, selected from the Tofani et al. (1995) catalog. With that in mind, we have observed a first epoch EVN observations of a selection of 5 YSOs, and preliminary results have been presented in that paper. We must wait for a more detailed analysis before drawing any conclusion.
References
- [1997] Bachiller, R., Pérez Gutiérrez, M. 1997, ApJ, 487, L93
- [1997] Cesaroni, R., Felli, M., Testi, L. Walmsley, C.M., Olmi, L. 1997, A&A, 325, 725
- [1999a] Cesaroni, R., Felli, M., Jeness, T. 1999a, A&A, 345, 949
- [1999b] Cesaroni, R., Felli, M., Walmsley, C.M. 1999b, A&AS, 136, 333
- [1992] Felli, M., Palagi, F., Tofani, G. 1992, A&A, 255, 293
- [1999] Hofner, P., Cesaroni, R., Rodríguez, L.F., Martí, L.F. 1999, ApJ, 345, L43
- [2000] Moscadelli L., Cesaroni R. and Rioja M. 2000, A&AS, 360, 663
- [2004] Moscadelli L., Cesaroni R. and Rioja M. 2004, in preparation
- [1995] Tofani, G., Felli, M., Taylor, G.B., Hunter, T.R. 1995, A&AS, 112,299
- [1998] Zhang, Q., Hunter, T.R., Sridharan, T.K. 1998, ApJ, 505, L151
- [1999] Zhang, Q., Hunter, T.R., Sridharan, T.K., Cesaroni, R. 1999, ApJ, 527, L117