VLT-UVES observations of the Balmer line variations of Carinae during the 2003 spectroscopic event
Abstract
We present high spectral resolution echelle observations of the Balmer line variations during the 2003.5 “spectroscopic event” of Carinae. Spectra have been recorded of both Carinae and the Homunculus at the FOS4 position in its SE lobe. This spot shows a reflected stellar spectrum which is less contaminated by nebular emission lines than ground-based observations of the central object itself. Our observations show that the spectroscopic event is much less pronounced at this position than when seen directly on Car using HST/STIS. Assuming that the reflected spectrum is indeed latitude dependent this indicates that the spectral changes during the event seen pole-on (FOS4) are different from those closer to the equator (directly on the star). In contrast to the spectrum of the star, the scattered spectrum of FOS4 always shows pronounced P Cygni absorption with little variation across the “spectroscopic event”. After that event an additional high-velocity absorption component appears. The emission profile is more peaked at FOS4 and consists of at least 3 distinct components, of which the reddest one shows the strongest changes through the event. The data seem to be compatible with changes in latitudinal wind structure of a single star, with or without the help of a secondary star, or the onset of a shell ejection during the spectroscopic event.
1 Introduction
Car is among the most massive and luminous unstable stars of our Galaxy. During its “great eruption” (about 1838-1858) it became one of the visually brightest stars in the sky. Today the star itself is hidden in a bipolar nebula known as the Homunculus. It is, due to the dust within the expanding lobes scattering light from Car, mainly a reflection nebula (for example Thackeray, 1956, 1961; Visvanathan, 1967; Warren-Smith et al., 1979; Allen & Hillier, 1993).
Temporary spectral changes were recorded on several occasions beginning in 1948 (see references cited by Damineli et al., 1999), and occur approximately every 5.5 years (Damineli, 1996). The same timescale had earlier appeared in infrared photometry (Whitelock et al., 1994), and was confirmed by successful predictions of spectroscopic events around 1997.9 and 2003.5. In each case the excitation and ionization level of the spectrum decreased for several months (see, e.g. Zanella et al., 1984; Davidson, 1999; Davidson et al., 1999; McGregor et al., 1999; Damineli et al., 1999). At the same time the X-ray emission first peaks and then plummets during the event (Ishibashi et al., 1999b).
The 5.54-year periodicity led many authors to suggest that Car has a companion star (Damineli et al., 1997; Davidson, 1997; Ishibashi et al., 1999a). Zanella et al. (1984) have proposed earlier that each event involves a shell ejection or similar event. The periodicity suggests that a companion star may regulate the cycle, but neither of these conjectures has been confirmed. In general the phenomenon has not yet been explained.
Car was observed regularly at high spatial resolution with HST/STIS from 1998 through 2002 to separate the star from its nearby ejecta which contaminates all ground-based spectroscopy. The HST Treasury Project carried out an intensive monitoring with more frequent observations during its 2003 “spectroscopic event”. To complement this program with improved temporal sampling during the “event” we observed Car with the Ultraviolet and Visual Echelle Spectrograph UVES, at the European Southern Observatory (ESO) between December 2002 and March 2004. We observed the reflected spectrum of the star at the FOS4 position (about 26 south and 28 east of the star; Humphreys & The HST-Fos Car Team, 1999) which allows us to view the star and the “event” from a different angle. At FOS4 there is also only a modest amount of contamination by nebular emission from the vicinity of the star (mainly the Weigelt knots at a distance of only 01 to 03 Weigelt & Ebersberger, 1986; Hofmann & Weigelt, 1988). Spectra taken on the star’s position and at FOS4 are shown in Fig. 1 for comparison. At FOS4, spectral changes in the stellar spectrum can be observed after a light-travel delay time of roughly 3 weeks. We also observed the star itself less frequently but coordinated with the HST/STIS Treasury Project.
The scattering surface in the SE lobe at the FOS4 position ‘sees’ the star from a roughly polar direction (Smith et al., 2003) while our direct line of sight sees a spectrum representative of the intermediate latitudes (Davidson et al., 2001). Thus these two lines of sight allow us to follow the event from different angles. For example, in the HST/STIS spectra of the central star, a deep P Cygni Hα absorption was present during the 1997-98 event but disappeared a few months later. Meanwhile, however, the P Cygni absorption did not disappear in the star’s spectrum reflected by dust in the southeast Homunculus lobe. A possible explanation for the P Cygni absorption discrepancy is that Car’s wind may be denser toward its poles, except during each spectroscopic minimum—as discussed by Smith et al. (2003). In any case, some important observational questions arise. To what extent does the reflected “polar” Hα profile differ from the feature that we observe directly? Does the polar Hα emission vary during a spectroscopic event, and, if so, in what manner? Here we present partial answers to these questions, and we describe some important details omitted by Smith et al. A companion paper by Davidson et al. describes the HST/STIS Balmer line observations of the central star during 2003 which significantly differed from the previous one observed in 1997-98.
2 The observations
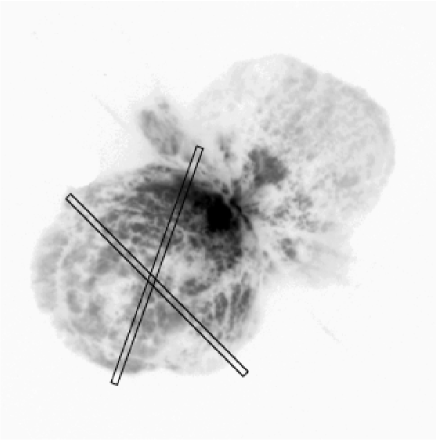
The data presented here are based on observations obtained in service mode between December 2002 and March 2004 with UVES at the Nasmyth platform B of ESO’s VLT UT2 (Kueyen) on Cerro Paranal, Chile111Programs: 70.D-0607(A), 71.D-168(A), 72.D-052(A); PI: Weis. For all observations the standard settings DIC1, 346+580 (blue arm centered at 3460 Å, red arm centered at 5800 Å) and DIC2, 437+860 (blue arm centered at 4370 Å and red arm at 8600 Å) were used. The observed wavelength range extends continuously from 3 100 Å to 10 200 Å except for small gaps due to the space between the two CCDs of the detector mosaic in the red channel. The primary objective was to observe the reflected stellar spectrum at the FOS4 position (about 26 south and 28 east of the star) in the Homunculus. The slit was aligned across the SE lobe of the Homunculus at a position angle of 160. To monitor the 2003 event, spectra were taken about every week during the event (mid May to end of July) and every month before and after the event time. No spectra could be taken between mid August and late November due to the very low elevation of Car at Paranal during this time of the year. Integration times were between 1 sec (on the star) and 770 sec on the FOS4 position.
For a reference spectrum preceeding the “spectroscopic event”, we used spectra obtained during the UVES commissioning (Dec. 21, 1999) from the ESO archive. They were obtained with the identical set-up as our spectra, but with different slit orientation. The position angle of the slit was 45, i.e. about perpendicular to the axis of symmetry of the Homunculus with offset to the FOS4 center. Exposure times for these spectra were 60 sec. Observational dates of all spectra used for this analysis are listed in Table 1.
One short and one long exposure were obtained with the DIC1 (346+580 setting) to record both, the extremely bright Hα emission and the fainter lines with good signal-to-noise ratio. The slit width of all observations was 03 and 04 in the red and blue range, respectively, resulting in a spectral resolution of 80 000 in the blue and 110 000 in the red arm. The pixel scales and slit lengths were, respectively, 0246/pixel and 76 in the blue and 0182/pixel and 118 in the red arm. The data were reduced and two-dimensional spectra extracted using mostly the standard ESO pipeline software for UVES. An exception was the order-merging procedure where the ESO software did not produce satisfactory results for our data, mainly because the merging of overlapping echelle orders led to below-optimum S/N. Therefore, the order merging was carried out using software developed at the LSW Heidelberg (Stahl et al., 1999). All spectral frames were converted after reduction to the same (heliocentric) wavelength scale.
Each spectrum presented here is an average of an area of about 055 along the slit (2 rows in the blue and 3 rows in the red long slit spectra) extracted at the FOS4 position. We searched for the best extraction region in the longslit, but had to settle for this small extraction region on FOS4 to avoid smearing due to velocity shifts across the lobe. Smith et al. (2003) encountered similar limits using HST/STIS spectra. All spectra plotted in this paper are normalized to continuum being unity. Our July 26 spectrum shows the minimum in the intensities of the high excitation lines, such as He i 6678 Å and therefore represents the best “event spectrum” in our data. The November spectrum indicates that the affected lines brightened significantly afterwards.
3 Discussion
3.1 The VLT UVES spectra
The time variation of the Hα line at FOS4 is given in Figs. 3 and 4. They seem to be composites of several components. Most obvious are at least three principal emission components which are preliminarily fit by Gaussians plus a P Cygni absorption. All Gaussian profiles themselves may again be composites of several components. It is also possible that a broader absorption (e.g. on the blueshifted side) causes one component to appear as two separate ones. However, for simplicity we used three Gaussian. The centroids of the Gaussian are roughly at km s-1(FWHM km s-1), 70 km s-1 (FWHM km s-1) and 300 km s-1(FWHM km s-1). The P Cygni absorption is centered at 340 km s-1. For a comparison we show in Fig. 5 the time variation of the Hα line 48 north-west of FOS4, closer to the star.
During the event the Hα profile at FOS4 changes, and all components decrease in intensity. The most notable change is in the 300 km s-1-profile—the red hump—which disappears nearly completely. The red hump was very prominent in the 1999 spectrum and reappeared after the event in November 2003 and is present still in March 2004 (see Figs. 3, 4). Note that the red hump was already weak in December 2002, long before the event started, as evidenced by brightening in the X-ray (Corcoran, 2003) or IR domains (Whitelock et al., 2003, 2004).
The second most important change in the FOS4 Hα spectra is in the P Cygni absorption profile. Before and during the event there is almost no change in the P Cygni profile. In the more recent VLT spectra (November 2003 – March 2004), however a second component at a higher velocity—centered at about to km s-1—appears. This high velocity component is first visible in the November spectrum, is deepest in January and weaker again in the March 2004 spectrum. Its appearance cannot be explained by the light travel time, but rather shows that this change occured later and not necessarily in causal connection to the event.
The travel delay time from the star to FOS4 can be estimated from the radial velocity of the emission lines. Due to the expansion of the Homunculus the lines are blue-shifted compared to the same lines seen in the star’s spectrum. This method however is depending on a decent model of the expansion of the Homunculus and a good measurement of the radial velocities. We used several sharper [Fe ii] lines and derive a radial velocity difference of about 93 km s-1 between the star and FOS4. This yields a light travel time of approximately 20 days.
The blue emission component shows only very small changes. Of particular interest is the central 70 km s-1-emission component. It is intermediate in terms of variation between the red and the blue component.
The Hβ and Hη lines show in general the same behavior as the Hα line (Figs. 6 and 7). The development of the red hump, however, seems to be less strong going from Hα to Hη. Also the shape of the high velocity P Cygni component changes from Hα where it is more straight to Hη were a clear second dip is present.
3.2 Comparison with the HST/STIS spectra
Several differences are seen in comparison with the Hα profile profile in the HST/STIS spectra described in the Davidson et al. First a sharp absorption component roughly at 150 km s-1 is seen in the HST spectra, taken directly at the star. This component is absent in FOS4 observations, but appears in our spectra in all positions up to 13 north west of FOS4, as well as in a few observations we made centered on Car (see Fig. 1). We therefore confirm this component to be present in an extended area (roughly 3″radius) around the star in the south east lobe.
Relative to the underlying continuum level, and within the uncertainties of measurement, the UVES and HST data both show an equally strong long-wavelength wing at velocities above km s-1. This is reassuring, since wings due to Thompson scattering should be approximately isotropic in their appearance. However the line profile is not symmetric and the broadening is much larger on the redshifted side. This has been observed in supernovae (Chugai, 1977), too. A detailed analysis of the scattering processes within the Homunculus is definitely needed to better understand this asymmetry, but lies beyond the scope of this paper and will therefore be addressed elsewhere. It is nevertheless important since high velocity components in the P Cygni absorption might not be visible, or be much deeper due to the presence of Thompson scattering wings.
The shape of the Hα profile in the HST spectra recorded during the 2003 event is mainly flat-topped and has changed since the last event in 1998 in which the shape was more rounded (see Davidson et al.). Contrary to this Hα profile we observe at FOS4 (as discussed above) a more complex structure of the emission. This is not an effect of the spectral resolution, but an intrinsic difference of the two sight lines.
Before and during the event there is little or no change in the P Cygni profile as viewed from the FOS4 position, the absorption trough is rather stationary at 340 km s-1, and only marginally deepens and broadens during the event (by about 50 km s-1; Figs. 3 and 4). This is in remarkable contrast to the HST observations. There, the P Cygni absorption is absent before the event, develops during the event and lies at about 500 km s-1. Taking the expansion velocity of the Homunculus at the FOS4 position into account, this is similar to the central velocity of the P Cygni absorption observed in FOS4. Here the absorption lies at km s-1 but is not corrected for the expansion. For a comparison of our FOS4 velocities with measurements from the star, one has therefore to subtract km s-1. Consequently the P Cygni absorption would lie around km s-1.
The central velocity component (sharp peak at 70 km s-1, see e.g. Fig. 3) is the second major difference between the UVES spectra at FOS4 and the STIS spectra of the star. Without this component, the Hα profile at FOS4 resembles the Hα profile of the star, if we ignore the much more pronounced amplitude variation in the red hump observed at FOS4. This can be understood if the central component is reflected emission from ejecta near the star visible at the FOS4 position. The peaked emission might come from a gas clump, in the vicinity of the star which would have to be bright. One other quite natural explanation would be that the peak emission is reflected and scattered light of one or more of the Weigelt knots. The Weigelt knots show extremely bright and narrow emission lines (Davidson et al., 1995). Scattering at the thick walls of the Homunculus would broaden these lines and decrease their intensity. Fig. 1 shows that velocity of the peak emission in FOS4 agrees well with the radial velocity of the Weigelt knots seen at the star. Last but not least might the peak emission have its origin in an area called the Little Homunculus (Ishibashi et al., 2003). Similar in morphology the Little Homunculus is a small nebula ( 2″ in diameter) within the Homunculus. The width of the peaked line would fit to the expansion velocity of the Little Homunculus.
3.3 Global patterns
The observations can be summarized as follows: The scattered spectrum of the Homunculus, which is representative of the more polar region of Car, is changing far less than the STIS spectrum of the core, which is representative of a more equatorial spectrum (more precise it sees the star at an angle of 45). During the “event”, the spectra of pole and equator become more similar. The change in the emission part may be partly due to changes in the equatorial region.
It has been shown that the Balmer lines seen at FOS4 show a profile somewhat different from that seen at the star. The pronounced flat-topped profile of the STIS spectra is not observed in the FOS4 UVES spectra, either because we are really seeing different stellar profiles viewing the star more pole-on or the peak central emission is an additional emission superimposed on a more flat-topped profile as seen in the HST/STIS data. The first scenario would imply a different appearance of the event viewed at the equator and viewed from a more pole-on direction. In the second case—the peak emission is the result from a circumstellar feature—the event looks very much alike from both viewing angles. In both directions a flat-topped profile is seen, but in FOS4 with the additional central emission peak. Note however that the event view from FOS4 still is different as the P Cygni lines are always present as seen from the FOS4 but change as seen from the star.
In Fig. 8 we have smoothed our VLT UVES FOS4 spectra to the same spectral resolution as the HST/STIS data. This figure is directly comparable to Fig. 1c in Davidson et al., with the same line styles used for a dataset taken at nearly the same dates, but taking into account the light travel time. With this delay, however, observations should have been done monthly (as it indeed was planned) between August and November 2003 to compare to the STIS observations in September 2003. Since no VLT spectra exist between August and November 2003, we chose the last spectrum before and the first spectrum after this gap to match Fig. 1c in Davidson et al. as well as possible with our data. Fig. 8 clearly shows that the flat-topped profile seen in the HST spectra are not seen in the VLT FOS4 spectra. The flat-topped profile therefore is not an effect of the lower spectral resolution of the HST spectra, but is indeed a real difference between the spectrum seen at the star.
4 Conclusions
The observations presented here show that the spectroscopic event of Carinae in 2003 underwent different spectral changes when observed from the FOS4 vantage point compared to the line of sight to the star. While a flat-topped Hα profile was found in the HST/STIS spectra on the star position, the FOS4 spectra show a multi-component profile with distinct peaks. If we assume that the emission observed at FOS4 is indeed only a scattered spectrum originating from the central source and does not include emission from other sources seen by FOS4, these observations favor a model in which the spectroscopic event is intrinsically different at different stellar latitudes. So the wind of Car appears to be non-spherical, and the event is also non-spherical with the polar region being affected quite differently from the equatorial region. If the peaked emission is of circumstellar origin the event seen more pole-on is only distinguished by the change of the P Cygni absorption profile which is present at the star but not prominent at FOS4.
The most prominent change at FOS4 is the gradual development of the red hump, an emission structure. Some additional emission must be present here, either from a companion star, additional stellar wind or an ejected shell. The same explanation can be put forward for the relatively narrow central Hα component in the UVES FOS4 spectra, if it is not circumstellar. Also the appearance of an additional high-velocity P Cygni component hints to new material between us and (the pole region of) the central source. This absorption component can again be the result of an increasingly faster and denser stellar wind or a shell ejected with this velocity.
The fact that P Cygni absorption is always present at FOS4 but only appears in the line of sight to the star during the event as seen in the high spatial resolution HST observations has another implication on the density structure around the central object. Note in this context that P Cygni absorption is always present in the HST observations of the higher Balmer lines. The explanation for this may be that each Balmer line is formed at a different distance from the star, implying different optical depth for different Balmer lines. In that scenario the Hα line is formed further out from the star compared to Hβ or Hη (see Fig. 15 in (Hillier et al., 2001)). As the event develops, due either to wind–wind collision in a binary system or to a shell ejection of the primary star, the optical depth in the line of sight increase and P Cygni absorption can form in the Hα line. Viewed, however, from the poles at FOS4, the optical depth is always high enough to show a P Cygni profile.
References
- Allen & Hillier (1993) Allen, D. A., & Hillier, D. J. 1993, Proceedings of the Astronomical Society of Australia, 10, 338
- Chugai (1977) Chugai, N. N. 1977, Soviet Astronomy Letters, 3, 241
- Corcoran (2003) Corcoran, M. F. 2003, IAU Circ., 8160, 3
- Damineli (1996) Damineli, A. 1996, ApJ, 460, L49
- Damineli et al. (1997) Damineli, A., Conti, P. S., & Lopes, D. F. 1997, New Astronomy, 2, 107
- Damineli et al. (1999) Damineli, A., Stahl, O., Wolf, B., Kaufer, A., & Jablonski, F. J. 1999, in ASP Conf. Ser. 179: Eta Carinae at The Millennium, 221
- Davidson (1997) Davidson, K. 1997, New Astronomy, 2, 387
- Davidson (1999) Davidson, K. 1999, in ASP Conf. Ser. 179: Eta Carinae at The Millennium, 304
- Davidson et al. (1995) Davidson, K., Ebbets, D., Weigelt, G., Humphreys, R. M., Hajian, A. R., Walborn, N. R., & Rosa, M. 1995, AJ, 109, 1784
- Davidson et al. (1999) Davidson, K., Ishibashi, K., Gull, T. R., & Humphreys, R. M. 1999, in ASP Conf. Ser. 179: Eta Carinae at The Millennium, 227
- Davidson et al. (2001) Davidson, K., Smith, N., Gull, T. R., Ishibashi, K., & Hillier, D. J. 2001, AJ, 121, 1569
- Hillier et al. (2001) Hillier, D. J., Davidson, K., Ishibashi, K., & Gull, T. 2001, ApJ, 553, 837
- Hofmann & Weigelt (1988) Hofmann, K.-H., & Weigelt, G. 1988, A&A, 203, L21
- Humphreys & The HST-Fos Car Team (1999) Humphreys, R. M., & The HST-Fos Car Team. 1999, in ASP Conf. Ser. 179: Eta Carinae at The Millennium, 107
- Ishibashi et al. (1999a) Ishibashi, K., Corcoran, M. F., Davidson, K., Swank, J. H., Petre, R., Drake, S. A., Damineli, A., & White, S. 1999a, ApJ, 524, 983
- Ishibashi et al. (1999b) Ishibashi, K., Davidson, M. F., Corcoran, K., Drake, S. A., Swank, J. H., & Petre, R. 1999b, in ASP Conf. Ser. 179: Eta Carinae at The Millennium, 266
- Ishibashi et al. (2003) Ishibashi, K. et al. 2003, AJ, 125, 3222
- McGregor et al. (1999) McGregor, P. J., Rathborne, J. M., & Humphreys, R. M. 1999, in ASP Conf. Ser. 179: Eta Carinae at The Millennium, 236
- Smith et al. (2003) Smith, N., Davidson, K., Gull, T. R., Ishibashi, K., & Hillier, D. J. 2003, ApJ, 586, 432
- Stahl et al. (1999) Stahl, O., Kaufer, A., & Tubbesing, S. 1999, in ASP Conf. Ser. 188: Optical and Infrared Spectroscopy of Circumstellar Matter, 331
- Thackeray (1956) Thackeray, A. D. 1956, The Observatory, 76, 154
- Thackeray (1961) —. 1961, The Observatory, 81, 102
- Visvanathan (1967) Visvanathan, N. 1967, MNRAS, 135, 275
- Warren-Smith et al. (1979) Warren-Smith, R. F., Scarrott, S. M., Murdin, P., & Bingham, R. G. 1979, MNRAS, 187, 761
- Weigelt & Ebersberger (1986) Weigelt, G., & Ebersberger, J. 1986, A&A, 163, L5
- Whitelock et al. (1994) Whitelock, P. A., Feast, M. W., Koen, C., Roberts, G., & Carter, B. S. 1994, MNRAS, 270, 364
- Whitelock et al. (2004) Whitelock, P. A., Feast, M. W., Marang, F., & Breedt, E. 2004, MNRAS, 116
- Whitelock et al. (2003) Whitelock, P. A., Marang, F., & Crause, L. 2003, IAU Circ., 8160, 2
- Zanella et al. (1984) Zanella, R., Wolf, B., & Stahl, O. 1984, A&A, 137, 79


| Date | MJD | phase | |
|---|---|---|---|
| 1999/12/21 | 1999.961 | 51534 | 0.363 |
| 2002/12/08 | 2002.937 | 52617 | 0.898 |
| 2002/12/26 | 2002.986 | 52635 | 0.907 |
| 2002/12/31 | 2003.000 | 52640 | 0.910 |
| 2003/01/03 | 2003.008 | 52643 | 0.911 |
| 2003/01/19 | 2003.052 | 52659 | 0.919 |
| 2003/01/23 | 2003.063 | 52664 | 0.921 |
| 2003/02/04 | 2003.100 | 52675 | 0.927 |
| 2003/02/14 | 2003.123 | 52685 | 0.932 |
| 2003/02/25 | 2003.153 | 52696 | 0.937 |
| 2003/03/07 | 2003.180 | 52706 | 0.942 |
| 2003/03/12 | 2003.195 | 52711 | 0.945 |
| 2003/04/30 | 2003.329 | 52760 | 0.969 |
| 2003/05/05 | 2003.342 | 52765 | 0.971 |
| 2003/05/12 | 2003.361 | 52772 | 0.975 |
| 2003/05/29 | 2003.408 | 52789 | 0.983 |
| 2003/06/03 | 2003.423 | 52794 | 0.986 |
| 2003/06/08 | 2003.436 | 52799 | 0.988 |
| 2003/06/12 | 2003.447 | 52803 | 0.990 |
| 2003/06/17 | 2003.460 | 52808 | 0.993 |
| 2003/06/22 | 2003.474 | 52812 | 0.995 |
| 2003/06/30 | 2003.496 | 52820 | 0.999 |
| 2003/07/05 | 2003.510 | 52825 | 1.001 |
| 2003/07/09 | 2003.521 | 52829 | 1.003 |
| 2003/07/16 | 2003.540 | 52836 | 1.007 |
| 2003/07/20 | 2003.551 | 52840 | 1.009 |
| 2003/07/26 | 2003.567 | 52846 | 1.012 |
| 2003/07/31 | 2003.581 | 52851 | 1.014 |
| 2003/11/25 | 2003.901 | 52968 | 1.072 |
| 2003/12/17 | 2003.962 | 52991 | 1.083 |
| 2004/01/02 | 2004.005 | 53007 | 1.091 |
| 2004/01/25 | 2004.068 | 53030 | 1.102 |
| 2004/02/20 | 2004.140 | 53056 | 1.115 |
| 2004/03/11 | 2004.192 | 53076 | 1.125 |