Observations and modeling of the inner disk region of T Tauri stars
Abstract
We present observations of four T Tauri stars using long baseline infrared interferometry from the Palomar Testbed Interferometer. The target sources, T Tau N, SU Aur, RY Tau and DR Tau, are all known to be surrounded by dusty circumstellar disks. The observations directly trace the inner regions (1 AU) of the disk and can be used to constrain the physical properties of this material. For three of the sources observed, the infrared emission is clearly resolved. We first use geometric models to characterize the emission region size, which ranges from 0.04 to 0.3 AU in radius. We then use Monte Carlo radiation transfer models of accretion disks to jointly model the spectral energy distribution and the interferometric observations with disk models including accretion and scattering. With these models, we are able to reproduce the data set with extended emission arising from structures larger than 10 milliarcseconds contributing less than 6% of the K band emission, consistent with there being little or no envelope remaining for these Class II sources ( -2 to 0 in the infrared). The radiation transfer models have inner radii for the dust similar to the geometric models; however, for RY Tau emission from gas within the inner dust radius contributes significantly to the model flux and visibility at infrared wavelengths. The main conclusion of our modeling is that emission from inner gas disks (between the magnetic truncation radius and the dust destruction radius) can be a significant component in the inner disk flux for sources with large inner dust radii.
1 Introduction
In the canonical model, T Tauri systems comprise the central star, a rotating disk of gas and dust, a jet or outflow and possibly a residual circumstellar envelope (see e.g. Bertout (1989)). In many cases, the central star is still accreting material and this process, as well as the mechanisms driving the outflow, are dependent on and influence the properties of the inner disk (1 AU). Several groups (e.g. Koenigl (1991) and Shu et al. (1994)) have proposed models in which the stellar magnetic field truncates the disk at a few stellar radii. Matter from the disk flows along the field lines and onto the star producing hot spots or rings that can explain observed ultraviolet photometric variability (Kenyon et al., 1994; Wood et al., 1996; Gomez de Castro & Franqueira, 1997).
In the last several years, the technique of long-baseline infrared interferometry has been applied to the study of circumstellar material around young stellar objects. These observations are sensitive to hot material near the star itself. Given the milliarcsecond resolution capability of the current generation of interferometers, these observations can in many cases spatially resolve the emission from the hot (a few thousand Kelvin) material and are well suited for observations of the inner regions of young stellar objects. The first young stellar object to be observed using this technique was FU Ori (Malbet et al., 1998), followed by Herbig Ae/Be stars (Millan-Gabet et al., 1999; Millan-Gabet, Schloerb, and Traub, 2001) and T Tauri stars (Akeson et al., 2000)(hereafter Paper 1). The FU Ori results were consistent with accretion disk models, while both the T Tauri and Herbig star results found characteristic sizes larger than expected from geometrically flat accretion disk models. More recent observations of Herbigs (Eisner et al., 2004) have found earlier spectral type objects which are consistent with accretion disk predictions.
Measurements of the spectral energy distribution (SED) at optical through radio wavelengths probe a range of processes in young stellar objects including the stellar photosphere, accretion onto the star or disk, emission from gas and dust in the disk and emission from the outflow. In many sources, continuum emission from circumstellar or accreting material adds to the stellar spectrum, decreasing the stellar spectral features in an effect called veiling. For T Tauri stars, the veiling in the infrared can very high, indicating substantial excess emission (see e.g Folha & Emerson (1999)).
In Paper 1 we presented observations showing that the infrared emission from the T Tauri stars T Tau N and SU Aur is resolved. The visibilities from T Tauri stars can be difficult to model given the substantial stellar component, infrared variability and the possible presence of a significant extended component. In this paper, we present further interferometric observations of the T Tauri stars T Tau N, SU Aur, DR Tau and RY Tau using the Palomar Testbed Interferometer (PTI) and infrared photometry from the Pomona College 1-meter telescope. In §4, we present geometric models to constrain the emission size and orientation. In §5, we present detailed source models which include the scattered light and reprocessing of starlight and dissipation of viscous accretion energy in the disk to fit both the SED and the infrared visibilities.
2 Sources
All four sources are located in the Taurus-Auriga molecular cloud (distance 140 pc) and are well studied T Tauri objects. Source spectral types and stellar properties given in Table 1 are taken from recent references using infrared spectroscopy. Due to the sensitivity restrictions of PTI, we have chosen sources which are among the most infrared luminous T Tauri objects. As the PTI acquisition system works in the optical, there is a selection effect against highly inclined, optically obscured sources.
| Source | Sp Type | L⋆ (L⊙) | R⋆ (R⊙) | Ref. |
|---|---|---|---|---|
| T Tau N | K0 | 7.3 | 2.8 | White & Ghez (2001) |
| SU Aur | G2 | 12.9 | 3.5 | Muzerolle et al (2003) |
| DR Tau | K7 | 0.87 | 1.9 | Muzerolle et al (2003) |
| RY Tau | K1 | 12.8 | 3.6 | Muzerolle et al (2003) |
All four systems have significant emission in excess of the stellar photosphere from near infrared through millimeter wavelengths and all are believed to have circumstellar disks. The T Tau system comprises the optically visible star T Tau N and its infrared companion T Tau S, which is itself a binary (Koresko, 2000). The PTI observations are of T Tau N, the component which dominates the millimeter emission (Akeson, Koerner, and Jensen, 1998). SU Aur has an SED similar to that of T Tau N, although Herbig and Bell (1988) classified SU Aur separately from other T Tauri’s due to its high luminosity and broad absorption lines. RY Tau is associated with a reflection nebulosity (Nakajima & Golimowski, 1995) and has millimeter-wave molecular line emission consistent with a Keplerian disk (Koerner & Sargent, 1995). DR Tau is one of the most heavily veiled T Tauri stars and is highly variable in the optical (Gullbring et al, 2000) and near-infrared (Kenyon et al., 1994).
3 Observations
3.1 Infrared interferometry
Infrared interferometry data were taken at the Palomar Testbed Interferometer (PTI), which is described in detail by Colavita et al. (1999). PTI is a long-baseline, direct detection interferometer which utilizes active fringe tracking in the infrared. Data presented here were obtained in the K band (2.2 m) in all three PTI baselines: NS (110 meter), NW (85 meter) and SW (85 meters). In our analysis below, we also use the SU Aur observations described in Akeson et al. (2002) and Paper 1. A summary of the new observations is given in Table 2. These data were acquired over a period from 24 September 2001 to 16 October 2003. The data in the NS and NW baselines were taken with a 20 millisecond fringe integration time, while the SW data were taken with a 50 millisecond time, providing better SNR for these data.
| Observations | ||||||
|---|---|---|---|---|---|---|
| NS | NW | SW | ||||
| nights | ints | nights | ints | nights | ints | |
| T Tau N | 1 | 6 | ||||
| SU Aur | 1 | 6 | ||||
| DR Tau | 3 | 5 | 1 | 3 | 1 | 4 |
| RY Tau | 4 | 27 | 3 | 14 | 2 | 8 |
| Calibrators | ||||||
| Calibrator | size est.(mas) | Sources | ||||
| HD 28024 | 0.68 | T Tau N, SU Aur, DR Tau, RY Tau | ||||
| HD 30111 | 0.60 | T Tau N, SU Aur | ||||
| HD 30122 | 0.11 | T Tau N, SU Aur | ||||
| HD 28677 | 0.34 | DR Tau, RY Tau | ||||
| HD 26737 | 0.24 | DR Tau, RY Tau | ||||
The data were calibrated using the standard PTI method (Boden et al., 1998). Briefly, a synthetic wide-band channel is formed from five spectrometer channels (). The system visibility, the response of the interferometer to an unresolved object, is measured using calibrator stars. The calibrator star sizes were estimated using a blackbody fit to photometric data from the literature and were checked to be internally consistent. Calibrators were chosen for their proximity to the source and for small angular size, minimizing systematic errors in deriving the system visibility. All calibrators used here have angular diameters milliarcsecond (mas) and were assigned uncertainties of 0.1 mas (Table 2). The calibrated data are presented in normalized squared visibility (V2=1 for an unresolved source), which we refer to as visibility in this paper. The calibrated visibility uncertainties are a combination of the calibrator size uncertainty and the internal scatter in the data. As DR Tau is near the tracking limit for PTI, the wide-band data are used rather than the synthetic wide-band (spectral channel) data. The main difference between these two channels is that the spectral channels are spatially filtered and the wide-band channel is not. The accuracy of the wide-band data were confirmed by comparing the wide-band and synthetic wide-band data for other sources observed on the same night as DR Tau.
The calibrated data were edited to remove integrations with very high jitter (a measure of the phase noise) and integrations for which the estimates of the system visibility from separate calibrator observations disagreed by more than 3. In general, the points eliminated were from entire nights with marginal weather or integrations taken at large hour angles. No more than 10% of the data for any given source was removed, except for DR Tau on the NS baseline, and inclusion of these data points would not substantially change the results given below.
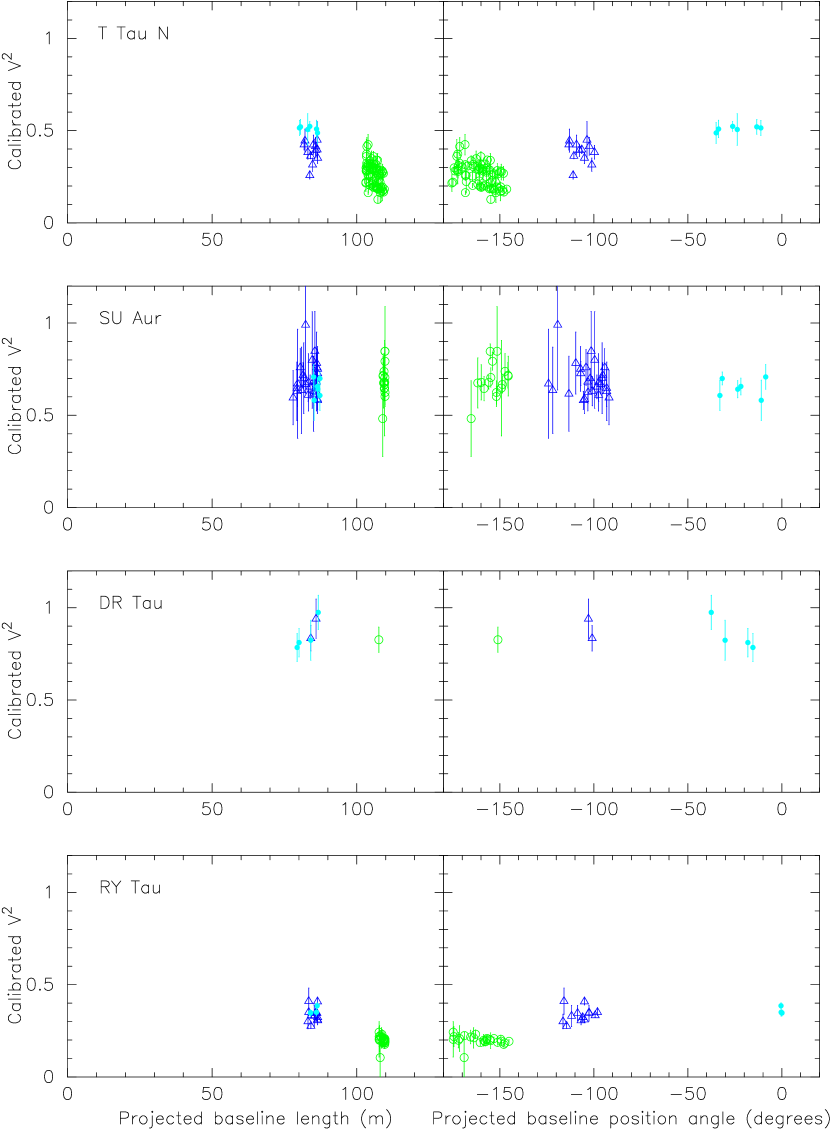
The calibrated and edited data are shown in Figure 1 for each source as a function of projected baseline length and position angle. Three of the four sources, T Tau N, SU Aur and RY Tau are clearly resolved. The new observations of T Tau N are consistent with the results of Akeson et al. (2002). We have not calculated models for T Tau N here; scattered light models of T Tau N that reproduce the observed asymmetry (Stapelfeldt et al., 1998) are detailed in Wood et al. (2001).
3.2 Infrared photometry
A sample of young stellar objects, including DR Tau, SU Aur and RY Tau and a sequence of photometric standard stars taken from Landolt (1992) were observed over seven nights from December 2003 to March 2004 (December 16, January 10, 13, 15, 22, 23, and March 9) using the Pomona College 1-m telescope with the CLIRCAM infrared camera in the J and K bands. For each object, a series of at least five dithered exposures was used to create individual sky images for each field. The sky background and instrumental noise was subtracted from all the images, and repeat exposures were median combined after shifting to a common astrometric reference frame to remove a majority of the background noise. Instrumental magnitudes were converted to standard J and K magnitudes using a combination of the published magnitudes and the J and K magnitudes from bright 2MASS stars in the image frames. The magnitudes given in Table 3 are the average magnitudes over all six nights using the average calibration zero points from the complete sample of photometric standards and 2MASS stars. The three sources observed showed no statistically significant variability over the nights observed, and were constant in magnitude within the photometric error of 0.15 magnitudes in J and 0.15 magnitudes in K. For comparison, the 2MASS J and K magnitude and observation date are also given. Together, the Pomona and 2MASS data bracket the PTI observations. At K band, only RY Tau shows a significant difference between the 2MASS measurement and our more recent observations; however, past observations of these sources have shown infrared variability (particularly DR Tau; Kenyon et al. (1994)). Additional information on the infrared observations from Table 3 is presented in Penprase et al. (2004).
| Source | # nights | mag | rms | 2MASS mag | 2MASS rms | 2MASS date |
|---|---|---|---|---|---|---|
| J band | ||||||
| SU Aur | 6 | 7.24 | 0.143 | 7.20 | 0.020 | 1/30/98 |
| DR Tau | 6 | 8.75 | 0.195 | 8.84 | 0.024 | 10/10/97 |
| RY Tau | 5 | 7.52 | 0.226 | 7.15 | 0.019 | 10/29/97 |
| K band | ||||||
| SU Aur | 6 | 6.17 | 0.114 | 5.99 | 0.022 | 1/30/98 |
| DR Tau | 6 | 6.87 | 0.183 | 6.87 | 0.017 | 10/10/97 |
| RY Tau | 6 | 5.76 | 0.168 | 5.39 | 0.022 | 10/29/97 |
4 Geometric models
In this section, we discuss geometric models for SU Aur, RY Tau and DR Tau. As PTI is a direct detection interferometer, any emission within the 1″ Gaussian (FWHM) field of view will contribute to the measured visibility. As discussed in Akeson et al. (2002) there are many scenarios that could produce a visibility of less than 1. These include additional point sources within the field of view, a resolved source of emission, or extended (over-resolved) emission which will contribute incoherently. Any possible incoherent contribution (in this case any emission on scales greater than 10 mas and within the 1″ FOV) is hard to assess for our sources, given that many observations of envelopes or reflection nebulae do not include the central arcsecond due to contamination from the star itself. None of these three sources has a known companion within 1″. DR Tau was included in lunar occultation observations of Simon et al. (1999) and no detection was reported with a point source limiting magnitude of = 2.5. Models including scattered light contributions are presented in §5 and extended components are discussed in §5.3.
For the model fitting in this section, we adopt a configuration of an unresolved point source (these stars have diameters 0.1 mas and therefore a V at PTI) and a resolved component. We take the contribution of the stellar component from measurements of the infrared veiling. For SU Aur and DR Tau we use the K band veiling measurements of Muzerolle et al (2003). For RY Tau the Muzerolle et al (2003) value of (where = Fexcess/Fstar) is much less than the lower limit of from Folha & Emerson (1999). For our adopted model (point source + resolved component), the PTI data and a value of are incompatible (i.e. the point source contribution can not be that large and still produce the PTI measurement) and we therefore use for RY Tau in the geometric fits.
Simple geometric models of the emission are used to characterize the source size and inclination. The two models presented here use a uniform disk and a thin ring to represent the emission profile. For the uniform disk, only the measured visibility was used to determine the disk radius. For the ring model, visibilities were calculated for a range of inner diameters and compared to the observed visibilities. For each ring diameter considered, the width was determined by matching the excess flux, derived using the measured K-band veiling, with a blackbody emission source at a temperature of 1600 K, the assumed dust destruction temperature (Duschl, Gail, & Tscharnuter, 1996). In these models, the dust destruction temperature controls the width of the ring, but affects the fit radius only through the shape of the model visibility curve. For example, changing the blackbody temperature of the ring from 1200 to 2000 K would change the fit radius for RY Tau by 30%. Both face-on and inclined geometries were fit to the data (Table 4). The uncertainties in the model fits due to the uncertainty in the stellar contribution are also given.
| SU Aur | DR Tau | RY Tau | |
| fexcessaafexcess = Fexcess/Ftotal, where Ftotal = Fstar + Fexcess | 0.8 | ||
| Km (2MASS) | 5.99 | 6.87 | 5.40 |
| Face-on models | |||
| Uniform disk | |||
| Radius (AU) | 0.20 | 0.10 | 0.29 |
| (AU) | 0.042 | 0.004 | 0.080 |
| 2.5 | 0.85 | 2.9 | |
| Ring | |||
| Inner radius (AU) | 0.13 | 0.057 | 0.17 |
| Width (AU) | 0.050 | 0.028 | 0.035 |
| (AU) | 0.036 | 0.010 | 0.059 |
| 2.5 | 0.85 | 4.6 | |
| Inclined models | |||
| Uniform disk | |||
| Radius (AU) | 0.27 | 0.11 | 0.30 |
| PA (degr) | 112 | 160 | 98 |
| Incl (degr) | 51 | 40 | 19 |
| 0.9 | 0.77 | 2.3 | |
| Ring | |||
| Inner radius (AU) | 0.18 | 0.070 | 0.19 |
| Width (AU) | 0.008 | 0.019 | 0.029 |
| PA (degr) | 114 | 160 | 110 |
| Incl (degr) | 52 | 40 | 25 3 |
| 0.9 | 0.78 | 3.0 | |
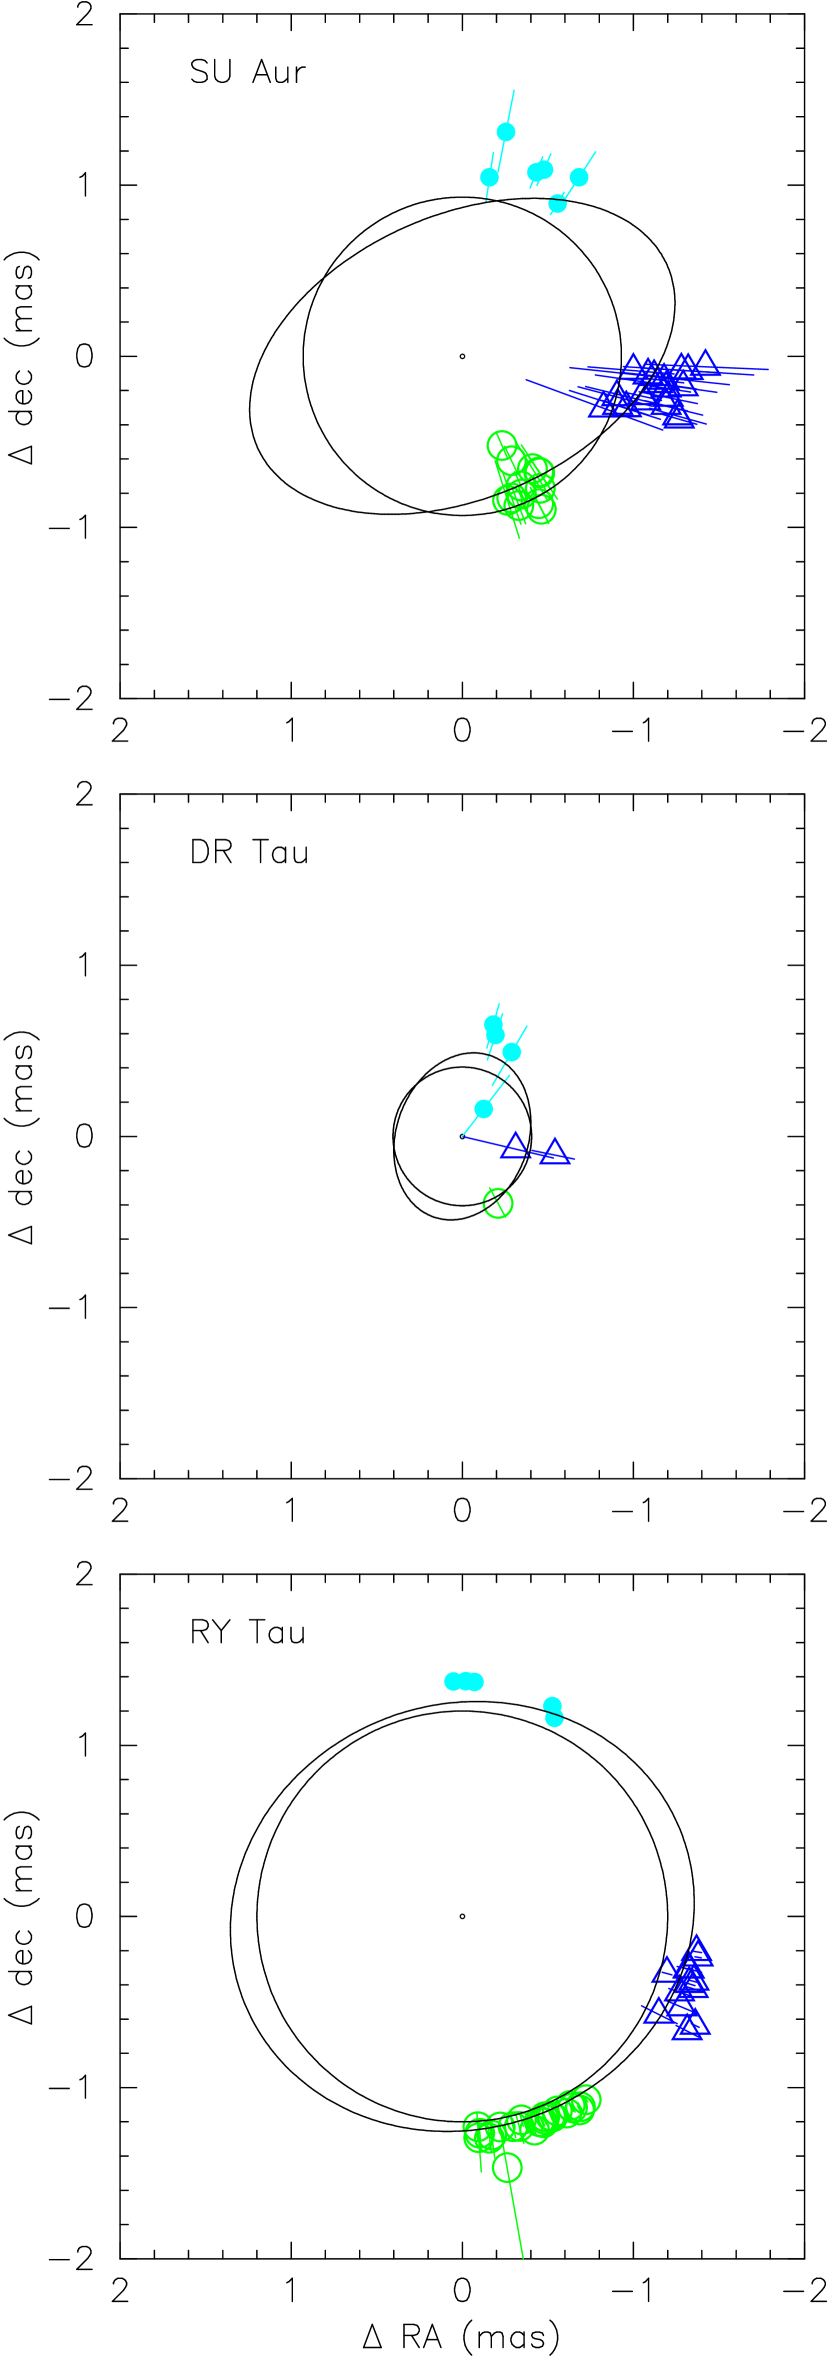
The ring model fits are graphically shown in Figure 2. In this sky plane representation, the radial coordinate for each data point is the inner ring size corresponding to the measured visibility and accounting for the stellar component listed in Table 4. The error bars include the errors on the data points but not the uncertainty in the stellar contribution. The polar coordinate is determined by the projected baseline position angle. In this way, the constraint provided by the data on both the size and the inclination are visible. The best fit face-on and inclined ring models are also plotted.
4.1 Discussion
Using the simple geometric models, we find source sizes ranging from 0.04 to 0.3 AU in radius. As discussed in Paper 1 and by Millan-Gabet, Schloerb, and Traub (2001), the measured sizes for T Tauri stars and Herbig Ae stars were larger than expected from simple disk models. An explanation for this discrepancy in Herbig stars was proposed independently by two groups based on SED modeling (Natta et al., 2001) and aperture masking observations (Tuthill, Monnier and Danchi, 2001). In these models the inner edge of the dust disk is located at the radius where the dust reaches the sublimation temperature (Rdust). This configuration produces a vertically extended inner wall, reproducing both the SED and the interferometry observations for the Herbig sources. Dullemond, Dominik, and Natta (2001) also applied this model to T Tauri stars. Further work by Muzerolle et al (2003) extended the model to include the accretion luminosity as well as the stellar luminosity in determining the dust destruction radius for several T Tauri stars, including the three shown in Figure 2. In all these models, optically thin gas may be present within Rdust (we discuss this point further in §5.4).
We chose a ring distribution as a simple representation of a model in which the infrared emission arises from the inner wall of the dust disk. The values for Rdust predicted by Muzerolle et al (2003) are larger by roughly a factor of 2 than our fit ring radii. We note that the presence of extended emission which was not included in our model would decrease the fit radius, and would therefore increase this discrepancy. The fit ring radii for SU Aur and RY Tau correspond to 10 R⋆ and 11 R⋆, much larger than the expected magnetic truncation radius (3 – 5 R⋆; Shu et al. (1994)). In §5 we show that emission from gas between the magnetic truncation radius and Rdust can reconcile accretion disk models with our observations.
The position angle coverage of the PTI data allow us to constrain the inclination of infrared emission. The improves substantially for SU Aur and RY Tau for the inclined models as compared to the face-on models, but the DR Tau data do not provide a good constraint on the inclination given the large error bars and because the source is at best marginally resolved. For RY Tau, our inclination angle of 19° – 25° agrees with that derived by Koerner & Sargent (1995) from resolved millimeter emission (25°). However, the position angle is not well constrained by our data (98° 40° for the uniform disk and 110° 22° for the ring) and does not agree with the PA of the millimeter emission (48° 5°, Koerner & Sargent (1995); 27° 7°, Kitamura et al. (2002)) and is not orthogonal to the jet PA of 110° from Stapelfeldt et al. (1998). Our inclination angle of 52° 10° agrees with the 60° estimate of Unruh et al. (2004) based on the photometric period and line widths. Muzerolle et al (2003) find high (86°) inclination values for both RY Tau and SU Aur, which are not supported by the PTI data, particularly for RY Tau, and are also inconsistent with the low visible extinctions (Av=2.1 and 0.9, respectively). At such high viewing angles, the star would be occulted by the flared circumstellar disk. If there is a large incoherent component for any of the sources, then our simple geometric fits will underestimate the inclination angle as an incoherent contribution is independent of baseline. However, in our detailed models (§5) for these three objects, the extended light contribution is less than 10%, which is insufficient to change the measured RY Tau inclination by 60°.
5 Detailed radiation transfer models
One of the major uncertainties in the simple fits presented above is the assumption of no extended emission within the 1″ PTI field of view. To address this issue directly, we have calculated radiative transfer models for SU Aur, DR Tau and RY Tau. The input properties are given in Table 1 and the goal is to match the PTI data and the SED.
5.1 Monte Carlo radiation transfer code
We use the Monte Carlo radiative equilibrium technique of Bjorkman & Wood (2001), updated by Walker et al. (2004), to self-consistently model each of our target sources. This code iteratively solves for the disk density structure, assuming the dust and gas are well-mixed with a standard gas to dust ratio of 100:1 and the system is in vertical hydrostatic equilibrium. In addition to stellar irradiation, the code includes accretion and shock/boundary layer luminosity calculations according to Calvet & Gullbring (1998). Multiple scattering is treated alongside the heating and reprocessing of photons in the disk. Output data can be used to produce synthetic SEDs and multi-wavelength images for any viewing angle of the disk system. For more detailed description of the code and its updates see Wood et al. (2002, 2002); Whitney et al. (2003, 2003); Walker et al. (2004) and references therein.
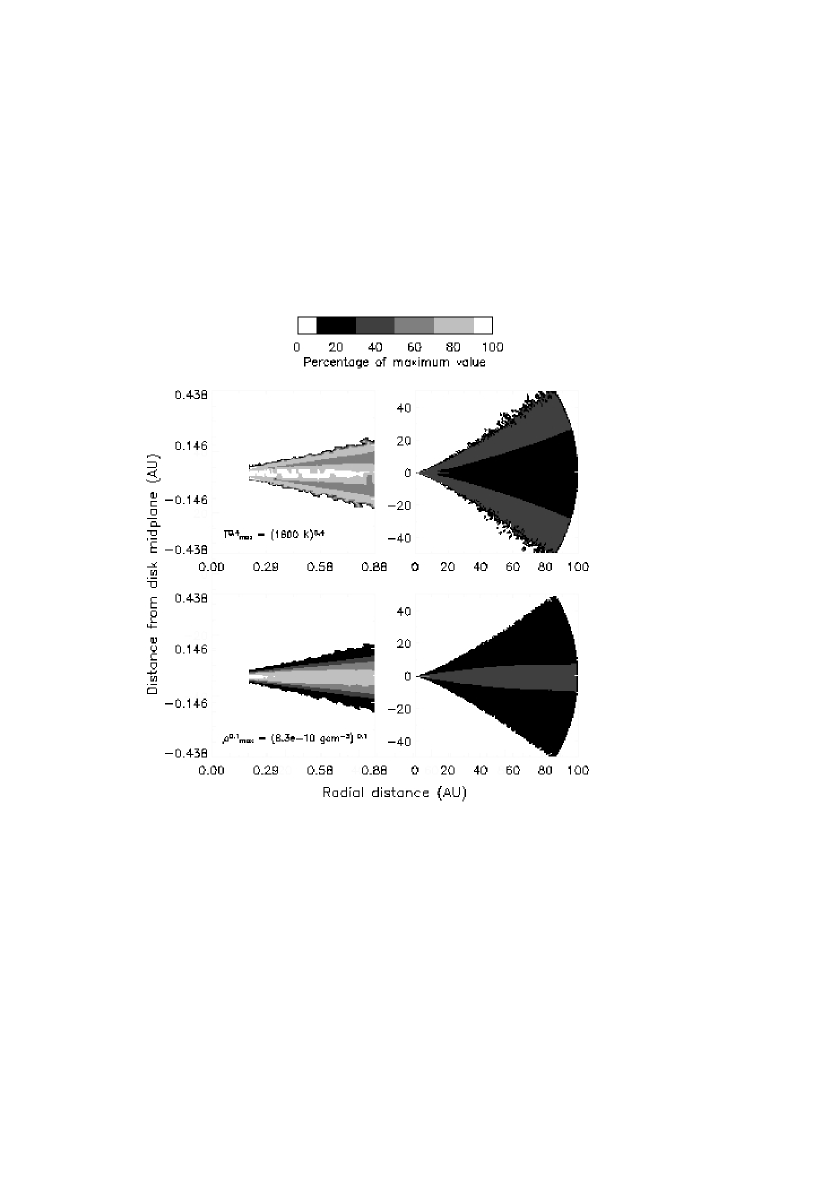
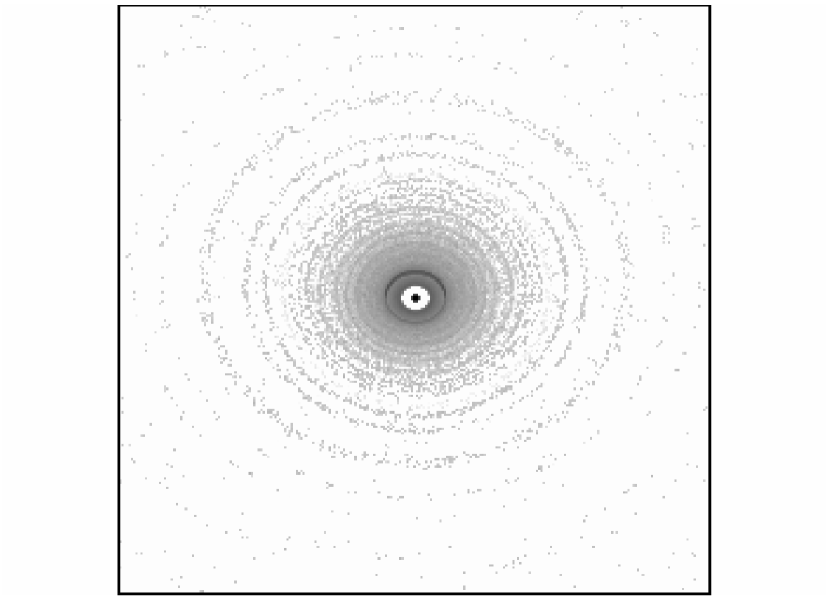
The code computes the flared density structure of a steady accretion disk extending from the inner dust destruction radius to a specified outer radius (Figure 3). The Monte Carlo technique naturally accounts for radiation transfer effects and the heating and hydrostatic structure of the inner wall of the dust disk. The vertical height of the inner wall of dust is not preset, but rather calculated as part of the modeling process. For these models the scale height of the density distribution is 0.3 to 0.7 R⋆ at the inner edge. The position of the inner dust disk edge, Rdust is determined from the destruction temperature of silicates, taken to be 1600 K (Duschl, Gail, & Tscharnuter, 1996). Within the disk we adopt the dust-size distribution used for the modeling of HH30 IRS and GM Aur (Wood et al., 2002; Schneider et al., 2003; Rice et al., 2003). With a distribution of grain sizes or compositions, the dust destruction may take place over a range of radii, but this is beyond the scope of our work. Monnier & Millan-Gabet (2002) discuss the constraints on the dust properties from infrared interferometry observations.
In order to match the new PTI observations, Rdust for some sources was large enough ( 0.2 AU) that continuum emission from gas within Rdust becomes significant. The structure and temperature of the gas disk is not computed self-consistently in our models. Instead, accretion luminosity is emitted following the temperature structure of an optically thick accretion disk
| (1) |
(e.g., Lynden-Bell & Pringle (1974); Pringle (1981)) where is the radial distance in the mid-plane. The gas disk is assumed to be infinitely thin, so after being emitted, the “accretion photons” do not encounter any opacity in the gas, but may be scattered and absorbed, and produce heating in the dust disk. Clearly this is a simplification for the gas emission, but is sufficient for our models. The assumed geometry of the gas disk is supported by recent modeling by Muzerolle et al (2004) of Herbig Ae/Be sources in which the gas disk is geometrically thin, allowing direct radiation of the inner dust disk. Future work will investigate the effects of possible shielding of the dust disk by a flared and possibly optically thick, inner gas disk.
The gas disk extends down to the magnetic truncation radius (Rgas) at which point, material is thought to be channeled along magnetic field lines onto the star at a high latitude shock zone (e.g. D’Alessio (2003), Kenyon et al. (1994)). We assume the gas disk is truncated at a magnetospheric radius dependent on the stellar radius, mass, accretion rate and surface magnetic field Ghosh & Lamb (1979). For DR Tau and RY Tau we assume kiloGauss magnetic fields and truncate the gas disk at 5 R⋆. For SU Aur, thought to be more weakly magnetic and with inconclusive evidence for hot spots (Unruh et al., 2004) we use 2 R⋆ for Rgas. We assume photons emitted from the shock/boundary layers have a spectrum of an 8000 K Planck function (Calvet & Gullbring, 1998) and are emitted along with stellar photons as in Muzerolle et al (2003).
For each model, the stellar luminosity has been fixed as detailed in Table 1 and for input stellar spectra we use the appropriate Kurucz (1994) model atmosphere. We also used fixed stellar masses of 2.25 M⊙, 2M⊙, and 1 M⊙ for SU Aur, RY Tau and DR Tau, respectively (Cohen & Kuhi, 1979; Kenyon et al., 1994); note that the stellar mass is not a critical parameter in the near-infrared. The disk properties such as mass, accretion rate and inclination were varied in order to produce a grid of synthetic SEDs. These models allowed us to explore likely parameter configurations.
5.2 Visibility calculation
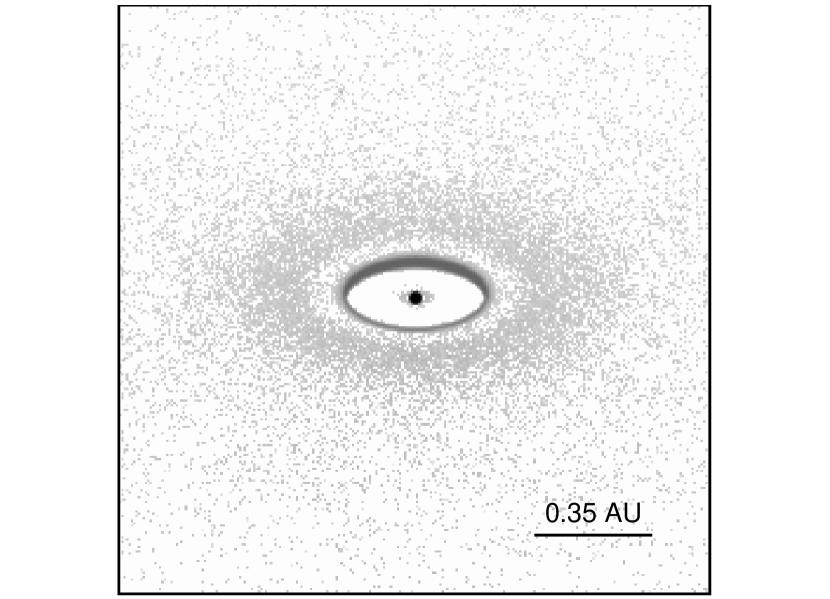
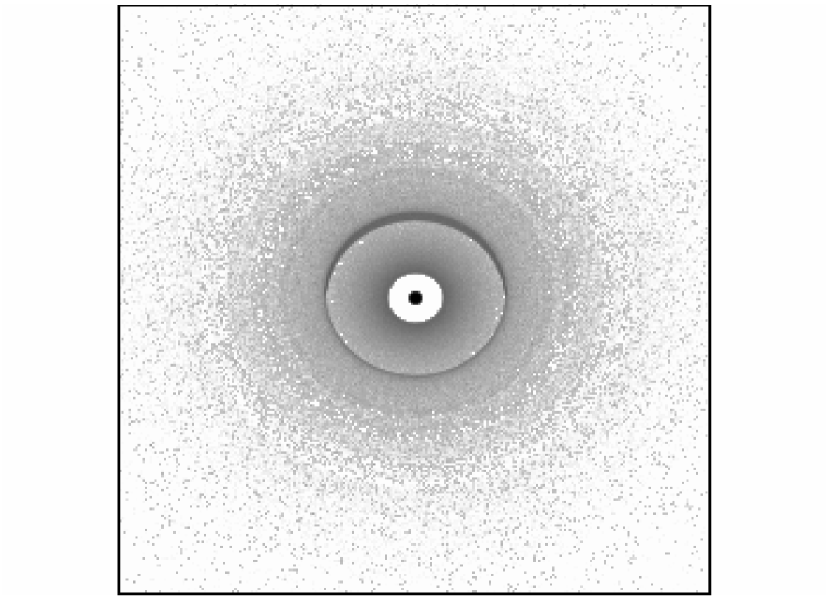
To calculate model visibilities, a simulated K band image was created using the Monte Carlo models with pixel size 0.05 mas and a width of 12.5 mas. The pixel size was chosen to be much smaller than the fringe spacing of 4 mas and the total size was a compromise between calculation time (large images are computationally intensive) and capturing the relevant structure. The outer size is large enough to contain any component which would contribute substantially to the model visibility. For example, a thin ring with an inner radius of 3 mas has V2=0.01 on the shortest PTI baseline. The K band emission in the models is dominated by structures a few mas in size or less (Figure 4). As discussed in §4, any emission within the 1″ FOV will contribute incoherently. To calculate the extended component in the model, a larger image is also constructed with 2 mas pixels and a 1″ field. The emission outside the central 12 mas is calculated and included in the visibility calculation as an incoherent contribution. The effects of the 1″ Gaussian field of view and the finite fringe envelope are also included in the visibility calculation. For each PTI baseline, the model visibility, including the incoherent flux, was calculated for the average baseline length and position angle using the Fourier Transform of the image, assuming a position angle for the disk as given in §4. We thus “observe” the models as they would be at PTI.
The model visibilities and full SEDs were then compared to the data presented in §3.1 and SED data taken from the literature. The optical and infrared SED data are taken from the compilation of Kenyon and Hartmann (1995) and are not contemporaneous but instead represent an average for each source and the millimeter data are taken from Akeson et al. (2002) and Beckwith et al. (1990). For each object a set of models was calculated to explore the disk parameters to find a viable model and an example selection of models for each object is given in Table 5. The parameter space chosen for the inclination angle was restricted using the results from the geometric fits. The model with the total lowest is shown for each object in Fig 4 and the corresponding SED fit in Fig 5.
| Model | rin | incl | Lacc+shk | notes | |||||
| M⊙/yr | AU | M⊙ | deg | L⊙ | |||||
| SU Aur | |||||||||
| SU-A | 0.21 | 0.001 | 60 | 0.02 | 7 | 118 | 125 | ||
| SU-B | 0.21 | 0.001 | 50 | 0.02 | 29 | 101 | 130 | ||
| SU-C | 0.22 | 0.001 | 50 | 0.02 | 60 | 198 | 258 | ||
| SU-D | 0.21 | 0.001 | 50 | 0.02 | 48 | 163 | 211 | ||
| SU-E | 0.24 | 0.005 | 50 | 0.02 | 99 | 893 | 992 | ||
| DR Tau | |||||||||
| DR-A | 0.09 | 0.16 | 30 | 1.3 | 12 | 24 | 36 | R | |
| DR-B | 0.09 | 0.16 | 30 | 1.3 | 30 | 19 | 49 | ||
| DR-C | 0.09 | 0.12 | 30 | 1.3 | 30 | 59 | 89 | ||
| DR-D | 0.09 | 0.15 | 60 | 0.97 | 9 | 55 | 63 | ||
| DR-E | 0 | 0.08 | 0.08 | 60 | 0 | 3 | 82 | 85 | no accretion |
| RY Tau | |||||||||
| RY-A | 0.27 | 0.015 | 25 | 4.28 | 8 | 37 | 45 | ||
| RY-B | 0.27 | 0.015 | 25 | 5.13 | 1 | 294 | 295 | ||
| RY-C | 0.27 | 0.012 | 25 | 3.42 | 135 | 31 | 166 | ||
| RY-D | 0.27 | 0.015 | 25 | 4.28 | 4 | 145 | 149 | no gas | |
| RY-E | 0.27 | 0.015 | 25 | 4.28 | 36 | 313 | 349 | envelope | |


5.3 Other emission components
Before discussing the results of the Monte Carlo models, we discuss other possible physical components which have not been included in our models. As discussed in §4, a binary companion will contribute coherently or incoherently to the measured visibility depending on the separation from the primary. RY Tau was classified as a “Variability induced mover” from Hipparcos data and Bertout (1989) found a solution in which the possible companion had a minimum separation of 24 mas. However, the K band speckle interferometry survey of Leinert et al. (1993) did not detect a companion for RY Tau in the angular range of 01 to 10″ and HST archival images of RY Tau from WFPC2 show only a single point source. For the incoherent contribution from a companion to account entirely for the measured visibility the K band flux ratio would be 0.81 to 1.44 (secondary/primary), but this could not account for the change in visibility with baseline length and orientation.
Another likely contributor of infrared emission is a circumstellar envelope. An envelope can be a source of scattered and thermally reprocessed starlight and can also veil emission from the central star and accretion disk (see e.g. the models of Calvet, Hartmann, & Strom (1997); Whitney et al. (2003)). However, SU Aur, DR Tau and RY Tau are all Class II T Tauri stars and have visual extinctions 2. In general, Class II sources are thought to have little or no envelope remaining (see e.g. Mundy, Looney, & Welch (2000)). RY Tau shows near-infrared CO lines in absorption (Najita, Carr, & Mathieu, 2003) which Calvet, Hartmann, & Strom (1997) cite as evidence of no substantial envelope for other Class II sources.
To assess the possible presence of emission within the 1″ PTI FOV, we examined HST archival images from the standard imaging pipeline. For each source, we found WFPC2 images taken with the F814W filter on the Planetary Camera CCD. No extended emission or additional sources were apparent in the images, however they are dominated by the central point source. Azimuthal brightness averages were computed for comparison to a star extracted from the PSF archive. The core of RY Tau was saturated to such an extent that we were unable to find a matching saturated PSF for comparison. Although the scatter in the PSF averages do not allow a precise comparison, especially in the core, SU Aur and DR Tau are dominated by a central source (Figure 6). This is in contrast with the images of Class I sources, such as the sample imaged by Padgett et al. (1999) which show images dominated by scattered light from circumstellar material hundreds of AU in extent. Coronagraphic techniques have revealed some extended emission in RY Tau (Nakajima & Golimowski, 1995) and SU Aur (Chakraborty & Ge, 2004) but as detailed in the next section, this emission is unlikely to contribute substantially in the near-infrared. We have also calculated an example model with a disk and an envelope for RY Tau (§5.4.3).

5.4 Results
As the wavelength range used for the SED comparison ranges from 0.365 microns to 3 millimeters, the model SED is sensitive to many model parameters, from the extinction to the outer disk size and mass. As expected, the infrared visibility is sensitive to only a few model parameters, particularly the inner radius, the inclination angle and the luminosity. Each object is considered separately below, but the general conclusion is that these models, which include the contribution from extended emission, support the simple geometric models in the large value of Rdust found for RY Tau and SU Aur. In part this is because the models contain incoherent contributions at 2 microns (here defined as flux from scales greater than 10 mas) which were less than 6% for all sources, and could still reproduce both the SED and the infrared interferometry observations. High resolution infrared imaging observations would further constrain the extended emission component of these models. The K band excess flux from the models is also close to the veiling values used in §4, with Fexcess/Ftotal values of 0.4, 0.74 and 0.68 respectively for SU Aur, DR Tau and RY Tau.
The second general conclusion is that emission from gas within Rdust is a significant component of the near-infrared emission if Rdust is large. For our three objects this is most evident in the RY Tau model. The relative flux of the gas and dust components for RY Tau can be seen in Figure 7, which shows a cut through the model image with the inner dust wall facing the observer on the left in the plot. In comparison, for the DR Tau model a smaller Rdust is necessary to match the high visibilities measured at PTI and so Rdust and Rgas are similar. For DR Tau, a smaller value of Rgas than estimated from the stellar properties (2 R⋆ instead of 5 R⋆) was necessary to match the data. We have not explored the value of Rgas extensively in these models, so these values should be taken as approximate. Observations by Najita, Carr, & Mathieu (2003) of CO fundamental emission for several single T Tauri stars similar to our targets (e.g. BP Tau) found the inner CO radius to be smaller than the calculated corotation radius for 5 out of 6 sources with CO inner radii of 0.02 to 0.09 AU. Modeling of Herbig Ae/Be sources by Muzerolle et al (2004) found emission from the inner gas exceeded the stellar emission for accretion rates M⊙/yr.

To confirm the effect of the gas emission, a model was constructed for RY Tau in which the gas was artificially removed from the region within Rdust, which was set to match the measured PTI visibilities. However, the SED fit for this model (Table 5, model RY-D) is not as good as for the model with gas emission.
5.4.1 SU Aur
For SU Aur, both the SED and the measured visibilities are well fit by model SU-A. Figure 4 shows the inner region of this model, with the star and the inner dust disk edge producing the K band emission. At an inclination angle of 60° the inner edge of the dust disk facing the observer is clearly brighter. We find Rdust = 0.21 AU, similar to the inclined ring model radius of 0.18 AU from Table 4. The gas emission is visible close to the star (RR⋆) but the emission is limited by the small surface area at this radius.
Recent observations by Chakraborty & Ge (2004) have traced extended emission at K out to radii of 26. This study did not measure the scattered light within 1″ so does not help constrain the PTI data, but does suggest that a complete model for SU Aur would include an extended scattered component; however, their measured K flux from 1″ to 26 was only 4% of the 2MASS K flux, so neglecting this component adds only a small error to the SED fit.
5.4.2 DR Tau
It was not possible to fit both the PTI data and the SED data well with these models. The best-fit model listed in Table 5 underestimates the infrared visibility and underestimates the SED throughout the near and mid-infrared (Figure 5). In order to produce an inner disk radius small enough to fit the PTI data, the model must contain no accretion (model DR-E), which drastically underestimates the SED and disagrees with the accretion diagnostics observed for the source (Kenyon et al., 1994; Muzerolle et al, 2003). The infrared photometry (Table 3) does not reveal substantial variations recently, however the optical veiling for DR Tau has been highly variable (Gullbring et al, 2000) and as the SED data and PTI measurements are not contemporaneous, there may be issues with source variability in our modeling. Also note that the models in Table 5 have a lower inclination () than given by the geometric fits () but within the uncertainty.
We compared the photometry from Kenyon and Hartmann (1995) which are averages of measurements from the literature to the optical and infrared contemporaneous SED from Eiroa et al. (2002) and the main deviation is slightly lower fluxes at for the contemporaneous SED, which does not improve our model fits. In the variability study by Skrutskie et al. (1996) DR Tau showed no trend in color with brightness changes, suggesting the variability is not due to large extinction changes. The variability of DR Tau has been modeled as a hot spot on the stellar photosphere Kenyon et al. (1994), but the models here do not attempt to model DR Tau with that level of detail.
5.4.3 RY Tau
RY Tau has the largest Rdust of the three sources and gas within Rdust contributes substantially to the infrared emission. This second component in the disk emission means that the simple ring model is an underestimate of Rdust. Although this same gas component is present in the models for all three sources, the contribution to the K band flux is largest for RY Tau as Rdust is larger than for the other two sources. For RY Tau, the best fit model was relatively close to the optimal parameters for both the PTI and SED data. The PTI data are best modeled by a higher total luminosity and accretion rate (model RY-B) than the SED data.
A reflection nebulosity has been observed extending to 40″ from RY Tau at visible wavelengths. However, this is unlikely to contribute substantially at K as the reflection component is only 2% of the total flux at 0.9 m and scattering decreases with increasing wavelength. To test the effect of an envelope on the predicted visibilities and SED, a model was calculated using the disk properties of model RY-A with an envelope using the same gas and dust radii, 0.01 times the disk mass and an infall rate of 1 M⊙/yr for the envelope. As seen in Table 5, this model does not fit either the SED or the visibilities as well. Other models with higher envelope masses were also calculated and had even worse fits to the SED. It may be possible to better match the SED with a different disk and envelope combination, however we found no observational evidence for substantial near-infrared emission from an envelope.
We note that Calvet et al. (2004) have recently characterized RY Tau as a G1 star, substantially earlier than previous spectral type determinations. However, their stellar properties (R⋆ = 2.9 R⊙, M⋆ = 2.0 M⊙) agree reasonably well with the values we used (Table 1). We used a slightly lower effective temperature (5782 K compared to 5945 K) and a higher luminosity (12.8 L⊙ compared to 9.6 L⊙). A lower stellar luminosity would require a more massive disk and higher accretion to produce the same flux at longer wavelengths, but the general properties of a large Rdust would not change. The accretion rate of the model presented here, M⊙/yr, is actually higher than the Calvet et al. (2004) estimate of M⊙/yr.
6 Conclusions
Infrared interferometric observations of T Tauri stars are used to constrain the inner disk properties. Detailed models were presented for SU Aur, RY Tau and DR Tau to reproduce both the interferometry observations and the spectral energy distribution. For both the simple geometric fits to the interferometry data and the Monte Carlo disk models which include accretion and scattering, the inner dust radius ranges from 0.05 to 0.3 AU. Extended envelopes were not needed to reproduce the SED for these sources, although additional high resolution infrared images would help in constraining the extended emission on larger scales (tens to hundreds of AU). However, the significant variations in the visibility with baseline length and orientation seen for SU Aur and RY Tau require a resolved component to be present as an extended component produces a constant visibility reduction. Although the models parameters given here may not be a unique solution to the data set used, they are consistent with the domination of the near-infrared excess by thermal emission from the disk, as expected for Class II sources.
The SU Aur model agrees well with the size derived from geometric fits to the interferometer data alone. The SED and PTI visibilities for DR Tau can not both be fit with these models, perhaps due to source variability. For RY Tau, the model predicts significant emission in the K band from gas within the inner dust disk radius. This gas emission at infrared wavelengths is generally not considered in the simple models used to fit interferometric data and when this emission is present results in an underestimate of the dust radius when using a simple ring model.
Future work will extend the observational database to study more sources and probe the innermost regions of disks. Interferometric observations at a second wavelength would add additional constraints on the inner disk structure. From a theoretical perspective, we are extending the Monte Carlo codes to include gas opacity in the inner disk and self-consistently calculate its structure. The data and models presented in this paper clearly show that inner gas disks cannot be ignored and are required when fitting observations that probe the inner regions of disks.
References
- Akeson et al. (2002) Akeson, R. L., Ciardi, D. R., van Belle, G. T., & Creech-Eakman, M. J. 2002, ApJ, 566, 1124
- Akeson et al. (2000) Akeson, R. L., Ciardi, D. R., van Belle, G. T., Creech-Eakman, M. J., and Lada, E. A. 2000, ApJ, 543, 313, Paper 1
- Akeson, Koerner, and Jensen (1998) Akeson, R. L., Koerner, D. W., and Jensen, E. L. N. 1998, ApJ, 505, 358
- Beckwith et al. (1990) Beckwith, S. V. W., Sargent, A. I., Chini, R. S., & Guesten, R. 1990, AJ, 99, 924
- Bertout (1989) Bertout, C., 1989, ARA&A, 27, 351
- Bertout, Robichon, & Arenou (1999) Bertout, C., Robichon, N., & Arenou, F. 1999, A&A, 352, 574
- Bjorkman & Wood (2001) Bjorkman, J. E. & Wood, K. 2001, ApJ, 554, 615
- Boden et al. (1998) Boden, A. F., Colavita, M. M., van Belle, G. T., and Shao, M. 1998, SPIE proceedings, 3350, 872
- Calvet, Hartmann, & Strom (1997) Calvet, N., Hartmann, L., & Strom, S. E. 1997, ApJ, 481, 912
- Calvet & Gullbring (1998) Calvet, N. & Gullbring, E. 1998, ApJ, 509, 802
- Calvet et al. (2004) Calvet, N., Muzerolle, J., Briceño, C., Hernández, J., Hartmann, L., Saucedo, J. L., & Gordon, K. D. 2004, AJ, 128, 1294
- Cardelli, Clayton, & Mathis (1989) Cardelli, J. A., Clayton, G. C., & Mathis, J. S. 1989, ApJ, 345, 245
- Chakraborty & Ge (2004) Chakraborty, A. & Ge, J. 2004, AJ, 127, 2898
- Cohen & Kuhi (1979) Cohen, M. & Kuhi, L. V. 1979, ApJS, 41, 743
- Colavita et al. (1999) Colavita M. M. et al 1999, ApJ, 510, 505
- D’Alessio (2003) D’Alessio, P. 2003, IAU Symposium, 221
- Dullemond, Dominik, and Natta (2001) Dullemond, C.P., Dominik, C. and Natta, A., 2001, ApJ, 560, 957
- Duschl, Gail, & Tscharnuter (1996) Duschl, W. J., Gail, H.-P., & Tscharnuter, W. M. 1996, A&A, 312, 624
- Eiroa et al. (2002) Eiroa, C., et al. 2002, A&A, 384, 1038
- Eisner et al. (2004) J. A. Eisner, B. F. Lane, L. A. Hillenbrand, R. L. Akeson, & A. I. Sargent, 2004, ApJ, 613, 1049
- Folha & Emerson (1999) Folha, D. F. M. & Emerson, J. P. 1999, A&A, 352, 517
- Ghosh & Lamb (1979) Ghosh, P. & Lamb, F. K. 1979, ApJ, 234, 296
- Gomez de Castro & Franqueira (1997) Gomez de Castro, A. I. & Franqueira, M. 1997, ApJ, 482, 465
- Gullbring et al (2000) Gullbring, E., Calvet, N., Muzerolle, J., & Hartmann, L. 2000, ApJ, 544, 927
- Hartigan, Edwards, & Ghandour (1995) Hartigan, P., Edwards, S., & Ghandour, L. 1995, ApJ, 452, 736
- Herbig and Bell (1988) Herbig, G.H. and Bell, K.R. 1988, Lick Obs. Bull. 111, Third Catalog of Emission-line Stars for the Orion Population (Santa Cruz: Univ. California)
- Kenyon and Hartmann (1995) Kenyon, S.J. and Hartmann, L., 1995, ApJS, 101 117
- Kenyon et al. (1994) Kenyon, S. J. et al. 1994, AJ, 107, 2153
- Kitamura et al. (2002) Kitamura, Y., Momose, M., Yokogawa, S., Kawabe, R., Tamura, M., & Ida, S. 2002, ApJ, 581, 357
- Kley (1989) Kley, W. 1989, A&A, 208, 98
- Koerner & Sargent (1995) Koerner, D. W. & Sargent, A. I. 1995, AJ, 109, 2138
- Koenigl (1991) Koenigl, A. 1991, ApJ, 370, L39
- Koresko (2000) Koresko, C.D., 2000, ApJ, 531, 147
- Kurucz (1994) Kurucz, CD-ROM 19, Solar Abundance Model Atmospheres for 0,1,2,4,8 km/s (Cambridge:SAO)
- Landolt (1992) Landolt, A. U. 1992, AJ, 104, 340
- Leinert et al. (1993) Leinert, C., Zinnecker, H., Weitzel, N., Christou, J., Ridgway, S. T., Jameson, R., Haas, M., & Lenzen, R. 1993, A&A, 278, 129
- Lynden-Bell & Pringle (1974) Lynden-Bell, D. & Pringle, J. E. 1974, MNRAS, 168, 603
- Malbet et al. (1998) Malbet, F. et al. 1998, ApJ, 507, L149
- Millan-Gabet et al. (1999) Millan-Gabet, R., Schloerb, F. P., Traub, W. A., Malbet, F., Berger, J. P., & Bregman, J. D. 1999, ApJ, 513, L131
- Millan-Gabet, Schloerb, and Traub (2001) Millan-Gabet, R., Schloerb, F. P., and Traub, W. A, 2001, ApJ, 546, 358
- Monnier & Millan-Gabet (2002) Monnier, J. D. & Millan-Gabet, R. 2002, ApJ, 579, 694
- Mundy, Looney, & Welch (2000) Mundy, L. G., Looney, L. W., & Welch, W. J. 2000, Protostars and Planets IV, 355
- Muzerolle et al (2003) Muzerolle, J., Calvet, N., Hartmann, L., & D’Alessio, P. 2003, ApJ, 597, L149
- Muzerolle et al (2004) Muzerolle, J., D’Alessio, P., Calvet, N., & Hartmann, L. 2003, ApJ, accepted
- Najita, Carr, & Mathieu (2003) Najita, J., Carr, J. S., & Mathieu, R. D. 2003, ApJ, 589, 931
- Nakajima & Golimowski (1995) Nakajima, T. & Golimowski, D. A. 1995, AJ, 109, 1181
- Natta et al. (2001) Natta, A., Prusti, T., Neri, R., Wooden, D., Grinin, V.P., and Mannings, V., 2001, å, 371, 186
- Padgett et al. (1999) Padgett, D. L., Brandner, W., Stapelfeldt, K. R., Strom, S. E., Terebey, S., & Koerner, D. 1999, AJ, 117, 1490
- Penprase et al. (2004) Penprase, B., et al., 2004, in preparation
- Pringle (1981) Pringle, J. E. 1981, ARA&A, 19, 137
- Rice et al. (2003) Rice, W. K. M., Wood, K., Armitage, P. J., Whitney, B. A., & Bjorkman, J. E. 2003, MNRAS, 342, 79
- Schneider et al. (2003) Schneider, G., Wood, K., Silverstone, M. D., Hines, D. C., Koerner, D. W., Whitney, B. A., Bjorkman, J. E., & Lowrance, P. J. 2003, AJ, 125, 1467
- Shu et al. (1994) Shu, F., Najita, J., Ostriker, E., Wilkin, F., Ruden, S., & Lizano, S. 1994, ApJ, 429, 781
- Simon et al. (1999) Simon, M., Beck, T. L., Greene, T. P., Howell, R. R., Lumsden, S., & Prato, L. 1999, AJ, 117, 1594
- Skrutskie et al. (1996) Skrutskie, M. F., Meyer, M. R., Whalen, D., & Hamilton, C. 1996, AJ, 112, 2168
- Stapelfeldt et al. (1998) Stapelfeldt, K. R., et al. 1998, ApJ, 508, 736
- Stapelfeldt et al. (1998) Stapelfeldt, K. R., et al. 2004, in preparation
- Tuthill, Monnier and Danchi (2001) Tuthill, P.G., Monnier, J.D., and Danchi, W.C., 2001, Nature, 409, 1012
- Unruh et al. (2004) Unruh, Y. C., et al. 2004, MNRAS, 348, 1301
- Walker et al. (2004) Walker, C. et al, 2004, in preparation
- White & Ghez (2001) White, R. J. & Ghez, A. M. 2001, ApJ, 556, 265
- Whitney et al. (2003) Whitney, B. A., Wood, K., Bjorkman, J. E., & Wolff, M. J. 2003, ApJ, 591, 1049
- Whitney et al. (2003) Whitney, B. A., Wood, K., Bjorkman, J. E., & Cohen, M. 2003, ApJ, 598, 1079
- Wood et al. (1996) Wood, K., Kenyon, S. J., Whitney, B. A., & Bjorkman, J. E. 1996, ApJ, 458, L79
- Wood et al. (2001) Wood, K., Smith, D., Whitney, B., Stassun, K., Kenyon, S. J., Wolff, M. J., & Bjorkman, K. S. 2001, ApJ, 561, 299
- Wood et al. (2002) Wood, K., Lada, C. J., Bjorkman, J. E., Kenyon, S. J., Whitney, B., & Wolff, M. J. 2002, ApJ, 567, 1183
- Wood et al. (2002) Wood, K., Wolff, M. J., Bjorkman, J. E., & Whitney, B. 2002, ApJ, 564, 887