22institutetext: INAF - Osservatorio Astronomico di Torino, Strada Osservatorio 20, I-10025 Pino Torinese, Italy
Probing the nuclear obscuration in radio-galaxies with near infrared imaging††thanks: Based on observations made with the Italian Telescopio Nazionale Galileo (TNG) operated on the island of La Palma by the Centro Galileo Galilei of the INAF (Istituto Nazionale di Astrofisica) at the Spanish Observatorio del Roque de los Muchachos of the Instituto de Astrofisica de Canarias.,††thanks: Based on observation obtained at the Space Telescope Science Institute, which is operated by the Association of Universities for Research in Astronomy, Incorporated, under NASA contract NSA 5-26555.
We present the first near-infrared (-band) homogeneous observations of a complete sub-sample of the 3CR radio catalogue comprising all High Excitation Galaxies (HEGs) at 0.3. After showing that the surface brightness decomposition technique to measure central point-like sources is affected by significant uncertainties for the objects in the studied sample, we present a new, more accurate method based on the color profile. Via this method we find a substantial nuclear -band excess in all but two HEGs – most likely directly associated to their nuclear emission – and we measure the corresponding 2.12 m nuclear luminosities. Within the frame of the unification scheme for radio-loud active galactic nuclei, it appears that obscuration alone is not able to account for the different nuclear properties of the majority of the HEGs and Broad Line Radio Galaxies (BLRGs), and also scattering of the (optically) hidden nuclear light from a compact region must be invoked. More precisely, for 70% of the HEGs the observed point-like optical emission is dominated by the scattered component, while in the -band both scattered and direct light passing through the torus contribute to the observed nuclear luminosity. The estimated fraction of scattered light ranges from a few tenths to a few percent, while the torus extinction is between 1550 mag with only a few exceptions with lower obscuration.
Key Words.:
galaxies: active - galaxies: nuclei - galaxies: photometry - infrared: galaxies - quasars: general1 Introduction
Unification models for radio-loud active galactic nuclei (RL AGNs) aim at understanding the different observed properties of intrinsically identical sources in terms of anisotropies in the nuclear emission (see Urry & Padovani 1995 for a review). Anisotropy can arise from relativistic beaming and/or selective obscuration caused by material arranged in a non-spherical, torus-like geometry.
RL AGNs can be broadly divided into two classes based on their extended radio morphology: low-power, edge-darkened FR I and high-power, edge-brightened FR II sources (Fanaroff & Riley 1974). For the powerful FR II radio-galaxies (RGs), the unification of the broad-lined (BLRGs) and narrow-lined objects (NLRGs) invokes the existence of an obscuring ‘torus’ blocking the direct view of the nuclear and broad-line emission at large angles with respect to the jet axis. The detection of polarized broad emission lines in (a still small number of) NLRGs (e.g. Antonucci 1984; Cohen et al. 1999; Young et al. 1996a; Ogle et al. 1997) provides the most direct support to this scenario. Conversely, in low-luminosity FR I RGs obscuration is actually neither ‘required’ nor supported observationally (Urry & Padovani 1995).
A complication in this scheme arises due to the spectral inhomogeneity of the FR II RG population, comprising within the NLRGs class both high-excitation (HEGs) and low-excitation (LEGs) galaxies (Laing et al. 1994; Jackson & Rawlings 1997), while all FR Is are characterized by low-excitation spectra.
The study of the nuclear properties of RGs strongly benefited from the results of Hubble Space Telescope (HST) optical and UV imaging of most 3CR RGs (Spinrad et al. 1985) with redshift 0.3 (33 FR Is and 63 FR II; Chiaberge, Capetti & Celotti 1999, 2002, CCC99, CCC02 hereafter; Chiaberge et al. 2002). Unresolved nuclear sources are detected in most of the FR Is, suggesting that their nuclei are essentially unobscured (CCC99). The observed large range in the optical-UV spectral index can be accounted for just by moderate absorption (1-2 mag), due to either extended (kpc-scale) dust lanes or (100 pc) dusty disks (Chiaberge et al. 2002). Furthermore, the nuclear optical luminosities strongly correlate with the 5 GHz radio core ones, arguing for a common synchrotron origin, and in turn correspond to extremely low Eddington ratios (e.g. Fabian & Rees 1995; Zirbel & Baum 1995; Willott et al. 2000; Wills et al. 2004). Thus FR I RGs might be lacking a substantial broad line region, torus and thermal disc emission. Unresolved nuclear components are also detected in a significant number of FR IIs (CCC02). With respect to FR Is they show a more complex behaviour which is however clearly related to their spectral classification: i) BLRGs have optical cores with luminosities in excess to those of FR I of similar radio power, possibly dominated by thermal emission; ii) no central source is seen in several HEGs, likely constituting the obscured narrow-lined counterparts of BLRGs; iii) in a few objects (e.g. 3CR 109 and 3CR 234) the detected nuclear component is consistent with being the (obscured) quasar light scattered into our line-of-sight; iv) LEGs harbor faint optical cores, essentially indistinguishable from those seen in FR Is, indicating that the FR I/II dichotomy is not univocally connected with the nuclear structure (LEGs constitute a substantial fraction of FR II sources).
Nonetheless, the optical results can be strongly hampered by the effects of dust extinction. This problem is certainly serious in RGs where (even leaving aside the presence of nuclear tori) nuclear discs and dust lanes do not allow us to study the central regions in a significant fraction of the 3CR sources ( 30 %) (de Koff et al. 2000). Particularly instructive is the case of Centaurus A, the nearest RG. An unresolved nuclear component is seen in HST images from the to the band (Marconi et al. 2000) but its infrared flux is five orders of magnitude larger than the optical one. A similar effect is also commonly seen in Seyfert 2, where HST imaging have revealed the ubiquitous presence of near-infrared (NIR) nuclei in optically obscured sources (e.g. Kulkarni et al. 1998; Quillen et al. 2001). Thus to gain a better understanding of the physics of RL AGNs it is crucial to obtain a more unbiased view of RGs nuclei, which can be provided by NIR observations.
Relatively little effort has been devoted to date to NIR imaging of RGs (Lilly & Longair 1982; Taylor et al. 1996; Simpson, Ward & Wall 2000, hereafter SWW00) and no systematic program has been carried out. Moreover in Lilly & Longair (1982) only 10″-12″ aperture photometry has been performed, leading to only about a dozen objects with NIR nuclear luminosity estimates, out of the complete 3CR RG sample with 0.3. NIR spectroscopy (Hill, Goodrich & DePoy 1996) and thermal-IR (- and -band) imaging (Simpson, Rawlings & Lacy 1999) for a total of about 15 RGs have revealed quasar nuclei obscured by from to 45 mag (SWW00).
The NIR results can/will be also compared to those in the mid-infrared (MIR) and in the far-infrared (FIR). Indeed the recent study of 3CR sources by Haas et al. (2004) provided evidence for the presence in high-power RGs of powerful AGN hidden by a dusty torus: steep-spectrum radio quasar, BLRGs and HEGs showed very similar IR spectral energy distributions, characterized by a FIR dust emission component, with relatively weaker MIR, NIR and optical emission in HEGs with respect to BLRGs. On the contrary, FR Is and LEGs were characterized by a different spectral energy distributions, showing a dust emission bump in the MIR-FIR from dust cooler than in FR II, a bump peaking at 1 m due to the elliptical hosts and a steep synchrotron spectrum in the cm-mm wavelength range. A comparison between 3CR FR Is and high-power FR IIs in the MIR and FIR has been also recently performed by Mller et al. (2004) showing that FR Is are characterized by MIR and FIR dust luminosities much lower than FR IIs, consistent with the former hosting low-luminosity nuclei.
To extend the NIR diagnostic to a large complete sample we performed a band survey of all RG belonging to the 3CR sample at 0.3, aiming at: i) identifying optically obscured sources from the presence of a NIR excess with respect to the extrapolation of the optical (HST) flux; ii) establishing the role of obscuration in FR I RGs; iii) exploring the nature of narrow lined FR IIs, in particular those with faint optical nuclei; iv) comparing the NIR properties of low and high luminosity radio sources; v) studying the properties of the nuclear regions of the sources affected by large scale dust obscuration.
In this paper we present results obtained for the subsample of FR II RGs with an HEG optical spectrum. The outline is the following. In § 2 we describe the IR observations and data reduction; a comparison between the IR and HST images aimed at finding obscured nuclei is presented in § 3. In § 4 and § 5 we focus on the results and discuss some of their consequences. Our conclusions are drawn in the final § 6. A zero cosmological constant universe with =75 km s-1 Mpc-1 and =0.5 is adopted throughout the paper for comparison with previous works in this field.
2 The sample, observations and data reduction
2.1 The sample
Among the 3CR RGs at , the HEG sub–sample comprises 32 objects (CCC02). Following the definition by Jackson & Rawlings (1997), HEGs have been classified on the basis of their [OIII] equivalent width (larger than 10 Å), and/or the [OII]/[OIII] ratio (smaller than 1). In Table 1, names, redshifts and radio data of the objects are reported, together with the optical [OIII] line and core continuum (HST) luminosities, as taken from the literature. Six objects of the sample have been excluded from the analysis: 3CR 63, 3CR 135 and 3CR 192 were not observed because of scheduling problems or clouds, 3CR 153 had very bad seeing, 3CR 33 and 3CR 105 have no available HST image (see § 3.2).
| Source Name | Redshift | Imagesa | ||||
|---|---|---|---|---|---|---|
| 3C 18 | 0.188 | H,A | 34.16 | 31.84 | 41.88 | 28.62 |
| 3C 33 | 0.059 | A | 33.56 | 30.27 | 42.01 | not obs. |
| 3C 63 | 0.175 | H | 34.08 | 30.97 | – | 28.29 |
| 3C 79 | 0.256 | H,N | 34.54 | 31.19 | 42.43 | 28.33 |
| 3C 98 | 0.030 | H,N | 32.79 | 29.25 | 40.87 | 25.67 |
| 3C 105 | 0.089 | N | 33.45 | 30.36 | 40.78 | not obs. |
| 3C 135 | 0.127 | H | 33.78 | 30.18 | – | 27.36 |
| 3C 153 | 0.277 | H,N | 34.44 | 29.73 | – | 26.66 |
| 3C 171 | 0.238 | H,N | 34.42 | 30.36 | 42.50 | 26.50 |
| 3C 184.1 | 0.118 | H,N | 33.61 | 30.25 | 42.19 | 28.17 |
| 3C 192 | 0.060 | H | 33.22 | 29.73 | 41.60 | 26.99 |
| 3C 197.1 | 0.131 | H,N | 33.45 | 30.30 | 41.26b | 28.10 |
| 3C 198 | 0.082 | H,N | 33.38 | – | 41.04 | 28.03 |
| 3C 223 | 0.137 | H,N | 33.74 | 30.57 | 42.17 | 27.27 |
| 3C 223.1 | 0.108 | H,N | 33.31 | 30.24 | 41.65 | 27.18 |
| 3C 234 | 0.185 | H,N | 34.27 | 31.88 | 43.17 | 29.10 |
| 3C 284 | 0.239 | H,N | 33.87 | 30.25 | 42.19 | complex |
| 3C 285 | 0.079 | H,N | 32.87 | 29.93 | 40.73 | 25.65 |
| 3C 300 | 0.270 | H,N | 34.45 | 31.07 | 42.16 | 27.79 |
| 3C 321 | 0.096 | H,A | 33.32 | 30.78 | 42.15 | complex |
| 3C 327 | 0.104 | H,A | 33.97 | 30.88 | 42.05 | 26.55 |
| 3C 349 | 0.205 | H,A | 34.07 | 31.18 | 41.42 | 28.16 |
| 3C 357 | 0.167 | H,A | 33.67 | 30.48 | 41.76c | 26.90 |
| 3C 379.1 | 0.256 | H,A | 34.03 | – | – | 27.21 |
| 3C 381 | 0.161 | H,A | 33.91 | 30.48 | 42.37 | 27.52 |
| 3C 402 | 0.025 | H,A | 32.04 | 29.73 | – | 26.59 |
| 3C 403 | 0.059 | H,A | 33.28 | 29.87 | 41.55 | 26.65 |
| 3C 405 | 0.056 | H,A | 35.73 | 32.20 | – | complex? |
| 3C 436 | 0.215 | H,A | 34.18 | 31.21 | 41.52 | complex |
| 3C 452 | 0.081 | H,A | 33.88 | 31.24 | 41.35d | 26.89 |
| 3C 456 | 0.233 | H,A | 34.21 | 31.39 | 42.59 | 28.50 |
| 3C 460 | 0.268 | H,A | 34.10 | 31.39 | 41.67 | 27.60 |
aImages coding: H=HST, A=Arnica, N=NICS;
is the total radio luminosity at 178 MHz; is the nuclear radio luminosity at 5 GHz (references in CCC02); is the luminosity of the [OIII] 5007 Å emission line from Jackson & Rawlings (1997) and C. Willott’s web page, http://www-astro.physics.ox.ac.uk/cjw/3crr/3crr.html; except for b3CR 197.1 (from the SDSS spectrum), c3CR 357 (Crawford, Fabian & Johnstone 1988) and d3CR 452 (Rawlings et al. 1989); is the luminosity of the optical core as measured in CCC02.
2.2 TNG observations
Observations have been obtained with the 3.6m Telescopio Nazionale Galileo (TNG), the Italian national facility located at La Palma Island (Spain) in two runs on Jul 8-12, 2000 and on Feb 9-13, 2001. During the first run we used ARNICA (ARcetri Near Infrared CAmera), a 256256 pixel NICMOS 3 array with a pixel size of 035 and a field of view (FoV) of 1′.51′.5, while for the second run NICS (Near Infrared Camera Spectrometer), a Rockwell 10241024 HgCdTe Hawaii array, was already available. In its small field mode the pixel size is for a total FoV of 2′.22′.2, while in its large field mode pixel size and FoV are doubled.
Images were taken with the dithering mode with the source located in a pattern of 20 positions with a width of . All sources of this sub-sample are sufficiently small that it was possible to always keep the source within the images during the pattern (for both ARNICA and NICS). For NICS, the individual integration time was set to 1 min to achieve background limited images, i.e. a total integration time of 20 min for each source (except 3CR 184.1 and 3CR 234, for which it was 16 and 15 min, respectively). For ARNICA the individual integration time was set to 48 sec, and the total ranged from 4.8 to 24 min depending on the source. We used the filter that has a central wavelength of 2.12 m and a FWHM of 0.35 m.
2.3 Data reduction
The images taken with NICS were reduced with SNAP (Speedy Near-infrared data Automatic Pipeline), a pipeline for automatic reduction developed by F. Mannucci. SNAP performs a full reduction, with flat-fielding, sky subtraction, computation of the offsets, correction for geometrical distortion, object masking and correction for cross-talk between the quadrants (for more information, see http://www.arcetri.astro.it/filippo/snap/). For the ARNICA data, a flat field was produced by median filtering of the frames, after scaling each frame to have the same median pixel value. Each frame was then divided by a normalized flat-field and registered using as reference the target itself and, when possible, stars present in the FoV. The aligned images were then averaged to produce the final reduced image.
For both NICS and ARNICA, absolute flux calibration was obtained observing 6-11 standard fields (depending on the night) using a 5 position dithering pattern. From each frame of each standard star we derived a measurement of the zero-point, for a total of 32-61 independent values per night. The dispersion of the zero-point measurements provides an estimate of the calibration accuracy in the range 4-6% for NICS and 3-6% for ARNICA, depending on the night. NICS last night was not photometric, with thin cirrus, and no standard star has been observed. The absolute flux calibration was obtained using the stars present in the fields in common with previous nights (these fields were re-observed since the seeing in last night was much better). The flux calibration proved to be stable throughout the night, consistent with previous night calibrations and with an accuracy of 6%.
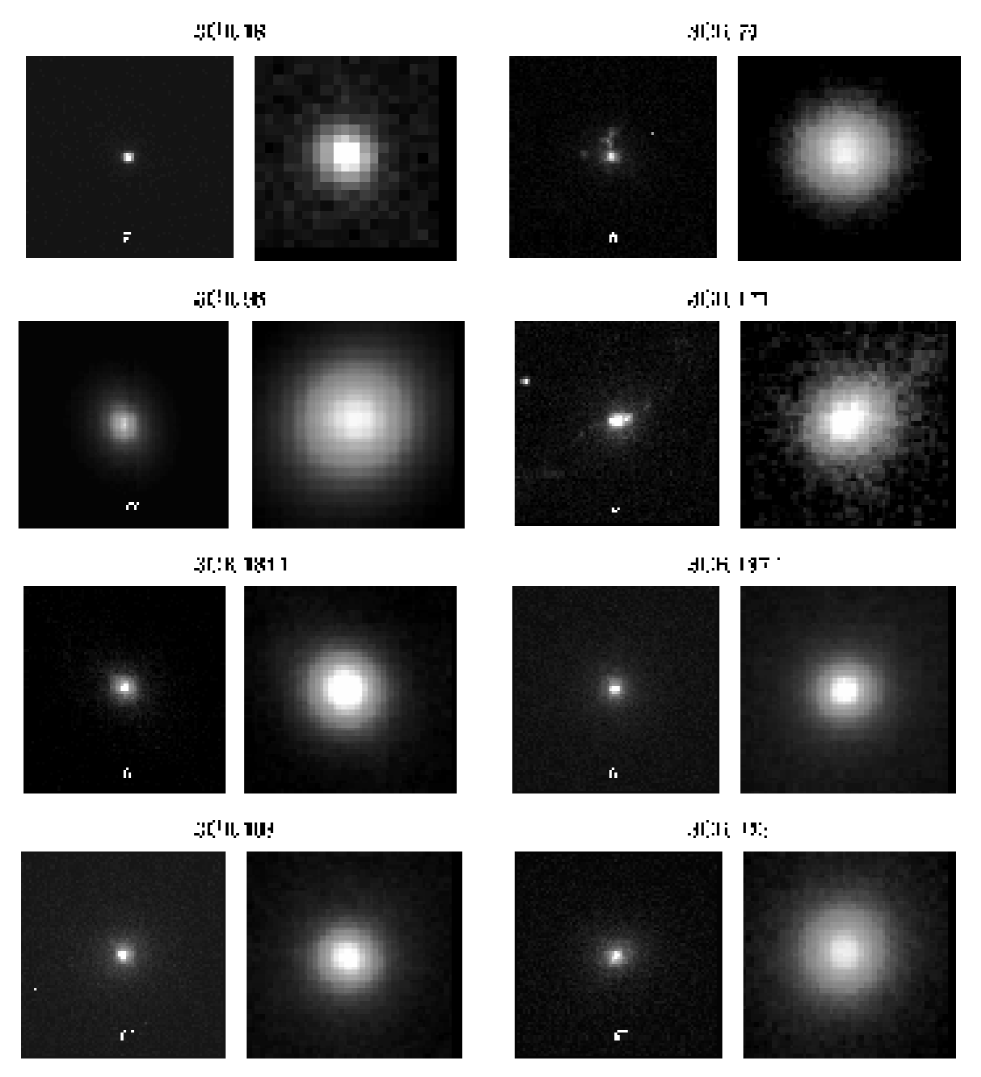
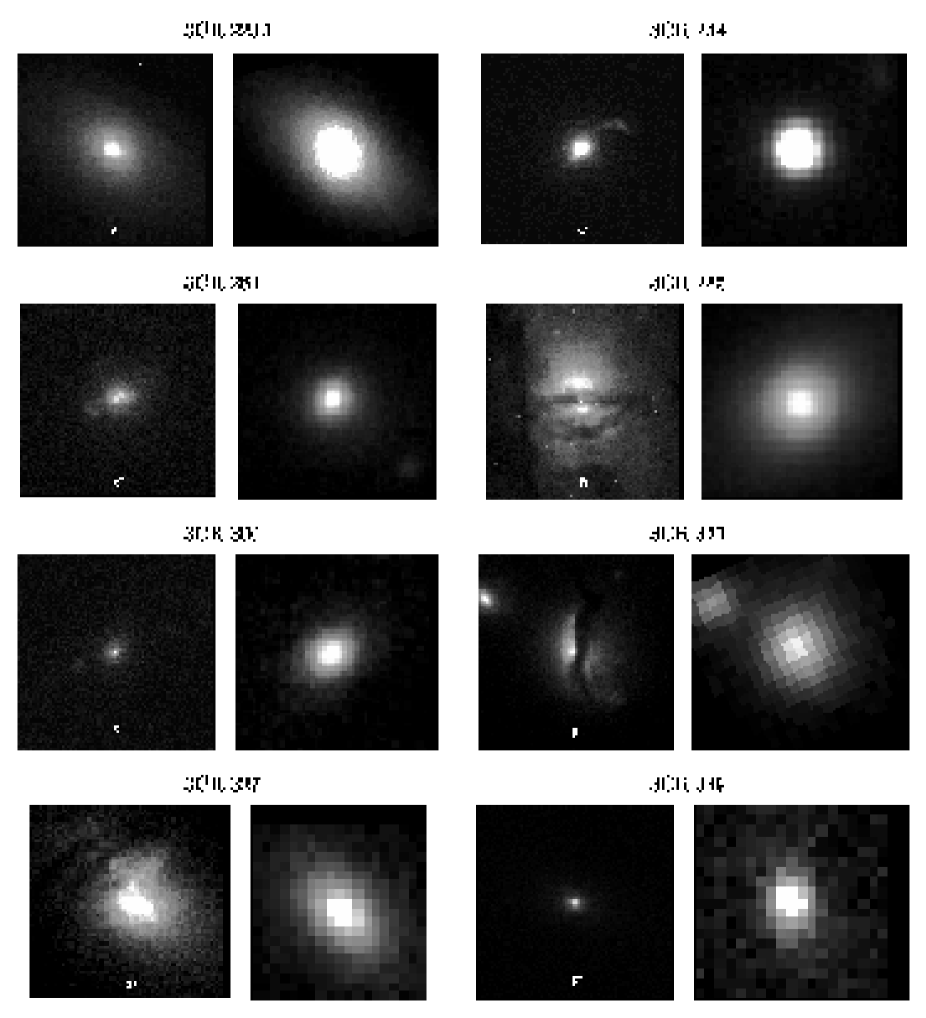
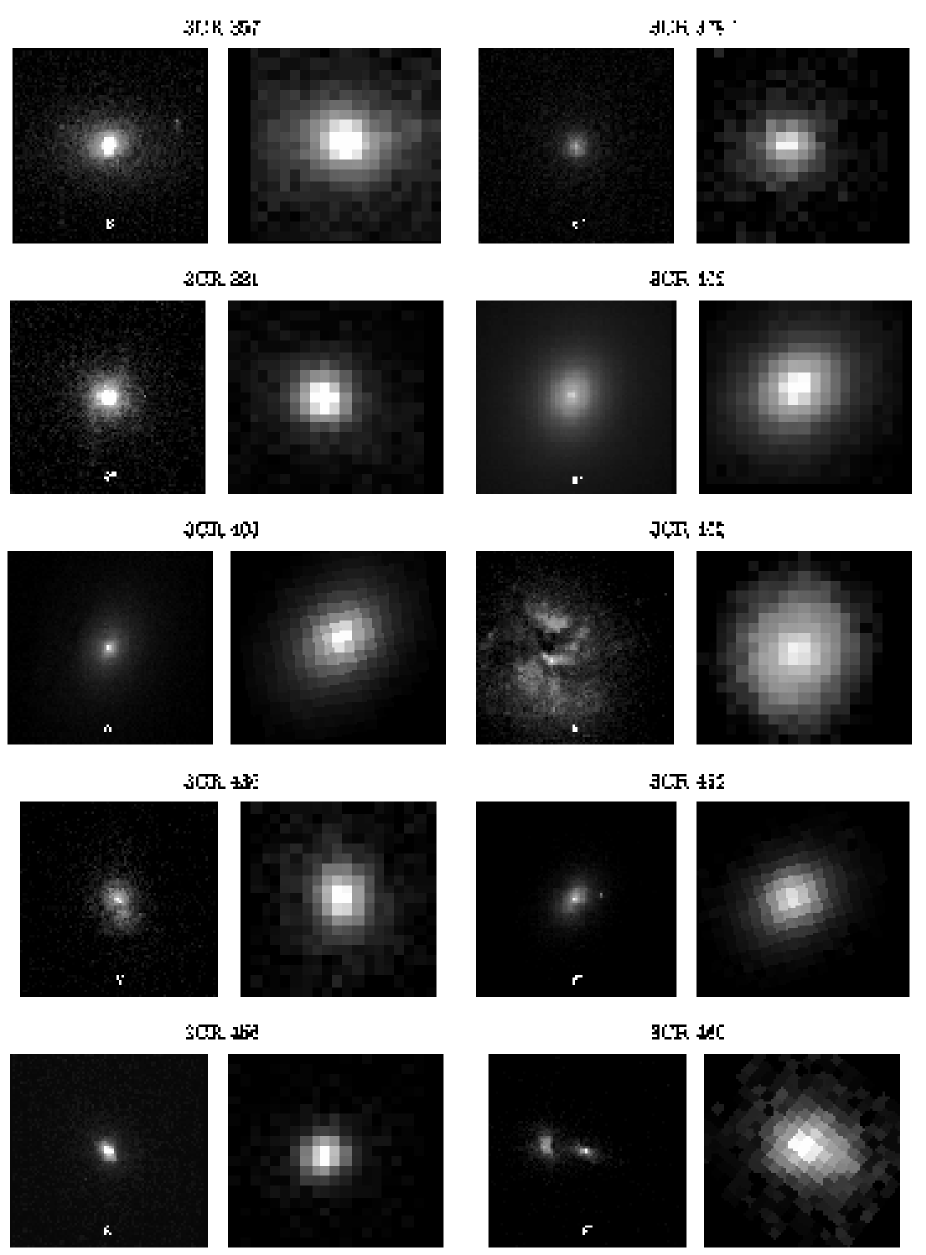
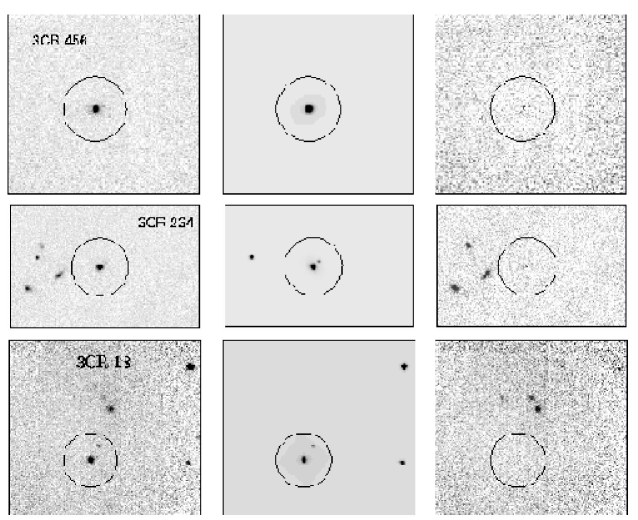
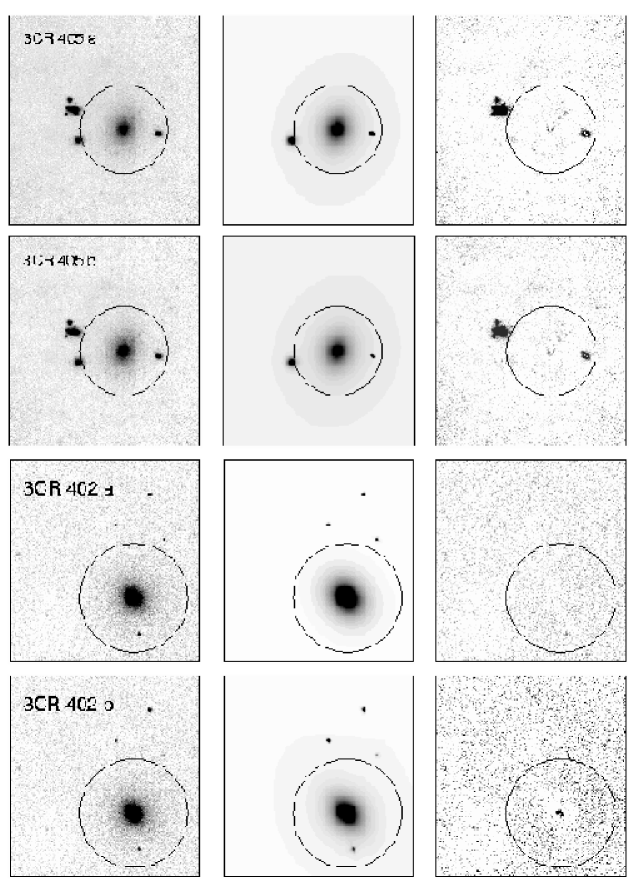
The absolute flux calibration has been compared with data published in the literature, available for 3CR 79, 3CR 98, 3CR 171, 3CR 223, 3CR 234 (SWW00), 3CR 456 and 3CR 460 (de Vries et al. 1998). After correcting for the different filter used [; Neumann, Meisenheimer & Röser 1997], our aperture photometry is perfectly consistent with theirs (the mean difference is 0.020.03 mag, less than our absolute flux calibration error). The images of all sources – together with their corresponding HST ones, see § 3.2 – are shown in Appendix D.
3 Analysis
3.1 The surface brightness decomposition technique
The ‘standard’ technique used to detect and measure point sources at galaxy centers requires a one (or two) dimensional synthetic modeling of the galaxy profile to which a central point source is added. Setting the seeing from observations, free parameters of this procedure are those describing the galaxy profile (e.g. central surface brightness and effective radius) and the intensity of the nuclear source. This technique works well with HST images, not affected by seeing effects, and high quality ground-based photometry of local sources. Indeed only the HST spatial resolution and sensitivity to high surface brightness features (Hutchings & Morris 1995; McLeod & Rieke 1995) have allowed the detection of faint point-like sources at the centre of typical RGs (Capetti & Celotti 1999; CCC99), totally swamped by the host stellar emission at ground-base resolution.
We have applied this procedure to measure the IR nuclear luminosity of our sources, by using the two-dimensional fitting algorithm GALFIT (Peng et al. 2002) designed to extract structural components from galaxy images by simultaneously fit an arbitrary number of them. In Appendix A, the results from such analysis are presented and discussed for representative sources. In summary we find that: 1) for the high sources and those with faint nuclei (such as 3CR 405), the measured can differ by more than a factor of 20 depending on the initial parameters; 2) in many cases the fits are equally good with or without a central point source [even in the case of 3CR 405, in which this is clearly detected both in the HST image and with the color profile analysis (see Appendix B)]; 3) consistent and robust results are obtained only for those objects in which the nuclear component clearly dominates over the host galaxy (e.g. 3CR 456 and 3CR 234). As this method does not provide sound results for objects with faint nuclei or at medium/high , which represent the majority of our sources, we developed and adopted a new procedure, presented in the next section.
3.2 Comparison with HST observations: the color profile technique
The alternative approach we developed takes advantage of the fact that HST images are available for the targets and thus the galaxy profile and (when detected) the intensity of the optical nuclear source are known a priori. Therefore, instead of modeling directly the IR images we compared them to the HST ones (F702W R band filter). The basic idea is that an obscured nucleus would reveal itself through an increase of the IR nuclear flux with respect to what is seen in the optical images.
In order to perform the comparison it is necessary to produce a synthetic HST image matching both the seeing and the pixel size of each IR image. Therefore we fitted a Gaussian to all the stellar objects in the HST field, measured their FWHM and adopted as FWHM the median of all measurements with an uncertainty estimated from their dispersion. The values obtained range between and with a typical uncertainty of 7% (the error on the seeing is between and ). The HST image has been then convolved with a Gaussian with the appropriate FWHM and interpolated to match the pixel size of NICS/ARNICA111We chose to use a Gaussian rather than a real PSF to convolve the HST images because the Gaussian model reproduced well the observed PSF. A small dependence of the PSF shape on the position in the FoV has been detected and accounted for in the error of the estimated Gaussian dispersion, hence allowing us to properly estimate the uncertainty on the derived nuclear NIR luminosity..
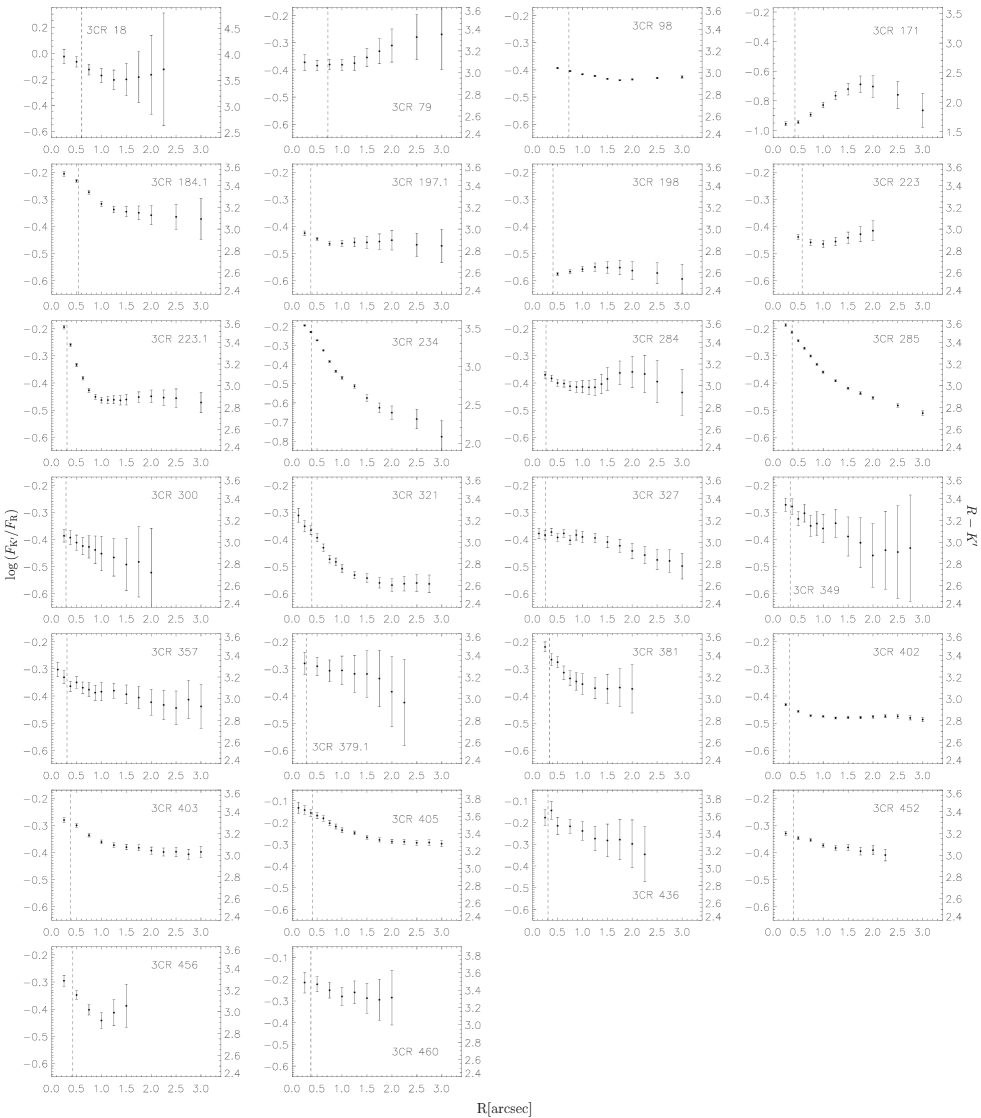
The color-profile method is detailed in Appendix B for two show-case galaxies, namely 3CR 403 and 3CR 300. Briefly, photometry is performed on annuli of increasing radius out to 3″ on the ‘matched’ HST and on the reduced TNG images. An average color (and its associated error) is derived at each annulus. The outer portion of each color profile sets the color of the host galaxy. The nuclear monochromatic -band luminosity is estimated as the sum of , i.e. the measured nuclear IR excess, and , namely the HST optical nuclear component properly scaled with the reference host galaxy color.
Also for all RGs (but two) with an optical nuclear upper limit, a significant IR excess is present in the inner part of the color profile. Clearly in such cases is less accurate: is calculated considering as a detection, and its error takes into account the possibility of equal to zero. For 3CR 327 and 3CR 379.1 instead only an upper limit to the nuclear IR excess could be estimated and therefore is also an upper limit. Four objects (namely 3CR 284, 3CR 321, 3CR 405 and 3CR 436) have optical complex nuclei. In these cases, although no measurement is available for – implying that the resulting should be strictly considered as a lower limit – the ‘true’ value would be very similar to the one estimated if .
3.2.1 Host galaxy properties
In Fig. 1 we present the color profile derived for each source. For the majority of them the host galaxy color is consistent with being constant; only a very few objects show significant gradients or complex behaviour in the profile (see Appendix C for details on individual objects). For 19/26 the outer part of the profile has been fitted with a linear model in order to account for a possible gradient: 5/19 sources (3CR 98, 3CR 285, 3CR 349, 3CR 357 and 3CR 405) show significant (at 3) gradient, while other 7/19 objects (3CR 79, 3CR 223, 3CR 300, 3CR 379.1, 3CR 403, 3CR 436 and 3CR 452) have only marginally significant (1) color gradient. The mean color of the host galaxy is 2.970.29, consistent with the value of =2.750.45 of a sample of RGs and RL QSOs hosts (Dunlop et al. 2003) and with the expected color =2.84 for an elliptical at =0.16 (Poggianti 1997) (the mean redshift of the sample is 0.15). The mean value of the gradient [defined as ] is -0.220.02 mag dex-1, consistent with the values of: i) -0.14 mag dex-1 (with a broad distribution, from 0.62 to 0.15 mag dex-1) of 12 nearby bright elliptical galaxies (Peletier et al. 1990a,b); ii) -0.35 mag dex-1 of a sample of early-type galaxies in the rich cluster AC 118 at =0.31 (La Barbera et al. 2002); iii) =-0.20.1 mag dex-1 for the host galaxies of BL Lac objects, thought to be normal ellipticals (Scarpa et al. 2000) (the and host galaxy profiles should be similar as dominated by slowly evolving red stars). We conclude that based on their colors and color gradients the hosts of the studied sample of HEG RGs are perfectly consistent with being normal ellipticals.
3.2.2 IR nuclear measurements accuracy
Clearly, effects other than nuclear obscuration might cause a color change, such as extinction by extended dust structures or age/metallicity gradients in the stellar population. As stated above, 50% of the objects show gradients, with only 20% statistically significant. Such gradients indeed represent the main limiting factor for the accuracy of the color profile method. However, in most of the cases showing gradients, the estimates of based on the outer color gradient modeling or assuming a flat profile differ by 0.2 dex, and never more than a factor 2 (see also Appendix B for the case of 3CR 403). Only 3CR 357 and 3CR 379.1 show larger differences, 0.44 and 0.57 dex, respectively; for the latter one, which has been excluded from further analysis, only an upper limit for could be estimated. Only 2 (out of 26) objects (3CR 171222The source 3CR 171 is very peculiar, having a very bright narrow-line emission region co-spatial to the radio emission (Tadhunter et al. 2000), indicative of jet-cloud interaction; the contribution to the HST image from line emission is large, if not dominant (de Koff et al. 2000). Its observed color profile (see Fig. 1) is complex, with a central optical excess likely due to the strong line emission contribution (see also Appendix C for details). We therefore neglect this object in the following analysis. and 3CR 284) show complex profiles. Therefore, we can conclude that for most sources the color profile is sufficiently well behaved that our rather simple technique provides robust estimates of the IR nuclear fluxes, with significantly higher accuracy than the surface brightness decomposition method.
Before proceeding any further, it is also crucial to assess the effect of the uncertainty in the seeing measurement on the color profile as this is the only free parameter of the analysis. In Fig. 2 we compare profiles obtained varying the measured FWHM of 3CR 403 by 9% (corresponding to the variance of the different measurements of seeing for this source, slightly larger than that typical of the studied sample). The differences between the profiles are only marginal, being less than 0.04 in color at 05 and completely negligible at 1″. As detailed in Appendix B, this implies an uncertainty on the nuclear IR luminosity in the range 0.02-0.2 dex depending on the specific source.

A crucial test for the robustness of our procedure is given by the comparison with the results from direct imaging for the three sources for which HST-NICMOS observations are publicly available, namely 3CR 405, 3CR 456 and 3CR 460 (for details see Appendix C). For 3CR 405, Tadhunter et al. (1999) found a nuclear point-like source with a luminosity of (4.10.2)1041 at 2.25 m. In the hypothesis of a flat outer profile, we estimated a nuclear luminosity of (7.30.9)1041 at 2.12 m, about 0.25 dex larger. However, by modeling the small color gradient at radii 125, we obtained 1041.66±0.09 , perfectly consistent with the NICMOS result. For 3CR 456 and 3CR 460 NICMOS-NIC2 images are available in the public archive at STScI. A central point-like source is clearly present in 3CR 456 with a luminosity of 1043.63±0.09 at 2.05 m. After modeling the outer color gradient, we estimated 1043.46±0.04 , within 2 from the HST value. In the HST image of 3CR 460 only extended emission is visible. An upper limit on the IR nuclear luminosity of 1042.82 at 2.05 m has been estimated, consistent with our measurement of =1042.79±0.19 . Considering the different methods, aperture and spatial resolution of the above observations, the agreement between the HST images and the color profile analysis results is quite remarkable. Early results from new HST/NICMOS observations confirm our measurements for 3CR 79, 3CR 379.1 and 3CR 403 (M. Chiaberge, priv. comm).
It thus turns out that the color radial profile method returns values of correct within at most a factor of 2, and most likely with an average error of 0.2 dex in log, even for very faint nuclei (e.g. 3CR 405). The high accuracy basically follows from the information provided by the high spatial resolution optical HST imaging. In Table 2 the measured values of the nuclear for the HEG sample are listed; the details of the analysis for the individual objects can be found in Appendix C.
| Name | a | b | c | d |
|---|---|---|---|---|
| (mag) | (%) | (mag) | ||
| (1) | (2) | (3) | (4) | (5) |
| 3C 18 | 43.660.06 | 1.870.27 | 0 | 1.90.3 |
| 3C 33 | – | – | – | – |
| 3C 63 | – | – | – | – |
| 3C 79 | 42.870.21 | -0.120.87 | 5.5 | 60 |
| 3C 98 | 41.80 | 6.190.28 | 0.43 | 17.0 |
| 3C 105 | – | – | – | – |
| 3C 135 | – | – | – | – |
| 3C 153 | – | – | – | – |
| 3C 171 | – | – | – | – |
| 3C 184.1 | 43.160.04 | 1.670.30 | 7.0 | 19.5 |
| 3C 192 | – | – | – | – |
| 3C 197.1 | 42.810.07 | 0.560.38 | 0 | 0.60.4 |
| 3C 198 | 42.570.10 | -0.120.47 | 0 | -0.10.5 |
| 3C 223 | 42.43 | 2.340.33 | 0.88 | 33.2 |
| 3C 223.1 | 43.030.04 | 5.080.30 | 0 | 5.10.3 |
| 3C 234 | 44.060.04 | 1.550.30 | 6.3 | 21.5 |
| 3C 284 | 42.340.33 | – | – | – |
| 3C 285 | 42.350.04 | 8.460.30 | 0 | 8.50.3 |
| 3C 300 | 42.540.16 | 0.710.69 | 3.0 | 37.7 |
| 3C 321 | 42.730.06 | – | – | – |
| 3C 327 | 41.77 | 2.580.29 | 0.22 | 44 |
| 3C 349 | 43.020.11 | 1.150.50 | 0 | 1.20.5 |
| 3C 357 | 42.190.35 | 2.861.41 | 1.0 | 29 |
| 3C 379.1 | 42.04 | 1.030.28 | – | – |
| 3C 381 | 42.98 | 3.530.38 | 1.0 | 24.5 |
| 3C 402 | 41.590.06 | 1.710.35 | – | – |
| 3C 403 | 42.270.05 | 4.170.33 | 0.88 | 21.91.1 |
| 3C 405 | 41.660.09 | – | – | – |
| 3C 436 | 42.530.36 | – | – | – |
| 3C 452 | 42.04 | 2.300.47 | 2.5 | 24.0 |
| 3C 456 | 43.460.04 | 1.550.30 | 6.0 | 22.0 |
| 3C 460 | 42.790.19 | 2.460.80 | 6.3 | 14.7 |
a : total luminosity at 2.12 m estimated as in § 3.2;
b Nuclear extinction from eq. 1;
c Fraction (percentage) of the total nuclear emission scattered toward the line-of-sight (from Fig. 6); 0 means that the emission is consistent with transmitted light both in optical and NIR;
d Torus extinction (from Fig. 6).
4 Results
4.1 Nuclear properties of narrow and broad lined RGs
As pointed out in § 1, in the standard unification picture, HEGs are believed to be intrinsically identical to BLRGs, and obscuration by a dusty torus is thought to be responsible for their different nuclear properties. In this scenario HEGs should be indistinguishable from BLRGs when comparing isotropic quantities such as the [OIII] line luminosity, , and the total radio luminosity at 178 MHz, . This indeed appears to be the case: Fig. 3 shows versus for the complete samples of HEGs and BLRGs drawn from the 3CR sample within 0.3 (from CCC02). The Kolmogorov-Smirnoff test and the mean values of the two quantities are consistent with the two populations being drawn from the same parent distribution (see Tab. 3 for a summary of the statistical comparisons between HEGs and BLRGs).

| Sample | HEG | BLRG | |
|---|---|---|---|
| 33.770.48 | 33.740.50 | 0.99 | |
| 41.830.59 | 41.940.45 | 0.65 | |
| 30.770.75 | 31.370.42 | 0.06 | |
| 27.790.96* | 28.920.57 | 610-4* | |
| 28.570.63* | 29.340.57 | 0.001* | |
| 28.380.63* | — | 0.04* | |
| 28.800.63* | — | 0.04* | |
| 44.80.4 | 44.30.4 | 0.13-0.18 |
* only detections for HEGs are considered; in this case, the probabilities that the observed and distributions are drawn from the same parent population are =0.89 and =0.57, respectively.
This unification scenario can now be further tested by including the information on the nuclear NIR luminosities. In Fig. 4 we have plotted the nuclear optical and IR luminosity, and versus , for both HEGs and BLRGs333We have chosen to use the isotropic instead of (as done by CCC02) since the latter is likely affected by beaming (BLRGs show brighter radio cores with respect to HEGs – see Tab. 3).. As already shown by CCC02, BLRGs have systematically larger with respect to HEGs: after excluding the upper limits (i.e. optically undetected HEGs) BLRGs are brighter on average by a factor 13 (including HEG upper limits increases the difference). Essentially the same result holds for the IR nuclear luminosity (see Fig. 4, right panel): the BLRG sub-sample is characterized by larger 444For BLRGs has been estimated from (from CCC02) assuming an optical-to-infrared spectral index typical of QSOs (Elvis et al. 1994). with respect to HEGs even though by a factor ( 6) smaller than in the optical band.
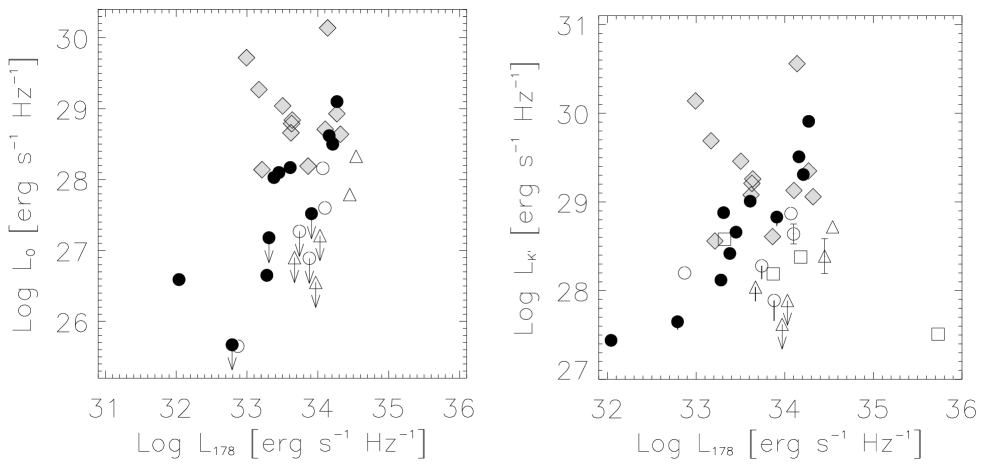
In order to assess whether and to which degree the different optical/IR luminosities could be ascribed to absorption, we estimate the amount of obscuration () from the comparison of the observed ratio with an intrinsic (assumed) value of such ratio, . More specifically:
| (1) |
where -0.42555With a typical error of 0.2 dex (Elvis et al. 1994). is assumed equal to that typical for RL QSOs (Elvis et al. 1994) (and corresponds to an optical-to-infrared spectral index of 0.87). The estimated extinctions are listed in Table 2 (column 3): their range is mag, with only 3 exceptions.
From these values of an extinction corrected nuclear optical luminosity can be inferred from (Cardelli, Clayton & Mathis 1989). Even after correcting for the estimated nuclear extinction, the BLRG optical luminosities systematically exceed those of HEGs (see Tab. 3). Clearly, this still holds for the NIR nuclear luminosity, only marginally affected by the relatively small (see Tab. 3). Thus, based on the optical/NIR nuclear continuum properties, HEGs and BLRGs do not seem to belong to the same parent population even after absorption (inferred from the ratio between optical and NIR nuclear emission) is taken into account. This seems to imply that HEGs could be intrinsically fainter than their putative BLRGs counterparts (having similar narrow line and extended radio luminosities).
4.2 Nuclear and emission line properties
This result appears however to be in contradiction with the similarity in the distributions for HEGs and BLRGs, as the same intrinsic nuclear radiation field would be expected to maintain similar gas photo-ionization and line luminosities (if indeed photoionization by the nuclear radiation field is indeed the chief mechanism producing ).
In such hypothesis, for more quantitative estimates we report in Fig. 5 the ratio between (from Table 2) and the ionizing luminosity . has been estimated from the total luminosity in narrow lines [inferred from (Table 1) as and ; e.g. Rawlings & Saunders 1991], as , adopting a covering factor 0.01666Note that the precise value of is ininfluent in the following analysis.. For BLRGs, 1.10.47.

When compared with the typical values for BLRGs, thus represents the ‘discrepancy’ between the nuclear emission as inferred from the lines and the estimated for HEGs. The representative values for BLRGs are indicated in Fig. 5 by the shaded area (accounting for the dispersion of 0.47 dex of BLRGs around their mean value shown as continuous line). As is affected by obscuration [as ], we plotted this ratio against the observed , which corresponds to (reported on the upper axis). Obscuration then ‘moves’ the position of sources in this plane along a line parallel to the continuous one. Therefore, if nuclear obscuration is the only cause of the differences between HEGs and BLRGs, then HEGs should be located within the shaded area, depending on the amount of obscuration reflected in their optical-NIR colors. However, only 30% of HEGs are consistent with this picture. For most sources, instead, the observed is much larger than that typical of BLRGs – even when extinction is considered – up to factors larger than 20 (for detections). We conclude that obscuration alone cannot account for the differences in the optical/NIR nuclear properties of HEGs and BLRGs with respect to the similarity in their narrow line emission.
4.3 The role of scattering in HEGs
An ingredient we have so far neglected is the possible presence of a nuclear component due to scattered light. As reported by CCC02, there are at least two sources (3CR 234 and 3CR 109) for which spectropolarimetric studies indicate that their optical nuclear component corresponds to a compact scattering region, whose luminosity indeed matches the optical nuclear emission seen in the HST images. CCC02 argued that the HST optical cores in most HEGs can indeed be produced by scattering.
The presence of a scattered component radically changes the interpretation of our results. Let us examine the consequences of this hypothesis in a simple scenario, where the observed nuclear luminosity is simply due to direct light attenuated by a dusty torus characterized by an extinction , and a fraction of the total nuclear light () scattered toward the line-of-sight. E.g. in the band:
| (2) |
For =0.751 and =0.12 then:
| (3) |
and
| (4) |
where -0.42 and 1.10.47 are the typical values for BLRGs.
The effect of the two added (free) parameters, and , on and – i.e. the plane defined in Fig. 5 – can be graphically seen in Fig. 6 as dotted and dot-dashed lines (obtained from eq. 3 and 4 by fixing and letting run, and vice-versa). As an illustrative example, let us concentrate on the line representing . For low values of obscuration ( mag) the transmitted light exceeds the scattered fraction both in the optical and NIR. A source ‘moves’ along the solid tilted line simply describing the effects of increasing nuclear obscuration. For larger values of the transmitted optical component becomes increasingly negligible with respect to the scattered one and is essentially constant and equal to . On the other hand keeps decreasing, i.e. increases, causing the turnover toward the bottom left corner of the diagram. Only for values of mag the scattered and transmitted -band light become comparable: the ‘track’ then halts to the intrinsic ratio with luminosities reduced to a fraction on the intrinsic ones.

The properties of all HEGs reported in Fig. 6 can then be interpreted with different contributions of transmitted and scattered light: their location in Fig. 6 translates into constraints on and (listed in Table 2 for each source). Only 6 sources, located close to the continuous line, are consistent with being BLRGs seen through a small amount of dust, with mag. The majority of HEGs require larger obscuration, namely 15 50 mag, and their optical cores can only be due to scattering. The scattered fraction ranges between 0.2 and 7%: indeed HEGs with detected optical nucleus in the HST images have , while objects for which no optical HST source is seen correspond to upper limits in the range 0.2 - 2.5%. Clearly the values of extinction derived from the ratio (§ 4.1) systematically underestimate the nuclear absorption.
Summarizing: within this simple scenario, for the majority (70%) of HEGs both nuclear absorption by a dusty torus and scattering of the nuclear light are required to unify them with BLRGs. At optical wavelengths, the scattered component usually dominates (except for the few sources which are characterized by a low ), while in the NIR the nuclear light is generally transmitted through the torus, attenuated by a factor typically 10 but up to .
So far we have neglected the effects of redshift, having assumed that all HEGs are at =0 in order to avoid introducing uncertainties due to the unknown spectral shape. In order to quantify these effects on our results, we have repeated the above analysis assuming =0.15, which is the median redshift of the BLRG and HEG populations (the distribution of the two population are statistical identical, with a Kolmogorov-Smirnov probability =0.81). At =0.15, the observed optical and NIR luminosities correspond to rest-frame wavelengths 0.6 and 1.85 m, respectively. Consequently, we have re-estimated the rest-frame values for and , and the extinction at the appropriate wavelengths. The newly estimated values for are smaller by 25% compared to those for =0 (the rest-frame bands correspond to shorter wavelengths, where the extinction is higher), the fractions are almost unaffected. No trend of with is present. We conclude that our results are not significantly affected by the =0 assumption adopted.
An important test of our findings is provided by FIR information, as the FIR luminosity should be orientation-independent. A few HEGs and BLRGs in our sample have published FIR (60 m) luminosities () (Heckman et al. 1994; Haas et al. 2004). Within the large uncertainties and low statistics, the distributions of for HEGs and BLRGs are consistent with being drawn from the same population (see Table 3) and the observed ratio of HEGs is consistent with that of BLRGs once the extinction due to the dusty torus is taken into account, as shown in Fig. 7 (upper panel). The same test can be performed using MIR (12 m) luminosities () (Heckman et al. 1994; Siebenmorgen et al. 2004). In Fig. 7 (lower panel) the observed ratio is plotted instead of . Absorption in the MIR has been taken into account by using the extinction law with standard graphite-silicate mixes (e.g. Draine 1989), which implies . Once the extinction is taken into account, we find full consistency between HEGs and BLRGs (the probability that the distributions of HEGs and BLRGs are drawn from the same parent population is =0.47, when luminosities are corrected for extinction, with =1044.23±0.23 for BLRGs and =1044.59±0.88 for HEGs).

4.4 Comparison with previous works
Three objects (3CR 79, 3CR 223 and 3CR 234) are in common with the small sample of detected sources in SWW00. The estimated extinctions reported by the above authors are consistent with our estimates of , but much smaller than . Taylor et al. (1996) studied a heterogeneous sample of RGs and RL QSOs (matched in total radio luminosity and redshift) using -band imaging. If the RGs and the RL QSOs have the same intrinsic NIR luminosity (as postulated by the unified scheme), the observed difference in their nuclear NIR luminosities could be accounted for by extinctions 8-26 mag, with an uncertainty of 7 mag, consistent with what found in our work. Haas et al. (2004) have studied the MIR and FIR properties of 3CR RGs and quasars, inferring that HEGs are consistent with being misaligned BLRGs if their nuclei are obscured by extinctions in the MIR of 1-2 mag. Using the standard extinction law of Draine (1989), this range corresponds to 27-56, consistent with the range we found.
It is worth also noticing that a search for nuclear point-like UV emission in RGs from HST-STIS images (NUV-MAMA detector at 2300 Å) has revealed positive detection only for one HEG, 3CR 198, implying an extinction of =0.08 mag (Chiaberge et al. 2002), perfectly consistent with the value estimated in this work (-0.120.47 mag). None of the other HEGs targeted (3CR285, 3CR 321 and 3CR 452) show point-like UV emission (Chiaberge et al. 2002). For the only object with an optical detection (3CR 285), assuming =2.26 (Cardelli, Clayton & Mathis 1989), an optical-UV spectral index 1.00.3 (Chiaberge et al. 2002, consistent with that of RL QSOs, Elvis et al. 1994) and a UV flux limit of 1.910-19 (the lowest detection in Chiaberge et al. 2002), we estimate an extinction 3.5 mag, consistent with our previous finding.
4.5 Obscuration vs orientation ?
A key ingredient that should be added into this analysis is the source orientation. In the simplest unified scheme, the system is supposed to be axisymmetric, with the jet direction corresponding to the symmetry axis. The dusty torus, perpendicular to it, would hide the central quasar for angles with the line-of-sight larger than the torus opening angle.
In principle an estimate of the inclination could be derived from the observed correlation between the radio core luminosity at 5 GHz and the radio total luminosity at 408 MHz (Giovannini et al. 2001), e.g. by computing the normalized core power , defined as the source core power normalized to that corresponding to an average observing angle of 60∘ for a given total power (de Ruiter et al. 1990). Within the simplest scheme, one would then expect an anti-correlation between and . Although there seems to be a broad trend for HEGs with lower to have higher extinction (the trend is stronger if BLRGs are also considered), the large uncertainties and low statistics do not allow to draw any significant conclusion.
5 Discussion
From the above results, the following picture emerges for HEGs. On one hand, based on their extended and isotropic properties, HEGs are consistent with being drawn from the same parent population of BLRGs. In particular, HEGs and BLRGs have the same distributions of and . If the narrow-line emission arises from photo-ionization by the nuclear radiation field, the similarity in implies that the intrinsic nuclear luminosities of these populations should also be similar. On the other hand, based on their nuclear optical and NIR luminosities, HEGs and BLRGs do not appear to be taken from the same parent population, with HEGs being significantly underluminous. Except for a handful of sources (3CR 18, 3CR 197.1, 3CR 198, 3CR 223.1, 3CR 285 and 3CR 349), obscuration alone cannot account for such differences. Moreover, for the great majority of HEGs the observed nuclear NIR luminosity is insufficient to account for the narrow-line emission.
However, these findings can be reconciled with the unification scenario for HEGs and BLRGs if a scattered component is present. Indeed CCC02 have suggested that the optical nuclear emission in HEGs can actually be identified with a compact scattering region. It is thus possible that for the majority of HEGs the observed nuclear optical emission is dominated by the fraction of the nuclear light scattered toward the line-of-sight. At NIR wavelengths, instead, both a transmitted (direct) and the scattered component contribute to the observed luminosity. In this (simple) interpretation the fraction of scattered nuclear light ranges from a few tenths of to a few percent, while the torus extinction spans 15 to 50 mag, with only a few exceptions.
This scenario is consistent with independent findings on the best studied object of our sample: 3CR 234. 3CR 234 is characterized by a very high degree of polarization (17% after starlight subtraction) of both the optical continuum and the broad H line (Antonucci 1984), which can be explained only with polarization induced by scattering; also the -band continuum is polarized, at the lower level of 4.60.4% (Sitko & Zhu 1991; see also Young et al. 1998). The flux and polarization properties at optical and NIR wavelengths have been modeled by Young et al. (1998), who concluded that the observed light comprises a scattered component and a dichroic view through the torus which becomes important only at the longer wavelengths. This is qualitatively consistent with our results, although the nuclear extinction they estimated (60 mag) is larger than ours (222 mag).
Among the sample of HEGs we found 6 sources requiring low obscuration. Four of them (3CR 18, 3CR 197.1, 3CR 198, 3CR 349) are consistent with 2 mag, i.e. essentially no obscuration, apparently in contrast with the lack of broad lines in their optical spectra. Interestingly, results obtained during the preparation of this work indicate that 3CR 18 and 3CR 197.1 are actually BLRGs, misclassified as HEGs. A high S/N VLT spectrum revealed a prominent broad (FWHM4500 km s-1) H line in 3CR 18 and a broad H line is clearly visible in the SDSS spectrum of 3CR 197.1. The hypothesis that misclassification affects also 3CR 198 and 3CR 349 appears more likely than the alternative explanation that they actually lack a BLR. Conversely, 3CR 223.1 and 3CR 285 show sufficient obscuration to prevent the detection of broad lines in the optical (e.g. the H would be reduced by a factor 40), but should be easily detected in the NIR. The presence of these low-extinction objects among the sample is particularly interesting with respect to whether there is continuity between HEGs and BLRGs – i.e. if the torus optical depth varies smoothly or if a minimum threshold exists. Higher quality optical and NIR spectra are clearly needed to settle this issue.
The population of HEGs can thus be characterized by a distribution in the amount of absorbing dusty material, although it is not possible from the current data to determine whether this is closely associated to the orientation (i.e. the vertical structure of the torus) or simply to different sources having different amount of dust. In any case, for a handful of HEGs the direct view of the central engine is possible both at optical and NIR wavelengths (might be because the line-of-sight intercepts only the edges of the torus). At higher levels of extinction the nuclear optical light from the central engine is absorbed. The observed point-like optical emission is due to a compact scattering region located ‘outside’ the obscuring torus. At NIR wavelengths, instead, the central nucleus is still directly visible, and both the direct/transmitted light passing through the torus and the scattered components contribute to the observed NIR luminosity. This is the situation for the majority of HEGs. The possibility that even higher extinction is present is some sources remains open (e.g. 3C 379.1 ?), although their number is extremely limited according to our statistics (note that for very high extinction also radiation re-processed by the dust could contribute to the observed emission).
Let us finally compare the ranges of values of the scattering fraction and obscuration we inferred with respect to those estimated in the literature for obscured AGN (also non RL, namely Seyfert 2 galaxies). The scattered fraction in the latter ones spans from less than 0.1% (e.g. NGC 1068, Miller & Goodrich 1991; 3CR 321, Young et al. 1996a, 1996b) up to a few % (e.g. di Serego Alighieri, Cimatti & Fosbury 1994; Kishimoto et al. 2002a; Maiolino, Marconi & Oliva 2000). A rather conservative upper limit of 10% has been estimated for the Seyfert 2 Mrk 477 (Kishimoto et al. 2002b). Our values of are thus broadly consistent with those reported for Seyfert 2, although only for a very few sources this could be truly determined. Also the inferred values for the torus extinction appear to be consistent with those observationally and theoretically estimated for Seyfert 2. For example, some torus models (e.g. Granato, Danese & Franceschini 1997; Fadda et al. 1998) require – in order to reproduce their IR spectra – moderate-to-high visual extinctions (=10-80 mag). The detection of NIR broad emission lines in some Seyfert 2 (e.g. Veilleux, Goodrich & Hill 1997) also indicates that at these wavelengths the nuclei can be directly seen, with estimated from 8 mag up to more than 68 mag.
6 Conclusions
We have presented -band observations of all 3CR HEGs (FR II) at 0.3, providing for the first time homogeneous NIR imaging of a complete sub-sample of RGs. After showing that the technique based on the surface brightness decomposition to measure central point-like sources is affected by large uncertainties for the objects in the studied sample, we have introduced a more accurate method exploiting the color profiles to measure the NIR luminosity of a central point-like source. In all but two HEGs, a substantial -band excess is found, most likely associated to the nuclear emission.
The NIR (2.12 m) nuclear luminosities have been measured for the sources, and used to test the unification scheme for RL AGNs. The picture emerging from this work is that for the majority of the studied HEGs, obscuration alone cannot account for the different nuclear properties of HEGs and BLRGs, and also scattering of the (optically) hidden nuclear light toward the line-of-sight should play a role. For 70% of the HEGs, the observed point-like optical emission is dominated by such scattered component (the direct one being totally absorbed), while in the -band both transmitted light and the scattered one contribute to the observed nuclear luminosity. The estimated fraction of scattered light ranges from a few tenths of to a few percent of the hidden AGN light, while the torus extinction is in the range 1550 mag, with only a few cases with lower obscuration. Interestingly, two of the four HEGs consistent with low levels of obscuration ( mag) turned out to be mis-classified objects in which a prominent BLR emerges in high quality spectra. This hints to the possibility that the remaining two low-obscuration objects are also mis-classified BLRGs.
To further test this scenario, deep NIR spectropolarimetric observations are fundamental for two reasons. Firstly, they should allow to detect hidden broad lines even when affected by a certain amount of extinction. Secondly, a measurement of their polarization can give an estimate of the scattering fraction. Another important piece of information could be provided by polarimetric, multiwavelength observations, as they would allow to discriminate between electron and dichroic scattering. HST-NICMOS observations will be clearly of key importance to determine the presence and measure the luminosity of nuclear point-like sources. Finally, X-ray spectroscopy can provide estimates of the nuclear extinction: assuming a standard gas-to-dust ratio (, Bohlin, Savage & Drake 1978), we expect the HEGs in our sample to be Compton-thin, with column densities in the range =0.3-11023 cm-2.
Acknowledgements.
DM and AC acknowledge the Italian MIUR and INAF for financial support. We thank M. Chiaberge for useful discussions and the anonymous referee for comments and suggestions which helped improving the paper. Funding for the creation and distribution of the SDSS Archive (http://www.sdss.org/) has been provided by the Alfred P. Sloan Foundation, the Participating Institutions, NASA, NSF, the U.S. Department of Energy, the Japanese Monbukagakusho, and the Max Planck Society.References
- Antonucci (1984) Antonucci R., 1984, ApJ, 278, 499
- Antonucci & Barvainis (1990) Antonucci R., Barvainis R., 1990, ApJ, 363, L17
- Bohlin, Savage & Drake (1978) Bohlin R.C., Savage B.D., Drake J.F., 1978, ApJ, 224, 132
- Capetti & Celotti (1999) Capetti A., Celotti A., 1999, MNRAS, 304, 434
- Cardelli, Clayton & Mathis (1989) Cardelli J.A., Clayton G.C., Mathis J.S., 1989, ApJ, 345, 245
- Chiaberge, Capetti & Celotti (1999) Chiaberge M., Capetti A., Celotti A., 1999, A&A, 349, 77
- Chiaberge, Capetti & Celotti (2000) Chiaberge M., Capetti A., Celotti A., 2000, A&A, 355, 873
- Chiaberge, Capetti & Celotti (2002) Chiaberge M., Capetti A., Celotti A., 2002, A&A, 394, 791
- Chiaberge et al. (2002) Chiaberge M., Macchetto F.D., Sparks W.B., Capetti A., Allen M.G., Martel A.R., 2002, ApJ, 571, 247
- Cohen et al. (1999) Cohen M.H., Ogle P.M., Tran H.D., Goodrich R.W., Miller J.S., 1999, AJ, 118, 1963
- Crawford, Fabian & Johnstone (1988) Crawford C.S., Fabian A.C., Johnstone R.M., 1988, MNRAS, 235, 183
- de Koff et al. (2000) de Koff, S., Best, P., Baum, S.A., Sparks, W., Röttgering, H., Miley, G., Golombek, D., Macchetto, F., Martel, A., 2000, ApJS, 129, 33
- de Ruiter et al. (1990) de Ruiter H.R., Parma P., Fanti C., Fanti R., 1990, ApJ, 227, 351
- de Vries et al. (1998) de Vries W.H., O’Dea C.P., Perlman E., Baum S.A., Lehnert M.D., Stocke J., Rector T., Elston R., 1998, ApJ, 503, 138
- di Serego Alighieri, Cimatti & Fosbury (1994) di Serego Alighieri S., Cimatti A., Fosbury R.A.E., 1994, ApJ, 431, 123
- Draine (1989) Draine B.T., 1989, in Proc. 22nd ESLAB Symp. on IR Spectroscopy in Astronomy, ed. B.H. Kaldeich, ESA SP-290, 93
- Dunlop et al. (2003) Dunlop J.S., McLure R.J., Kukula M.J., Baum S.A., O’Dea C.P., Hughes D.H., 2003, MNRAS, 340, 1095
- Efstathiou, Hough & Young (1995) Efstathiou A., Hough J.H., Young S., 1995, MNRAS, 277, 1134
- Elvis et al. (1994) Elvis M., Wilkes B.J., McDowell J.C., Green R.F., Bechtold J., Willner S.P., Oey M.S., Polomski E., Cutri R., 1994, ApJS, 95, 1
- Fabian & Rees (1995) Fabian A.C., Ress M.J., 1995, MNRAS, 277, L55
- Fadda et al. (1998) Fadda D., Guiricin G., Granato G., Vecchies D., 1998, ApJ, 496, 117
- Fanaroff & Riley (1974) Fanaroff B.L., Riley J.M., 1974, MNRAS, 167, 31
- Giovannini et al. (2001) Giovannini G., Cotton W.D., Feretti L., Lara L., Venturi T., 2001, ApJ, 552, 508
- Granato, Danese & Franceschini (1997) Granato G., Danese L., Franceschini A., 1997, ApJ, 486, 147
- Haas et al. (2004) Haas, M., Mueller, S.A.H., Bertoldi, F., Chini, R., Egner, S., Freudling, W., Klaas, U., Krause, O., Lemke, D., Meisenheimer, K., Siebenmorgen, R., van Bemmel, I., 2004, A&Aaccepted, astro-ph/0406111
- Heckman et al. (1994) Heckman, T.M., O’Dea, C.P., Baum, S.A., Laurikainen, E., 1994, ApJ, 428, 65
- Hill, Goodrich & DePoy (1996) Hill G.J., Goodrich R.W., DePoy D.L., 1996, ApJ, 462, 163
- Hutchings & Morris (1995) Hutchings J.B., Morris S.C., 1995, AJ, 109, 1541
- Jackson & Rawlings (1997) Jackson N., Rawlings S., 1997, MNRAS, 286, 241
- Jones (1989) Jones T.J., 1989, ApJ, 346, 728
- Kishimoto et al. (2002a) Kishimoto M., Kay L.E., Antonucci R., Hurt T.W., Cohen R.D., Krolik J.H., 2002a, ApJ, 565, 155
- Kishimoto et al. (2002b) Kishimoto M., Kay L.E., Antonucci R., Hurt T.W., Cohen R.D., Krolik J.H., 2002b, ApJ, 567, 790
- Kraft et al. (2003) Kraft R.P., Hardcastle M.J., Worrall D.M., Murray S.S., 2003, BAAS, 203
- Kulkarni et al. (1998) Kulkarni V., et al., 1998, ApJ, 492, L121
- La Barbera et al. (2002) La Barbera F., Busarello G., Merluzzi P., Massarotti M., Capaccioli M., 2002, ApJ, 571, 790
- Laing et al. (1994) Laing R.A., Jenkins C.R., Wall J.V., Unger S.W., 1994, in The First Stromlo Symposium: The Physics of Active Galaxies, ed. G.V. Bicknell, M.A. Dopita, & P.J. Quinn, ASP Conf. Ser., 54, 201
- Lilly & Longair (1982) Lilly S.J., Longair M.S., 1982, MNRAS, 199, 1053
- Maiolino, Marconi & Oliva (2000) Maiolino R., Marconi A., Oliva E., 2000, A&A, 365, 37
- Marconi et al. (2000) Marconi A., Schreier E.J., Koekemoer A., Capetti A., Axon D., Macchetto D., Caon N., 2000, ApJ, 528, 276
- McLeod & Rieke (1995) McLeod K.K., Rieke G.H., 1995, ApJ, 420, 58
- Miller & Goodrich (1990) Miller J.S., Goodrich R.W., 1990, ApJ, 355, 456
- Miller & Goodrich (1991) Miller J.S., Goodrich R.W., Mathews W.G., 1991, ApJ, 378, 47
- Mller et al. (2004) Mller S.A.H., Haas M., Siebenmorgen R., Klaas U., Meisenheimer K., Chini R., Albrecht M., 2004, A&A, 426, L29
- Neumann, Meisenheimer & Röser (1997) Neumann M., Meisenheimer K., Röser H.-J., 1997, A&A, 326, 69
- Ogle et al. (1997) Ogle P.M., Cohen M.H., Miller J.S., Tran H.D., Fosbury R.A.E., Goodrich R.W., 1997, ApJ, 482, L37
- Peletier et al. (1990a) Peletier R.F., Davies R.L., Davies L.E., Illingworth G.D., Cawson M., 1990a, AJ, 100, 1091
- Peletier et al. (1990b) Peletier R.F., Valentijn E.A., Jameson R.F., 1990b, A&A, 233, 62
- Peng et al. (2002) Peng C.Y., Ho L.C., Impey C.D., Rix H.-W., 2002, ApJ, 124, 266
- Poggianti (1997) Poggianti B.M., 1997, A&AS, 122, 399
- Quillen et al. (2001) Quillen A.C., McDonald C., Alonso-Herrero A., Lee A., Shaked S., Rieke M.J., Rieke G.H., 2001, ApJ, 546, 952
- Rawlings & Saunders (1991) Rawlings S., Saunders R., 1991, Nature, 349, 138
- Rawlings et al. (1989) Rawlings S., Saunders R., Eales S.A., Mackay C.D., 1989, MNRAS, 240, 701
- Sambruna, Eracleous & Mushotzky (1999) Sambruna R.M., Eracleous M., Mushotzky R.F., 1999, ApJ, 526, 60
- Scarpa et al. (2000) Scarpa R., Urry C.M., Padovani P., Calzetti D., O’Dowd M., 2000, ApJ, 544, 258
- Sérsic (1968) Sérsic J.-L., 1968, Atlas de Galaxias Australes (Cordoba: Obs. Astron.)
- Siebenmorgen et al. (2004) Siebenmorgen, R., Freudling, W., Krügel, E., Haas, M., 2004, A&A, 421, 129
- Simpson, Rawlings & Lacy (1999) Simpson C., Rawlings S., Lacy M., 1999, MNRAS, 306, 828
- Simpson et al. (1996) Simpson C., Ward M., Clemens D.L., Rawlings S., 1996, MNRAS, 281, 509
- Simpson, Ward & Wall (2000) Simpson C., Ward M., Wall J.V., 2000, MNRAS, 319, 963
- Sitko & Zhu (1991) Sitko M.I., Zhu Y., 1991, ApJ, 369, 106
- Spinrad et al. (1985) Spinrad H., Marr J., Aguilar L., Djorgovski S., 1985, PASP, 97, 93
- Tadhunter et al. (2000) Tadhunter C.N., Villar-Martin M., Morganti R., Bland-Hawthorn J., Axon D., 2000, MNRAS, 314, 849
- Tadhunter et al. (1999) Tadhunter C.N., Packham C., Axon D.J., Jackson N.J., Hough J.H., Robinson A., Young S., Sparks W., 1999, ApJ, 512, L91
- Taylor et al. (1996) Taylor G.L., Dunlop J.S., Hughes D.H., Robson E.I., 1996, MNRAS, 283, 930
- Urry & Padovani (1995) Urry C.M., Padovani P., 1995, PASP, 107, 803
- Veilleux, Goodrich & Hill (1997) Veilleux S., Goodrich R.W., Hill G.J., 1997, ApJ, 447, 631
- Willott et al. (2000) Willott C.J., Rawlings S., Blundell K.M., Lacy M., 2000, MNRAS, 316, 449
- Wills et al. (2004) Wills K.A., Morganti R., Tashunter C.N., Robinson T.G., Villar-Martin M., 2004, MNRAS, 127, 156
- Young et al. (1998) Young S., Axon D.J., Hough J.H., Fabian A.C., Ward M.J., 1998, MNRAS, 294, 478
- Young et al. (1996a) Young S., Hough J.H., Efstathiou A., Wills B.J., Axon D.J., Bailey J.A., Ward M.J., 1996b, MNRAS, 279, L72
- Young et al. (1996b) Young S., Hough J.H., Efstathiou A., Wills B.J., Bailey J.A., Ward M.J., Axon D.J., 1996b, MNRAS, 281, 1206
- Zirbel & Baum (1995) Zirbel E.L., Baum S.A., 1995, ApJ, 448, 521
Appendix A Surface brightness decomposition (GALFIT)
We have applied the ‘standard’ surface brightness decomposition technique to detect and measure point sources at the centre of galaxies by using the two-dimensional fitting algorithm GALFIT (Peng et al. 2002). The host galaxy surface brightness profile was modeled with a Sérsic (1968) profile; the nuclear point-like component was modeled with a Moffat function, the parameters of which have been constrained using the stars present in the FoV.
In Fig. 8 the results of the GALFIT analysis are shown for 3CR 456, 3CR 234 and 3CR 18. These three objects have the largest HST optical nuclear luminosities, 1043 . Moreover, 3CR 456 (as detailed in Appendix C) has been observed with HST-NICMOS, which clearly reveals the presence of a central point-like source with luminosity 1043.63±0.09 at 2.05 m (F205W filter). The GALFIT best fit solution for 3CR 456 returns a magnitude for the central point-like source =14.900.07, which translates into a nuclear luminosity of 1044.06±0.03 at 2.12 m. This is 0.6 dex larger than the value from the HST image. For 3CR 234, the GALFIT analysis gives =13.860.07, implying a luminosity of 1044.25±0.03 . This value is consistent with the one measured by SWW00 of 1044.32 and by Taylor et al. (1996) of 1044.2 from ground-based -band observations. As detailed in Appendix C, the value measured with GALFIT is also consistent with that obtained with the color profile technique. Finally for 3CR 18, GALFIT detects a central point-like source with magnitude =14.970.07, i.e. a nuclear luminosity of 1043.83±0.03 . As for 3CR 234, this value is consistent within a factor 1.5 with the nuclear luminosity measured via the color profile.
In Fig. 9 the results from the GALFIT analysis for 3CR 402 and 3CR 405 are shown. These objects have been chosen because the former is the nearest source (=0.025), while 3CR 405 has been observed with NICMOS (Tadhunter et al. 1999). For both sources, we performed the GALFIT analysis without and with a central point-like source (case A and case B, respectively). For 3CR 405, the NICMOS image (F222M filter) clearly shows a point-like source with a nuclear luminosity of (4.10.2)1041 at 2.25 m (Tadhunter et al. 1999). The GALFIT analysis performed without adding a point-like source is identical to that with a central source with nuclear luminosity a factor 2.5 larger than the NICMOS one: based on the goodness of the fit, it is impossible to detect the presence of a nuclear source in the ground-based image. Moreover, the best-fit brightness of the point-like source measured with GALFIT depends on the initial guessed value, with differences as large as 3.2 mag between best-fit models with the same goodness. A similar result is obtained for 3CR 402, for which the quality of the best-fit models with and without a central point-like source is the same.
We conclude that the standard technique to detect and measure point-like sources at the centre of galaxies (performed with GALFIT) returns stable and consistent results only when the point-like source dominates over the host galaxy (as for 3CR 456 and 3CR 234). This is not the case for the great majority of the objects in the studied sample. As shown for 3CR 405 and 3CR 402, the standard technique cannot be used for faint point-like sources, even for the nearest objects, as the GALFIT analysis becomes unable to detect such component and the resulting luminosities become strongly dependent on the initial values.
Appendix B The color profile technique
The color profile technique is here described in detail. We consider two representative sources. For 3CR 403, a fair example of the ‘good quality’ sample, we illustrate the whole technique, i.e.: estimate the nuclear IR luminosity in the hypothesis of a ‘well-behaved’ color profile, namely a constant outer (galaxy) profile; show how the uncertainty on the seeing measurement affects the final result; repeat the analysis in the more realistic case in which the host galaxy shows color gradients. We then consider 3CR 300, representative of the ‘poor quality’ sample, having a rather noisy color profile.
B.1 3CR 403
As explained in § 3, the basic idea is that the presence of an obscured nucleus will reveal itself with an increase of the IR nuclear flux with respect to what is seen in the optical images. In order to compare the NIR and optical images, it is necessary to produce a synthetic HST image that matches both the seeing conditions and the pixel size of each IR image. We fitted a Gaussian to all objects in the HST FoV which are clearly stellar and measured their FWHM. The adopted FWHM is their median value and its uncertainty was estimated from their dispersion. For 3CR 403, FWHM=0890.08, and therefore the error on the seeing is 9% – slightly larger than that typical for the studied sample. Each HST image has been then convolved with a Gaussian with the appropriate FWHM and interpolated to match the pixel size of the TNG image. On the ‘matched’ HST image and on the reduced TNG one we performed photometry on annuli of increasing radius out to 3″and an average color (and its associated error) was derived for each annulus, providing us with the radial color dependence of the source.
The color radial profile, shown in Fig 10 (left-hand panel), is obtained from:
| (5) |
where and are the annulus fluxes in the TNG and HST image, respectively; the corresponding error is estimated with the standard error propagation.

To estimate the nuclear monochromatic -band luminosity , the -band aperture flux () radial profile is also needed and estimated from the counts within the circular aperture (see Fig. 10, right-hand panel).
For a ‘well-behaved’ profile, can be then estimated with the following steps:
-
1.
the reference host galaxy ‘color’, , is measured in the outer part of the profile (at =275 for 3CR 403);
-
2.
the aperture-corrected nuclear IR excess luminosity is obtained by multiplying the measured nuclear IR excess [defined as , where is the nuclear color] with the corresponding .
-
3.
the HST optical nuclear component is properly scaled with the host galaxy color .
-
4.
is finally estimated as . The error on has been inferred from the standard error propagation, taking into account also the error on (10-20%).
The above procedure has been repeated twice to take into account the uncertainty on the seeing determination: the HST image has been convolved with a Gaussian with a FWHM increased and decreased by its 1 uncertainty and the whole analysis repeated. In Table 4 the derived luminosities are listed. The difference in the final for the different seeing is within the 1 error and of order 0.07 dex.
| FWHM | |||
|---|---|---|---|
| (′′) | () | () | () |
| 089 | 28.280.07 | 27.210.07 | 42.470.07 |
| 0891 | 28.340.06 | 27.210.07 | 42.530.06 |
| 0891 | 28.210.09 | 27.210.07 | 42.400.08 |

As shown in Fig. 11 (upper panel), there is a diffuse IR excess at radii 125 due to a small color gradient, neglected so far. Such gradient has been fitted with a linear model at radii 125, and extrapolated at smaller radii [the profile and the fitted model are shown in Fig. 11 (middle panel)]. This best-fit model is then used as the host galaxy reference at each radius (the associated error has been taken as the scatter around the best-fit) to derive the effective IR excess (Fig. 11, lower panel). In Table 5 the estimated luminosities are listed, also showing the effects of the seeing uncertainty, which is now of order 0.15 dex.
The color gradients indeed represent the main limiting factor for the accuracy of this method. However, in most of the cases showing gradients, the estimates of based on a flat profile or a model of the gradient differ by 0.2 dex, and never more than a factor 2 (only 3CR 357 and 3CR 379.1 show larger differences, 0.44 and 0.57 dex respectively).
| FWHM | |||
|---|---|---|---|
| (′′) | () | () | () |
| 089 | 28.050.05 | 27.260.07 | 42.270.05 |
| 0891 | 28.190.04 | 27.250.07 | 42.390.04 |
| 0891 | 27.840.09 | 27.270.07 | 42.090.08 |
B.2 3CR 300
In Fig. 12 (left-hand panel), the radial color profile for 3CR 300 has been plotted (showing also the effects of the seeing measurement uncertainty, 2% for this source). The profile is quite noisy, and while it is consistent with being constant, a color gradient seems present. For this reason, we modeled the color profile as in § B.1 (the color profile and the fitted model are shown in Fig. 13, left-hand panel).


In Table 6, the estimated luminosities for 3CR 300 are reported. After modeling the color gradient, no significant IR excess is found (see Fig. 13, right-hand panel) and therefore .
| FWHM | |||
|---|---|---|---|
| (′′) | () | () | () |
| 068 | 27.15 | 28.360.07 | 42.540.16 |
| 0681 | 27.26 | 28.370.07 | 42.550.17 |
| 0681 | 27.13 | 28.350.07 | 42.530.16 |
Appendix C Individual galaxies
Here we report the analysis of the radial profile and the results used in the estimate of the nuclear IR luminosity for the individual sources. In Tab. 7 we listed the seeing, the IR excess, the reference host galaxy color , the parameters of the linear model fitted to the outer color profile to account for possible gradients, and short comments. We also comment on individual sources when needed and compare our results with the previous ones – based on the standard technique – by SWW00 and Taylor et al. (1996).
| Source | Seeing | IRE | Comments | |||
|---|---|---|---|---|---|---|
| Name | (′′) | (1028 erg/s/Hz) | (mag) | (mag) | () | |
| 3C 18 | 1.430.20 | 11.32.9 | 3.510.19 | 3.191.86 | 0.221.12 | |
| 3C 33 | 0.870.11 | – | – | – | – | |
| 3C 79 | 1.680.03 | 2.402.26 | 3.090.02 | 2.890.29 | 0.170.16 | =14.790.08a; =14.790.06 (SWW00) |
| 3C 98 | 1.710.06 | 0.430.03 | 2.930.01 | 2.890.02 | 0.030.01 | =14.710.08; =12.600.03 (SWW00) |
| 3C 105 | 1.730.08 | – | – | – | – | |
| 3C 153 | 2.230.07 | – | – | – | – | |
| 3C 171 | 1.020.04 | -9.392.83 | 2.300.14 | – | – | =15.690.12; =15.710.04 (SWW00) |
| 3C 184.1 | 1.260.06 | 3.730.31 | 3.160.05 | 3.230.16 | -0.050.09 | well-behaved color profile |
| 3C 197.1 | 0.870.07 | 0.490.29 | 2.870.02 | 2.870.06 | 0.010.05 | well-behaved color profile |
| 3C 198 | 0.970.03 | -0.140.40 | 2.620.08 | – | – | small nuclear IR deficit |
| 3C 223 | 1.360.06 | 1.350.21 | 2.860.03 | 2.720.17 | 0.130.11 | =14.540.08; =14.580.05 (SWW00) |
| 3C 223.1 | 0.730.11 | 7.000.71 | 2.870.03 | – | – | well-behaved color profile |
| 3C 234 | 0.900.05 | 56.15.4 | 2.310.13 | – | – | =13.480.08; =13.490.05 (SWW00) |
| 3C 284 | 0.630.07 | 1.551.19 | 2.990.06 | – | – | complex profile with a small bump |
| 3C 285 | 0.890.04 | 1.550.13 | – | 3.130.02 | -0.120.01 | largest outer color gradient |
| 3C 300 | 0.680.02 | 0.140.27 | 2.790.24 | 3.110.06 | -0.200.10 | noisy color profile |
| 3C 321 | 0.920.13 | 3.680.17 | 2.600.06 | 2.630.17 | -0.010.08 | well-behaved color profile |
| 3C 327 | 0.610.06 | 0.28 | 3.060.04 | – | – | flat color profile at 1″ |
| 3C 349 | 0.810.03 | 0.551.49 | 3.150.10 | 3.380.05 | -0.220.07 | noisy color profile |
| 3C 357 | 0.710.10 | 0.760.84 | 2.970.12 | 3.160.03 | -0.090.03 | noisy color profile |
| 3C 379.1 | 0.670.03 | 2.166.57 | 3.220.21 | 3.360.09 | -0.120.10 | very noisy color profile |
| 3C 381 | 0.800.11 | 5.401.03 | 3.120.15 | 3.100.40 | 0.010.27 | well-behaved color profile |
| 3C 402 | 0.770.08 | 0.150.03 | 2.820.02 | – | – | well-behaved color profile |
| 3C 403 | 0.890.08 | 1.130.14 | 3.010.05 | 3.150.04 | -0.050.02 | well-behaved color profile |
| 3C 405 | 0.950.04 | 0.320.07 | 3.290.03 | 3.460.02 | -0.060.01 | well-behaved color profile |
| 3C 436 | 0.720.20 | 2.371.94 | 3.330.23 | 3.610.10 | -0.200.09 | noisy profile |
| 3C 452 | 0.960.04 | 0.460.17 | 3.040.04 | 3.140.07 | -0.050.04 | well-behaved color profile |
| 3C 456 | 1.000.07 | 10.81.0 | 2.920.07 | 2.640.41 | 0.280.36 | =14.640.06; =14.630.10 (dV98) |
| 3C 460 | 0.880.10 | 2.206.49 | 3.310.17 | 3.460.31 | -0.040.24 | =14.690.08; =14.710.10 (dV98) |
IRE is the nuclear aperture-corrected infrared (2.12 m) excess ; is the host galaxy color; and are the parameters of the linear model fitted to the observed outer color profiles to account for possible color gradients [when not specified, the outer profile is consistent with being flat (3CR 198, 3CR 223.1, 3CR 234, 3CR 402) or complex (3CR 171, 3CR 284)]; a is the band photometry within a 3′′-aperture for the objects from SWW00, and within a 75-aperture for the sources from de Vries et al. (1998) (dV98).
3CR 079: SWW00 measured 1043.66 , a factor of 4-6 larger than our measurement, and a factor 3-5 fainter than the one reported in Taylor et al. (1996). The discrepancy between these measurements is not easily understandable. While the observed flat profile excludes a possible underestimate of , the standard technique requires a more uncertain modeling of the host galaxy, possibly causing to underestimate the host contribution.
3CR 098: SWW00 measured 1041.28 , while we obtain a luminosity a factor of 3 larger.
3CR 171: A very significant gradient is found, from =175 to the innermost point corresponding to a nuclear IR deficit of (9.392.83)1028 at =05. This might be due to an optical excess caused by the strong line emission present in the inner 4″ (H flux of 2.1210-14 ; Tadhunter et al. 2000).
3CR 223: SWW00 measured 1043.50 , a factor of 10 larger than ours.
3CR 234: Our 3″ aperture photometry is about 0.4 mag larger than the value reported in SWW00. However, using their best fit parameters for the host+nucleus decomposition, we estimate a 3″ aperture photometry of =13.490.05, perfectly consistent with our value. SWW00 measured =1044.32 , a factor 1.8 larger than our measurement, while Taylor et al. (1996) measured =1044.2 . These two values are consistent within the errors, and this is not surprising as this source is dominated by the nuclear emission, and are also consistent with our value.
3CR 327: The profile is characterized by a gradient at radii 1″ and a constant color toward the center (=3.060.04 applying a weighted mean of the innermost 8 points). The inner plateau implies a 1 upper limit of the nuclear IRE of 2.771027 .
3CR 349: The color profile is quite noisy, and the sky dominates the profile at radii 175. Assuming a flat outer (075) color profile, we estimated 1043.09±0.10 . Although very noisy, the color profile shows a gradient in the outer part; we therefore studied the extreme case in which no IRE is present by modeling the color profile. The resulting is 1043.02±0.11 , consistent with the previous estimate.
3CR 357: Assuming a flat outer color profile, we estimated 1042.63±0.21 ; modeling the outer (04) galaxy profile, we obtained 1042.19±0.34 , 0.44 dex smaller than the former estimate.
This object and 3CR 379.1 are the worst ones, with badly constrained (but still within an uncertainty of a factor 3). In the HST image, extended dust lanes are clearly visible within the galaxy, down to the very inner region. In order to test the sensitivity of our analysis to extended dust lanes, we modeled the galaxy in the HST image with an elliptical model (masking out all the visible dust lanes). Then we repeated our analysis using the ‘dust-free’ modeled galaxy profile: the two profiles are very similar (differences well within the error bars). Therefore, we conclude that our analysis is not significantly sensitive to extended dust lanes.
3CR 405: The observed profile is very well-behaved, being flat at radii 2″ with variation 0.01 mag. The nuclear IRE measured is (5.130.64)1027 . 3CR 405 (a.k.a. Cygnus A) has been previously observed with NICMOS (Tadhunter et al. 1999) (F222M filter centered at 2.25 m). Tadhunter et al. (1999) report the presence of a nuclear point source (unresolved, with FWHM 021) which dominates the emission at 2.25 m with a flux =(4.91.0)10-28 . This translates into a luminosity of (4.10.2)1041 at 2.25 m, about a factor 1.8 smaller than the value reported in this work of (7.30.9)1041 at 2.12 m within an aperture of 075. Our larger value is due to the fact that we did neglect the color gradient at 125: if this gradient is fitted with a linear model we obtain =(4.570.94)1041, perfectly consistent with the NICMOS value.
3CR 456: The F205W filter image from the STScI public archive clearly shows the presence of a nuclear point-like source with =1043.63±0.09 at 2.05 m (the error, about 20%, is dominated by the uncertainty on the subtracted background) consistent at the 1.8 level with our measurement.
3CR 460: 3CR 460 has been observed with NICMOS (F205W filter). From the NIC2 image in the public archive the emission is extended, and there is no clear sign of a nuclear point-like source. We set as an upper limit the light excess of the central circular aperture of radius 017, obtaining 1042.82±0.04 at 2.05 m, consistent with our measurement of 1042.79±0.19 at 2.12 m.
Appendix D Optical and NIR images