Infrared luminosities of galaxies in the Local Volume
I.D.Karachentsev1 and A.M.Kut’kin2
1 Special Astrophysical Observatory, Russian Academy of Sciences, Russia
2 Moscow State University, Russia
Abstract
Near-infrared properties of 451 galaxies with distances 10 Mpc are considered basing on the all-sky two micron survey (2MASS). A luminosity function of the galaxies in the K-band is derived within mag. The local ( Mpc) luminosity density is estimated to be /Mpc3 that exceeds (1.50.1) times the global cosmic density in the -band. Virial mass-to-K-luminosity ratios are determined for nearby groups and clusters. In the luminosity range of (, the groups and clusters follow the relation with a scatter of 0.1 comparable to errors of the observables. The mean ratio for the galaxy systems turns out to be significantly lower than the global ratio, , expected in the standard cosmological model with the matter density of . This discrepancy can be resolved if most of dark matter in the universe is not associated with galaxies and their systems.
1 Introduction
Recently published catalog of nearby galaxies (Karachentsev et al. 2004) contains basic observational data on 451 galaxies with distances within 10 Mpc. Along with distances and radial velocities it contains different optical characteristics of galaxies: apparent magnitude in B-band, angular size, morphological type, and also neutral hydrogen line flux and width of HI line. Data presented in the catalog allow one to determine such important properties of the Local Volume as luminosity function, local luminosity density, mass density of baryonic matter or of neutral hydrogen. Being marginally affected by selectional effects, distance (not flux) limited sample of galaxies is the proper standard for comparison with distant samples (like Deep Hubble Field) in analyzing effects of galaxies evolution.
However detailed research of evolutional effects needs in photometric data on the Local Volume not only in B-band, but also in other bands, especially in near Infrared. There are two main reasons for this: 1) variable luminosity of young stellar population of galaxies, that is increasing with star formation rate, introduce small contribution in integral infrared (IR) luminosity of galaxy; 2) decreasing of galaxy’s IR-luminosity due to light extinction in galaxy’s dusty clouds is far less than in B-band. That is why galaxy’s IR luminosity is more reliable indicator of baryonic mass than optical luminosity.
In recent years all-sky survey in IR-bands ( J(1.1 -1.36) microns, H(1.50-1.80) microns, and Ks(2.00-2.32) microns) called 2MASS survey was conducted. This survey became the base for extended objects survey, XSC, that contains near 1.65 millions galaxies with apparent magnitudes in Ks-band 14 mag and angular sizes arcsec (Cutri et al., 1998, Jarrett, 2000). Different photometric and morphological properties of that huge galaxies sample is described by Jarrett et al.(2000, 2003). We used the 2MASS survey data for determination J, H, K magnitudes of galaxies in the Local Volume.
2 Galaxies in the Local Volume, visible in the 2MASS survey.
Infrared J, H, K images of all galaxies with distance estimates within 10 Mpc were examined with NASA Extragalactic Database (NED). After excluding of some cases with questionable identifications of distant 2MASS sources with a nearby galaxy we obtained the sample of 122 galaxies for which the 2MASS XSC catalog contains J, H, K- ”extended” magnitudes. Unlike measured (isophot) magnitudes, J ,H, K extended magnitudes take into account contribution of faint external parts of galaxy by extrapolation along it’s standard brightness profile. Thus, only 27% of the Local Volume galaxies are seen in the 2MASS survey.
The reason for absence of many nearby galaxies is relatively short exposition time (8 sec per frame). And, as a consequence, galaxies of low surface brightness fall below the survey sensitivity threshold, K = 20 mag/sq.arcsec. The low detection rate in the 2MASS survey is typical indeed for galaxy samples limited by distance. For instance, the spiral galaxies of RFGC catalog with angular diameters larger than 0.6 arcmin have a detection rate in the 2MASS about 71% (Karachentsev et al., 2002). Appearance of a galaxy in the 2MASS survey depends on it’s different characteristics: morphological type, absolute magnitude, mean surface brightness. To estimate the J, H, K magnitudes for galaxies of the Local Volume, that are not seen in the 2MASS, we built dependence of color indexes B-K, J-K, H-K for detected galaxies on their morphological types and other parameters. Distribution of 122 nearby galaxies on color index B-K and morphological type in de Vaucouleur’s classification scheme is resulted in upper side of plot 1. Each galaxy is shown as a cross and the median values of color index B-K are shown as diamonds. All apparent magnitudes were corrected for galaxy extinction: and , where is the magnitude of extinction in the B-band from Schlegel et al. (1998). These data show a systematic trend of the mean color index from for early types to for later classes. Similar tendency is also visible for color indexes J-K (lower side in plot 1). The obtained color index dependences on galaxies type satisfactorily match data presented in Jarrett et al. (2003) on plot 20 and 23 for more numerous sample of galaxies of different types. Following Jarrett et al. (2003) correlations ”type - color index” were used for determination of J, H, K-magnitudes for nearby galaxies from their B-magnitudes contained in the catalog (Karachentsev et al. 2004). Results are presented in Appendix accessible as an electronic file. The most useable names of the nearby galaxies are given in the same sequence as in the parent catalog. The infrared magnitudes from 2MASS are shown with two signs after dot, and the calculated magnitudes J, H, K are presented with one sign after dot. Comparison of different methods in estimation of the J, H, K magnitudes showed that a typical error in IR-magnitudes determination is about 0.5 mag.
3 Luminosity function of galaxies in the K-band.
We determined absolute magnitudes of all galaxies from the Local Volume (LV) basing on J, H, K values from Appendix, using galaxy distance estimates from the catalog (Karachentsev et al., 2004) and taking into account Galactic extinction from Schlegel et al. (1998). Plot 2 shows distribution of sample of the nearest galaxies along absolute magnitudes in J (crosses), H (diamands), and K (circles) bands. The most bright galaxy in the LV, NGC 4594 (”Sombrerro”) has absolute magnitude , and the most faint dwarf systems of the Ursa Minoris type have . The maximum of the luminosity function in all J, H, K-bands falls on interval [-15, -17].
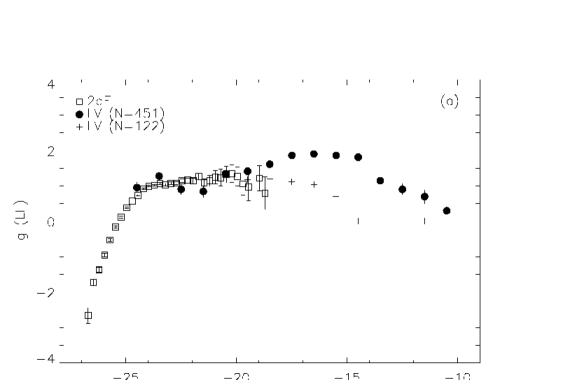
Recently Cole et al. (2001) made an attempt to determine galaxy’s luminosity functions in J and K band. They used the 2MASS photometry of 17173 galaxies with measured redshifts from 2dF survey. Accordingly Cole et al. (2001), luminosity function in the K-band is well represented by Shechter’s function with parameters: km/s Mpc) and on an interval from to . Luminosity function comparison for the 2MASS/2dF sample (squares) and the LV (solid circles) sample is presented in upper side of Plot 3. Statistical errors, are shown as vertical bars. Mutual normalization of two the samples is done near , where statistical errors for these samples are comparable. The luminosity function for the LV galaxies expectedly reaches far away (on seven magnitudes) toward dwarf galaxies. In overlapping region, for , consistency of luminosity functions can be treated as satisfactory, although differences run up to 2-3 standard deviations for some bins. There’s a remarkable flattering of the 2dF luminosity function in region. The obvious reason is because of systematic incompleteness in the 2MASS/2dF sample, so there are many low luminosity dwarf galaxies with low surface brightness that are not detected in the 2MASS survey. That is why there’s a much better consistency of luminosity function for the LV based on only 122 detected in the 2MASS objects (crosses) with Cole’s sample (Cole et al., 2001).
Another possibility for comparison is data on the Virgo cluster of galaxies that can be found in Internet on http://goldmine.mib.infn.it/. This sample contains K-magnitudes for bright members of the Virgo cluster. We estimated K-magnitudes of fainter members being based on their B-magnitudes and dependency of mean color index on morphological type that was found in Jarrett et al. (2003). As a result, the luminosity function for 680 members of the Virgo cluster was obtained (triangles in low side of Plot 3). Mutual normalization of distributions for the Virgo cluster, the LV sample (circles) and the 2MASS/2dF sample (squares) was made for . The distance to the Virgo cluster was taken equal to 17.0 Mpc (Tonry et al. 2000). As can be seen, the Virgo cluster luminosity function reveals some excess in supergiant galaxies that is expected in terms of formation scenario for the most massive galaxies as a merging result for normal and dwarf galaxies. On the faint end it extends up to , that is on 5 magnitudes further than for the 2MASS/2dF sample. Systematic differences between the Virgo cluster and the LV samples on the faintest absolute magnitudes are obviously due to underestimation in number of cluster’s dwarf members, for which estimations of radial velocities are still missing. The last fact doesn’t allow one to either rank them as members of the Virgo cluster or as just background galaxies.
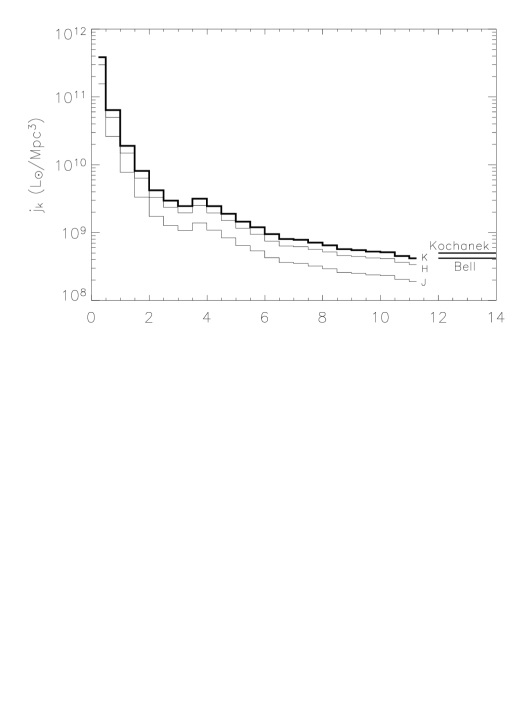
Using distribution of the LV galaxies on absolute magnitudes and distances we calculated the mean luminosity density as a function of sphere radius centered in our Galaxy. Plot 4 shows a luminosity density (in sun luminosity per cubic Mpc units) dependence on distance separately for J, H and K-bands. The mean luminosity density falls down on two orders of magnitude on scales from 1 to 10 Mpc, reflecting fractal character of galaxies distribution. Completeness of the catalog was estimated as on 70% level within distance D=8 Mpc. Some dwarf galaxies in outlying regions of the LV Mpc) and in regions of strong extinction on galactic latitudes II could be easly missed from the catalog. However lack of dwarf galaxies in practice doesn’t affect on estimation of luminosity density because more than 90% of the integrated luminosity accounts on bright galaxies constituting interval that is within 4 magnitudes from the level of the brightest galaxy.
Photometry of galaxies in the 2MASS survey was used by Kochanek et al. (2001) and Bell et al. (2003) for global mean luminosity density estimation in K-band, . Using data on redshifts for galaxies from the Sloan sky survey and other sources, these authors obtained values /Mpc3 and / Mpc3, correspondingly. These values are shown as two horizontal lines on Plot 4. Thus, our calculated K-band mean luminosity density within 8 Mpc, / Mpc3, (1.4-1.6) times exceeds the global one. Note that a ratio of local to global mean luminosity density in the B - band, that is (1.4 - 2.0), contains more uncertainty because of different methods for accounting of internal absorption in galaxies.
4 Mass-to-K-luminosity ratio for nearby galaxies.
Almost 2/3 of the LV galaxies were detected in the HI line. That allowed us to determine mass of hydrogen in these galaxies, M(HI), using observed flux in HI, as well as the total galaxy mass inside the standard radius, , using a width of the HI line corrected for the galaxy inclination. The total mass-to-luminosity ratio and the HI mass-to-luminosity ratio are important global parameters of a galaxy that depend on the features of galaxy evolution: star formation rate, frequency of merges etc. Mass-to-blue luminosity ratio distribution for the LV galaxies was discussed by Karachentsev et al.(2004). Distribution of calculated for the B and the K-bands for the nearby galaxies is shown in the upper side of Plot 5. Similar ratio for hydrogen mass per unit luminosity in the B and the K-bands is shown in the lower side of Plot 5. Galaxies with directly determined K magnitudes from the 2MASS survey are shown as squares and galaxies with estimations of IR-luminosities through their color (B - K) and morphological type shown as crosses. As can be seen the transition from optical to infrared luminosities of galaxies doesn’t lead to expected decreasing in dispersions for and M(HI)/L values. This obviously results from a low accuracy in determination of IR-luminosity for nearby galaxies, which are mostly low surface brightness dwarf galaxies.
Distribution of integrated K-luminosity and ratio for the LV galaxies is shown in logarithmic scale in Plot 6. It is evident from these data that the mean mass-to-luminosity ratio remains nearly constant over the IR-luminosity range of 5 orders being equal to . Basing on Salpeter’s conception on initial stellar mass function, Persic& Salucci (1992), Fukugita et al. (1996), Kochanek et al. (2001), and Cole et al. (2001) estimated the mean stellar mass density in the Universe. Following them and Bell et al. (2003), the stellar component contains from the critical density with H=72 km/s Mpc or in solar mass and luminosity units. Thus, the stellar mass component (+ mass of gas) consistent within error range with the mean galaxy mass inside it’s standard radius. Consequently, nonvisible forms of matter (dark halo) contribute secondary in the integrated mass of galaxy inside it’s standard radius. This is considered both to normal and dwarf galaxies within to luminosity range.
5 Mass-to-K-luminosity ratio in systems of galaxies
As well known, mass-to-luminosity ratio in systems of galaxies increases with transition from double and triple systems to groups, clusters and superclusters. Character of this dependency in the B- band was discussed by Karachentsev (1966), Bahcall et al. (2000) and many others. There are reasons to believe that this dependence must be clearer in IR then in optical. Recently Lin et al. (2003) explored IR properties of 27 galaxy clusters and showed that mass dependence on K-luminosity of clusters expresses in relation , where masses of clusters were obtained using their X-ray fluxes. Estimations of were made for some others systems of galaxies too. Summary of these data can be found in Table 1, where we also show masses and K-luminosities obtained for nearby groups of galaxies. First column indicates name of galaxy or system, in some cases we give the spatial scale using in the mass determination. Second column indicates integrated K-band luminosity of the object/system in units of solar luminosity. Third and fourth columns indicate total mass and mass-to-K-luminosity ratio, respectively. And the last one contains information about sources of the mass estimations.
| Object | Notes | |||
|---|---|---|---|---|
| LV galaxies | 1.0 E07 | 1.5 E07 | 1.50.2 | |
| LV galaxies | 1.0 E09 | 1.3 E09 | 1.30.2 | |
| LV galaxies | 1.0 E11 | 1.1 E11 | 1.10.2 | |
| NGC 5128 (80kpc) | 1.1 E11 | 5.0 E11 | 4.7 | Peng et al.(2004) |
| NGC 4636 (35kpc) | 1.6 E11 | 1.5 E12 | 9.7 | Loewenstein & Mushotsky (2002) |
| NGC 1399 (106kpc) | 2.8 E11 | 5.2 E12 | 18.75.7 | Jones et al.(1997) |
| M31 group | 6.3 E10 | 8.4 E11 | 13.4 | Karachentsev (2005) |
| Local Group | 1.1 E11 | 1.2 E12 | 11.23.5 | Karachentsev (2005) |
| M81 group | 1.5 E11 | 1.6 E12 | 10.6 | Karachentsev (2005) |
| IC 342 group | 5.6 E10 | 7.6 E11 | 13.5 | Karachentsev (2005) |
| Maffei group | 7.2 E10 | 1.0 E12 | 14.0 | Karachentsev (2005) |
| M83 group | 6.8 E10 | 1.0 E12 | 15.2 | Karachentsev (2005) |
| CenA group | 1.4 E11 | 3.0 E12 | 21.3 | Karachentsev (2005) |
| Leo-I group | 3.5 E11 | 7.2 E12 | 20.5 | Karachentsev & Karachentseva (2004) |
| NGC 6946 group | 6.8 E10 | 8.0 E11 | 11.7 | Karachentsev et al.(2000) |
| Poor groups | 7.6 E10 | 1.3 E12 | 17.02.9 | Guzik & Seljak (2002) |
| Fornax | 1.8 E12 | 5.9 E13 | 32 | Desai et al.(2003) |
| Virgo (1.6Mpc) | 8.8 E12 | 4.2 E14 | 486 | McLaughlin (1999) |
| 0024+1654 | 1.5 E13 | 6.1 E14 | 407 | Kneib et al.(2003) |
| MS0302+17 (8Mpc) | 8.9 E12 | 4.4 E14 | 505 | Gavazzi et al.(2004) |
| Abell clusters | 1.1 E13 | 5.2 E14 | 473 | Lin et al.(2003) |
| Coma (14Mpc) | 2.7 E13 | 1.4 E15 | 5417 | Rines et al.(2001) |
All data in Table 1 correspond to the Hubble constant km/s Mpc and the solar absolute magnitude = 3.39 mag (Kochanek et al., 2001).
It is not out of place to make some comments on values given in Table 1. First three lines represent the mean values of masses inside the standard radius for the LV galaxies, divided in three luminosity intervals. The mean ratios and their standard deviations are derived from data in Plot 6. Next three lines contains estimations of total masses for individual galaxies on larger scales. They were made using dispersions of radial velocities of planetary nebulas in elliptical galaxy NGC 5128 (on scale of 80 Kpc) or using value of X-ray flux from ellipticals NGC 4636 (in the Virgo cluster) and NGC 1399 (in the Fornax cluster). The K-values for these galaxies were obtained in the 2MASS.
Next seven lines contain data on masses and luminosities for the nearest groups around the giant galaxies: M31, M81, IC 342, Maffei 1, M83 and Cen A = NGC 5128 as well as for the Local Group. Population and dynamics of these groups were discussed by Karachentsev (2005). Presented masses of these group correspond to the mean of two estimates: one made using Virial theorem and other one basing on orbital motions of companions around their principal galaxies. The value of total mass of the Local Group as a whole was obtained from relation , where is the observed radius of ”the zero velocity sphere”, is the age of the Universe, and G is the gravitational constant. Another two groups of the LV were added to those listed above: Leo-I and NGC 6946. Their virial masses were estimated by Karachentsev & Karachentseva (2004) and Karachentsev et al. (2000), respectively, with additional data on radial velocities from Makarov et al. (2003).
Guzik & Seljak (2002) and Hoekstra et al. (2004) explored effects of weak gravitational lensing that produced by single galaxies of high luminosities seen in SDSS and RCS surveys. Such galaxies are usually inhabit centers of pure populated (loose) groups. Accordingly authors, lensing galaxies with the mean optical luminosity have characteristic masses ( on scales Kpc. Supposing the mean color for these field galaxies to be , we obtain the estimation of mass-to-K-luminosity ratio ( that is in good agreement with the data on nearby groups of galaxies mentioned above.
Last six lines in Table 1 refer to clusters and superclusters. According to Tonry et al. (2001) and Jerjen (2003) the distance to pure populated southern cluster in Fornax is 2 Mpc. A catalog of 2678 galaxies from that cluster was published by Ferguson (1989). With a velocity dispersion of the Fornax members being 400 km/s, the virial mass of that cluster is (Desai et al. 2004). The infrared luminosity of the Fornax cluster presented in Table 1 was obtained by us from the 2MASS survey data.
Analogous method was used to estimate the integrated K-luminosity for other nearest galaxy cluster in Virgo. With the Virgo cluster distance being equal D = 17 Mpc, we obtained (Virgo) for the virialised region of the cluster within 6 deg from the center. The virial mass of the cluster was obtained by McLanghlin (1999) from a velocity dispersion of galaxies and from an X-ray flux of virialized hot gas within cluster. The mass of the Vigro is within 1.6 Mpc radius. That gives . It is worth to say that according to a model of galaxy motions around the Virgo as an attractor, Tully & Shaya (1984) and Tonry et al. (2000) obtained mass of the cluster . However this estimate concerns larger cluster radius up to 8 Mpc, and the integrated K-luminosity of the volume is not determined so far.
Recently Kneib et al. (2003) and Gavazzi et al. (2004) used effects of gravitational lensing for mass determination of two rich clusters: 0024+1654 and MS0302+17. Their results are presentin Table 1. The authors measured K-luminosity for first cluster. Estimation of K-luminosity for second one was made using known luminosity in B-band in suggestion that cluster is inhabited by galaxies of early types with the mean color index = 4.0.
Two the last lines in Table present the mean mass and K-luminosity for 27 clusters that were studied by Lin et al. (2003) and also for the Coma supercluster (Rines et al. 2001). In last case ratio was measured using redshift survey of 1779 galaxies and their 2MASS photometry. Authors point that obtained mass-to-luminosity ratio remains nearly constant while move out from central virialized region 3.5 Mpc in radius to a scale 14 Mpc, that characterizes a region of bulk motion for surrounding galaxies toward Coma as an attractor.
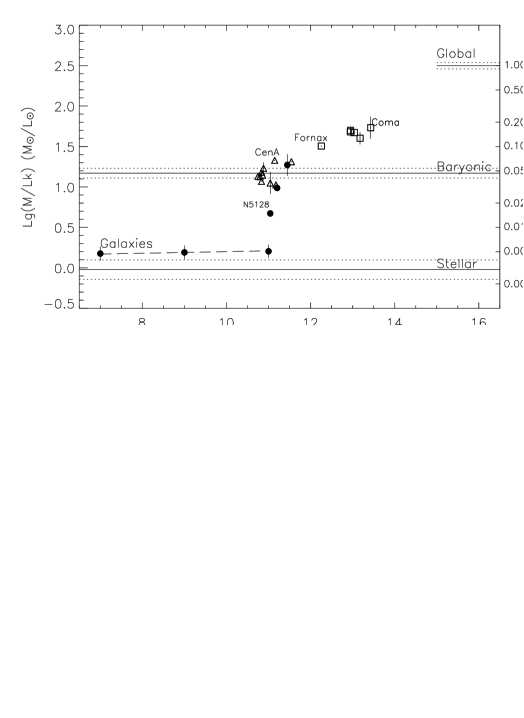
Data on masses and K-luminosities of galaxies and systems of galaxies summarized in Table 1 are presented in Figure 7. The estimates of M/L for individual galaxies, groups, and clusters/superclusters are shown as circles, triangles and squares, respectively. We can get the global value that characterizes fairish (on scales 100 Mpc) regions of the Universe calculating ratio of critical density ) (that equals Mpc-3 for km/s Mpc) to mean luminosity density in the K-band, .Using estimations of from Kochanek et al.(2001) and Bell et al. (2003) we obtain and , respectively. These values are shown as dashed lines in right upper corner of Figure 7. We accepted their mean for calibration of density scale in units of the critical density. The last is shown on the right side.
The mean stellar mass density, from Bell et al. (2003), is shown at the bottom of the Figure 7 as horizontal line. Other horizontal line corresponds to the mean baryonic mass density, or according to Spergel et al. (2003). Dashed line with a weak slope corresponds to a trend of the mean mass (inside standard radius) to luminosity ratio for the LV galaxies. Analysis of the data presented allows one to make some general conclusions:
1) The value of stellar mass density and gas density per unit luminosity is quite enough to explain the mean mass-to-luminosity ratio inside the standard radius both for giant, normal and dwarf galaxies. With all this going on, contribution of gaseous component, that can be expressed through relation , increases with decreasing galaxy’s luminosity, reaching values (1-3) for the smallest dwarf systems (compare Fig. 10 in Karachentsev et al., 2004)
2) Transition from visible regions of galaxies with sizes (1-30) Kpc to groups dominated by one galaxy (scales 50-300 Kpc) is accompanied by increasing of mass on near order of magnitude with almost constant luminosity. The mean ratio for groups of galaxies is actually coincide with the mean ratio for baryonic mass, .
3) Galaxy groups, clusters and superclusters follow a relation within luminosities interval from to . This relation has a typical dispersion 0.1 that is comparable with uncertainties in measuring of integral luminosities and masses. At the same time mutual differences in mass estimations based on virial motions, X-ray flux or lensing turn out to be inessential.
4) The largest and the most inhabited systems of galaxies — rich clusters/superclusters are characterized by values of mass-to-luminosity ratios being , that constitutes only 16% from the global value . Since only small part of galaxies (10-20% constitute to such supersystems, an ensemble averaged turns out to be certainly lower than that expected in the standard cosmological model (Spergel et al. 2003) with and . To adjust together the ensemble averaged value with the global value one needs to suppose that most part of dark matter in the Universe is not associated with galaxies or their systems (Karachentsev, 2005).
6 Concluding remark.
As can be seen from the results above, IR-luminosities of nearby galaxies play important role in exploring dynamics and evolution of galaxy systems. Realization of the all-sky survey in J, H, K-bands and creation of the XSC 2MASS catalog allow one to investigate different properties for big samples of galaxies in unified photometric system. Determination of IR characteristics for a sample of nearby galaxies, which is distance, but not flux-limited, is an important task. Parameters of such sample must be marginally affected by different selectional effects, which complicate interpretation of initial data from observations. Unfortunately, among 450 galaxies of the Local volume within D = 10 Mpc only a small part (27%) is seen in the 2MASS because of low luminosity, low surface brightness or blue color. That is why measuring J, H, K-magnitudes for all galaxies inside the LV for the purpose of formation of reference sample seems to be a very promising aim. This sample could be an etalon while comparing it with deeper samples on different redshifts.
Acknowledgements. This work was partially supported by RFBR grant 04-02-16115 and DFG-RFBR grant 02-02-04012.
References
Bahcall N.A., Cen R., Dave R. et al., 2000, Astrophys. J.,541, 1.
Bell E.F., McIntosh D.H., Katz N., Weinberg M.D., 2003, Astrophys. J. Suppl.,149, 289.
Cole S., Norberg P., Baugh C.M., et al., 2001, Monthly Not. Roy. Astron. Soc., 326, 255.
Cutri R.M., Skrutskie M.F., 1998, Bull. Am. Astron. Soc., 30, 1374.
Desai V., Dalcanton J.J., Mayer L., et al., 2004, Monthly Not. Roy. Astron. Soc., 351, 265.
Ferguson H.C., 1989, Astron. J., 98, 367.
Fukugita M., Ichikawa T., Gunn J., et al., 1996, Astron. J., 111, 1748.
Gavazzi R., Mellier Y., Fort B., et al., 2004, Astron. and Astrophys., 422, 407.
Guzik J., Seljak U., 2002, Monthly Not. Roy. Astron. Soc., 335, 311.
Hoekstra H., Yee H.K., Gladders M.D., 2004, Astrophys. J., 606, 67.
Jarrett T.H., 2000, Publ. Astr. Soc. Pacific, 112, 1008.
Jarrett T.H., Chester T., Cutri R., et al., 2000, Astron. J., 119, 2498.
Jarrett T.H., Chester T., Cutri R., et al., 2003, Astron. J. 125, 525.
Jerjen H., 2003, Astron. and Astrophys., 398, 63.
Jones C., Stern C., Forman W. et al., 1997, Astrophys. J., 482, 143.
Karachentsev I.D., 1966, Astrofizika, 2, 81
Karachentsev I.D., 2005, Astron. J., 129, N1 (accepted).
Karachentsev I.D., Karachentseva V.E., 2004, Astron. Zh., 81, 298.
Karachentsev I.D., Karachentseva V.E., Huchtmeier W.K., Makarov D.I., 2004, A Catalog of Neighboring Galaxies, Astron. J., 127, 2031
Karachentsev, I.D., Mitronova S.N., Karachentseva V.E., et al., 2002, Astron. and Astrophys., 396, 431.
Karachentsev I.D., Sharina M.E., Huchtmeier W.K., 2000, Astron. and Astrophys., 362, 544.
Kneib J.P., Hudelot P., Ellis R.S., et al., 2003, Astrophys. J., 598, 804.
Kochanek C.S., Pahre M.A., Falco E.E. et al., 2001, Astrophys. J., 560, 566.
Lin Y.T., Mohr J.J., Stanford S.A., 2003, Astrophys. J., 582, 574.
Loewenstein M., Mushotzky R., 2002, astro-ph/0208090.
Makarov D.I., Karachentsev I.D., Burenkov A.N., 2003, Astron. and Astrophys., 405, 951.
McLaughlin D.E., 1999, Astrophys. J., 512, L9.
Peng E.W., Ford H.C., Freeman K.C., 2004, Astrophys. J., 602, 685.
Persic M., Salucci P., 1992, Monthly Not. Roy. Astron. Soc., 258, 14.
Rines K., Geller M.J., Kurtz M.J., et al., 2001, Astrophys. J., 561, L41.
Schlegel, D.J., Finkbeiner, D.P., Davis, M., 1998, Astrophys. J., 500, 525.
Spergel D.N., et al., 2003, Astrophys. J. Suppl., 148, 175.
Tonry J.L., et al., 2000, Astrophys. J., 530, 625.
Tonry J.L., et al., 2001, Astropys. J., 546, 681.
Tully R.B., Shaya E.J., 1984, Astrophys. J., 281, 31.