FROM COBE TO WMAP: A DECADE OF DATA UNDER SCRUTINY
This talk, presented at the 5th Rencontres du Vietnam 2004, gives a review of the cosmological implications of the cosmic microwave background (CMB) data. The observational progress that has been made over the past decade is discussed and recent constraints on cosmological parameters are given. The concordance model is presented and the implications of the most recent data for cosmological inflation, reionisation and dark energy are described. Finally, the expectations for the next decade of CMB cosmology are summarised.
1 Introduction
On 24 April 1992, scientists announced that the Differential Microwave Radiometer instrument aboard the COsmic Background Explorer satellite (COBE-DMR) measured slight variations in the temperature of the cosmic microwave background (CMB) of one part in 105 on scales of about 10∘ . Since the original COBE-DMR detection, numerous ground based, balloon borne and satellite measurements of the temperature fluctuations have been made at many different locations on the sky. These CMB anisotropy measurements have brought us to an era of precision cosmology, enabling us to directly probe the thermal history of our universe.
There are a number of physical processes that produce anisotropies in the microwave sky on a range of scales. Primary fluctuations are imprinted on the CMB during decoupling or even before. For example, acoustic oscillations are generated before decoupling through the gravitational collapse of matter into the potential wells. Secondary perturbations are generated between decoupling and the present. These include the distortion of the blackbody spectrum as photons pass through regions of hot ionised gas. Refer to example reviews for more details of the physics of the CMB anisotropies .
The CMB harbours the imprint of the initial perturbations that seeded the gravitational collapse of structure. This signal has been filtered through the dynamical evolution of the expanding universe. The analysis of the CMB anisotropy data can therefore not only advance our understanding of the process of structure formation but also reveal fundamental properties of the universe such as its expansion rate, geometry and the amount of matter it contains. As the anisotropy detections become increasingly accurate, we can test the predictions of theoretical cosmology and extend our understanding of our evolving universe.
In this talk, presented at the 5th Rencontres du Vietnam 2004, we give an overview of the cosmological implications of the CMB data. We briefly discuss the observational progress that has been made over the past decade and comment on recent cosmological parameter constraints. We describe the current concordant model and explain how simultaneously analysing combinations of independent observational data sets can tighten cosmological constraints. We also discuss the implications of the current data for inflation, reionisation and dark energy and summarise what we can expect the next decade to hold for CMB cosmology.
2 The Observational Data
2.1 First Light
The potential for the CMB to become a potent probe of cosmology began with the discovery of the tiny variations in the temperature of the CMB by COBE-DMR in 1992. Over a period of 4 years, COBE-DMR took measurements of the full sky producing maps of the temperature fluctuations at 3 frequencies. The dipole contribution was removed and the galaxy was cut from the data to reveal a map of the CMB anisotropy signal. Variations on the spherical map occur on physical scales that can be expanded in spherical harmonics to get a power spectrum of temperature fluctuations (see Fig. 1). This is analogous to Fourier expanding a flat map.
COBE-DMR’s large beam size meant it was not able to probe small scales (large multipoles). However, because it made observations over the whole sky, it was able to probe the largest scales (smallest multipoles). These scales are larger than the physical horizon at the time of recombination, so perturbations on these scales have not been effected by interactions that occur during and after decoupling. These perturbations therefore correspond to the initial density fluctuations that have seeded structure formation.
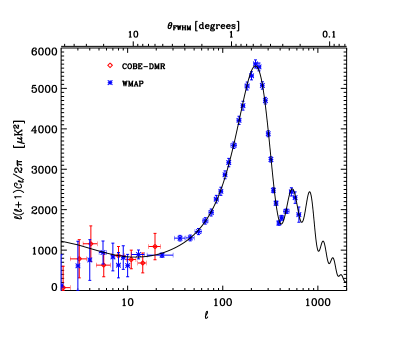
A CMB photon that was last scattered from an over dense region will have to overcome the gravitational attraction of that region in order to make its way towards us. As it does so, its wavelength is stretched, so over dense regions correspond to cold spots on the CMB map. Similarly, the wavelength of a photon originating from an under dense will be compressed as it makes its way towards us, so hot spots correspond to under-densities. This physics was first described in a 1967 paper by Sachs and Wolfe . The region probed by COBE-DMR is therefore known as the Sachs-Wolfe Plateau.
2.2 Unprecedented Precision
The most recent CMB data set to hit the headlines is WMAP, the Wilkinson Microwave Anisotropy Probe . Scheduled to observe for 4 years, the first year results were announced in February 2003. Like COBE-DMR, WMAP is a differential experiment, measuring the temperature difference between two points in the sky rather than measuring absolute temperatures. The team combined information from 5 frequency channels and filtered out the signal from our galaxy in order to get a full sky map. You can see far more intricate detail when comparing this map to the one from COBE-DMR.
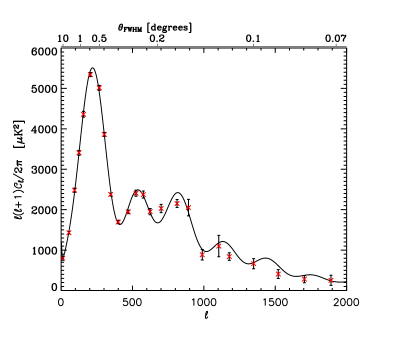
The WMAP observations have 45 times the sensitivity and 33 times the angular resolution of the COBE-DMR mission. Again, as it’s a full sky map so probes the largest scales, the Sachs-Wolfe Plateau, but due to its small beam size ( FWHM), it is also able to probe smaller scales and the intricate physics that occurs during recombination and at later times. Fig. 2 shows the angular power spectrum of temperature fluctuations from WMAP in its first year of operation. The first year data sweeps over the first 2 peaks with unprecedented accuracy. These peaks correspond to acoustic oscillations generated during recombination.
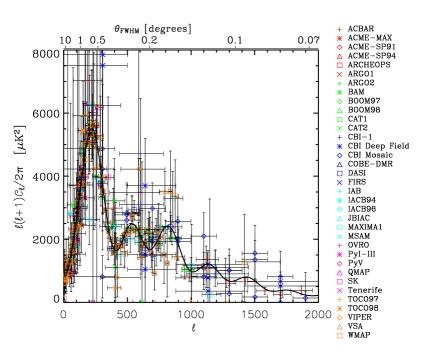
From COBE-DMR’s first measurement of the CMB anisotropy to WMAP’s most recent observations there have been hundreds of detections made over a range of scales by over 2 dozen autonomous and semi-autonomous groups. Fig. 2 shows the current compilation of CMB data. This data can be used to gain information about our universe such as its matter content, its age and its geometry. It is difficult to visualise the fit of the cosmological model with so much scatter, so it is useful to bin the data (see Fig. 3). The model plotted in Figs. 2 and 3 is the concordant cosmological model.
2.3 The Concordant Cosmological Model
Although the CMB has the potential to simultaneously constrain a number of cosmological parameters that are the ingredients of the hot big bang model, particular parameter combinations can produce the same spectra. These model degeneracies limit our ability to extract parameters from the CMB alone. Combining information from a range of independent observational data sets enables certain degeneracies of the individual data sets to be resolved.
| Wang et al. (2002) | Spergel et al. (2003) | Tegmark et al. (2004) | |||
|---|---|---|---|---|---|
| CMB | +2dFGRS | CMB(TT+TE) | +2dFGRS+Ly | CMB(TT+TE)+SDSS | |
| 0.023.003 | 0.024.003 | ||||
| 0.112.014 | 0.115.013 | ||||
| 0.99.06 | 0.99.04 | ||||
| 0.71.13 | 0.73.11 | ||||
We are now beginning to refine an observationally concordant model; a model that is concordant to a number of data sets. Table 1 gives the results of a few of the most recent analyses. The per degree of freedom for the fit of the concordant model (, , , , , ) to the full CMB anisotropy data set is with a 72% probabilty of finding a model that better fits the data , indicating that the model provides a good fit to the anisotropy data alone.
3 Implications for Inflation
A key component of modern cosmologies is the assumption that the initial irregularities are generated by a period of inflation during the very early universe. The simplest inflationary models predict an approximately spatially flat universe, an approximately scale-invariant spectrum of Gaussian, adiabatic primordial density perturbations and an approximately scale-invariant spectrum of gravitational waves with an amplitude that is a direct measure of Hubble rate during inflation.
3.1 Spatial Flatness
Flatness is probed through the positions of the acoustic peaks. Before decoupling, the collapse of irregularities under gravity generates a radiation pressure gradient. This pressure gradient opposes the gravitational collapse, causing the primordial plasma to acoustically oscillate. The phase of the acoustic oscillation is imprinted on the photons as they last scatter producing the acoustic peaks in the angular power spectrum . Odd peaks represent phases when the fluid in the potential wells is under compression and even peaks rarefaction phases.
The phase of the oscillation, and thus the positions of the acoustic peaks, depends on the maximum distance a sound wave could have travelled since the Big Bang - the sound horizon. The curvature of the universe affects the angle subtended today by the sound horizon at recombination. If the subsequent journey of the CMB photons was not distorted by large-scale cosmic curvature, . The position of the first peak tells us that the largest CMB hot spots subtend an angle of about on the sky. In fact, the locations of the CMB acoustic peaks alone imply that the universe is approximately spatially flat and there is no improvement on this prediction with the introduction of other data.
3.2 Adiabatic Initial Conditions
The two general classes of perturbations, adiabatic and isocurvature, drive acoustic oscillations that are out of phase from each other. Adiabatic perturbations produce cosine harmonics and isocurvature sine. They can therefore be distinguished by taking the ratios of the locations of the acoustic peaks .
Analyses have shown that adiabatic models provide a good fit to the CMB data . Although there is no evidence for isocurvature in the CMB, constraints are weak if correlated modes are allowed . However, several cosmological parameters for isocurvature models most favoured by the CMB conflict with other probes, e.g. the baryonic density is much higher than that inferred by light element abundances .
3.3 Gaussian Perturbations
Measurements of the amplitude of non-Gaussian primordial fluctuations are parameterised by a nonlinear coupling parameter, . The simplest inflationary models predict . The WMAP team tested their data for non-Gaussianity in two ways . Firstly, constraints on using the bispectrum gave at 68% confidence. They also measured the morphology of the maps using Minkowski Functionals, establishing the limit at 68% confidence.
The findings of the WMAP team reveal no evidence of primordial non-Gaussianity, allowing them to conclude that their data is consistent with Gaussian primordial perturbations. However, a number of investigations have shown the WMAP data to harbour statistically significant departures from rotational invariance -. Whether these effects are primordial or systematic due to instrument effects or imperfect foreground subtraction is yet unclear.
3.4 Scale-Invariance
Assuming a flat CDM model with a power-law spectrum of primordial scalar perturbations, the CMB alone implies a close to scale-invariant spectrum in accordance with inflationary predictions . Slow roll inflation predicts a small departure from a power-law spectrum, with a 2nd order running scalar index: . The WMAP team reported weak evidence of running index by including small-scale data from the 2-degree Field Galaxy Redshift Survey and Ly forest observations . Their analysis implies a much larger running than the slow roll prediction, although modelling uncertainties in Ly forest data questions the reliability of this result .
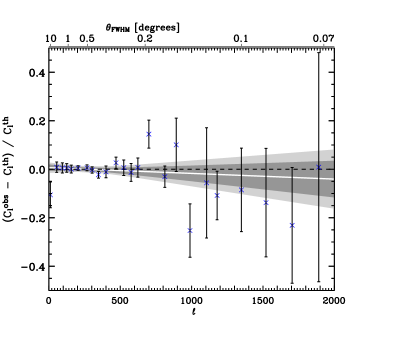
The inclusion of the latest small-scale data such as VSA and CBI reveals a preference for slightly redder power-law spectra, e.g. combining VSA and WMAP . Furthermore, analyses that include this interferometric data indicate a running in flat CDM models at the 2 level. This reflects the fact that the data on the largest scales () is anomalously low when tied to the latest small scale data (see Fig. 4 ). The evidence for a running index is weakened considerably with inclusion of external priors from large-scale structure data . Future data on both large and small scales will further test departures from a scale-invariant primordial spectrum of scalar perturbations.
The generation of a nearly scale-invariant background of gravitational waves is yet to be verified. Current CMB limits on the tensor-to-scalar ratio are weak, e.g. at 95% confidence . However, interesting constraints in the plane for specific inflationary models are already being made . The ultimate goal of future CMB observations is to detect the B-mode polarisation signal that is predicted to be generated by tensor mode perturbations from gravitational waves. Such detections would give a direct measurement of the energy scale and place tight constraints on the dynamics of inflation.
4 Probing Reionisation and Dark Energy with the CMB
4.1 Polarisation
Polarisation is generated by the final Thomson scattering of the photons and therefore probes the redshift dependence of the optical depth. Last scattering is expected to be concentrated in two distinct redshift bands: (recombination) and below (reionisation). In typical cosmological models the fraction of photons that rescattered at low redshift ranges from a few percent to tens of percent.
Detection of the CMB polarisation signal was first announced by the DASI team in 2002 . Assuming the concordant CDM model, they constrain both E- and B-mode spectra. Their analysis reveals a 5 detection of non-zero E-mode polarisation with an amplitude consistent with the expected central value (see Fig. 5). They report a T-E cross-correlation signal at 95% significance but find no evidence for B-mode polarisation.
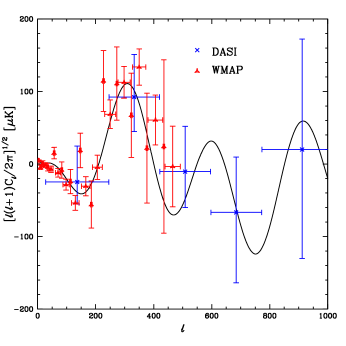
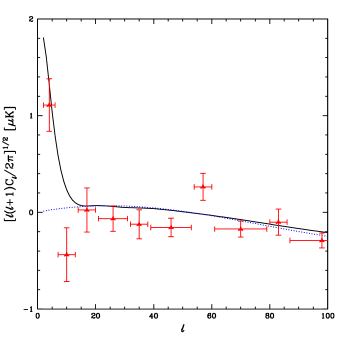
The first year data release from the WMAP team includes detections of the T-E cross correlation spectrum (see Fig. 5). In accordance with the inflationary prediction, the WMAP measurements on angular scales of about 1/2 a degree () provide evidence for super horizon size adiabatic fluctuations existing on the surface of last scattering at recombination. They also find a significant excess power on large scales () over the prediction assuming polarisation is only generated at recombination (see Fig. 6). Such an excess is consistent with an early epoch of reionisation (, ) which is hard to reconcile with the significantly later epoch expected from quasar absorption spectra observations. This implies a complex reionisation history.
4.2 Correlations with Gravity Tracers
When the universe becomes dominated by dark energy the gravitational potential decays, shifting the frequencies of photons passing though it. This local phenomenon generates the late-time integrated Sachs-Wolfe effect that contributes to CMB power at the lowest multipoles. CDM models should therefore produce large-angle CMB anisotropies that are positively correlated with matter fluctuations at , providing an independent check for dark energy .
The WMAP team cross-correlated their data with the NVSS radio source catalogue and found with 95% confidence and rejected at the 3 level. Boughn and Crittenden cross-correlated WMAP with data from the hard X-ray background, which is dominated by active galaxy emission, and the NVSS survey. They report positive correlations at 3 and 2.5 respectively. Several groups have also detected the cross-correlation on large scales between WMAP and optical galaxy surveys .
5 Summary
Precision cosmology has arrived. We are now able to probe the ingredients of the hot big bang model with unprecedented accuracy. Current ideas in cosmology appear to be vindicated. It seems we live in a dark energy dominated universe in which more than 80% of the matter content is in the form of exotic cold dark matter. The CMB data implies an almost spatially flat universe that evolved from an approximately scale-invariant spectrum of Gaussian, adiabatic primordial density perturbations. This is to be expected if quantum fluctuations created in the very early universe were stretched to astronomical scales during an epoch of accelerated expansion known as cosmological inflation.
As we enter a new decade of CMB Observations, it is hoped that the issues raised by the WMAP first-year data such as the possible violation of rotational invariance and the implication of an early epoch of reionisation are tested. Efforts continue to map the full CMB sky to increasing sensitivity. The second-year data release of WMAP is expected imminently and the Planck Satellite, due for launch in 2007, intends to provide a full sky map of unprecedented accuracy and a cosmic-variance limited measurement of the power spectrum up to .
We can also expect more data at high to high sensitivity. New ground based experiments such as ACT, APEX and SPT are in progress. Such small scale observations should provide further tests for departures from a power-law primordial spectrum and begin to explore secondary anisotropies such as the Sunyaev-Zeldovich and Ostriker-Vishniac effects.
Efforts to constrain polarisation continue. BICEP, CAPMAP, Polarbear, QUAD and SPORT are applying new techniques to produce accurate measurements of E-mode polarisation and its temperature anisotropy correlations and there is already talk of a post-Planck satellite, CMBPOL, dedicated to CMB polarisation measurements. The ultimate goal remains to detect B-mode signal generated by tensor mode perturbations from gravitational waves. Such detections would give a direct measurement of the energy scale of inflation and place tight constraints on the dynamics of inflation.
We can expect the CMB to continue to probe fundamental physics and cosmology for years to come. So far it has provided a very good determination of cosmological parameters but that isn’t the same as understanding why. Why dark energy and dark matter? Why inflation? Why early reionisation? Now that the cosmological uncertainties have been removed, the focus should turn to understanding the physics.
Acknowledgments
It is a pleasure to thank Andrew Liddle and Charley Lineweaver for interesting discussions and useful comments. The author acknowledges financial support from the Australian Research Council.
References
References
- [1] G.F. Smoot et al., Astrophys. J. 396, L1 (1992).
- [2] W. Hu, N. Sugiyama, J. Silk, Nature 386, 37 (1997).
- [3] A. Challinor, Proceedings of the 2nd Aegean Summer School on the Early Universe, 22-30 September 2003, Springer LNP, astro-ph/0403344 (2004).
- [4] R.K. Sachs and A.M. Wolfe, Astrophys. J. 147, 73 (1967).
- [5] G. Hinshaw et.al., Astrophys. J. Supp. 148, 135 (2003).
- [6] X. Wang, M. Tegmark and M. Zaldarriaga, Phys. Rev. D 651, 123001 (2002).
- [7] D.N. Spergel et al, Astrophys. J. Supp. 148, 175 (2003).
- [8] M. Tegmark et al, Phys. Rev. D 69, 103501 (2004).
- [9] L.M. Griffiths and C.H. Lineweaver, Astrophys. J. 603, 371 (2004).
- [10] W. Hu, “Wandering in the Background: a Cosmic Microwave Background Explorer”, Ph.D. thesis, U. C. Berkeley (1995).
- [11] W. Hu, M. White, Astrophys. J. 471, 30 (1996).
- [12] M. Bucher, J. Dunkley, P.G. Ferreira, K. Moodley and C. Skordis, Phys. Rev. Lett. 93, 081301 (2004).
- [13] E. Komatsu et al, Astrophys. J. Supp. 148, 119 (2003).
- [14] A. de Oliveira-Costa, M. Tegmark, M. Zaldarriaga and A. Hamilton, Phys. Rev. D 69, 3516 (2004).
- [15] P. Vielva, E. Martínez-González, R.B. Barreiro, J.L. Sanz and L. Cayón, Astrophys. J. 609, 22 (2004).
- [16] C.J. Copi, D. Huterer and G.D. Starkman, Phys. Rev. D 70, 3515 (2004).
- [17] H.K. Eriksen, D.I. Novikov, P.B. Lilje, A.J. Banday and K.M. Gorski, Astrophys. J. 612, 64 (2004).
- [18] F.K. Hansen, P. Cabella, D. Marinucci and N. Vittorio, Astrophys. J. 607, L67 (2004).
- [19] P. Mukherjee and Y. Wang, preprint astro-ph/0402602 (2004).
- [20] R. Rebolo et al, Mon. Not. R. Astron. Soc. 353, 747 (2004).
- [21] U. Seljak, P. McDonald and A. Makarov, Mon. Not. R. Astron. Soc. 342, L79 (2003).
- [22] S.M. Leach and A.R. Liddle, Mon. Not. R. Astron. Soc. 341, 1151 (2003).
- [23] J.M. Kovac, E.M. Leitch, C. Pryke, J.E. Carlstrom, N.W. Halverson and W.L. Holzapfel, Nature 420, 772 (2002).
- [24] R.G. Crittenden and N. Turok, Phys. Rev. Lett. 76, 575 (1996).
- [25] M.R. Nolta et al, Astrophys. J. 608, 10 (2004).
- [26] S. Boughn and R. Crittenden, Nature 427, 45 (2004).
- [27] P. Fosalba, E. Gaztañaga and F.J. Castander, Astrophys. J. 597, L89 (2003).
- [28] P. Fosalba and E. Gaztañaga, Mon. Not. R. Astron. Soc. 350, L37 (2004).