A first XMM-Newton look at the most X-ray-luminous galaxy cluster
RX J1347.51145
Abstract
We present the first results from an XMM-Newton observation of RX J1347.51145 (z=0.451), the most luminous X-ray cluster of galaxies currently known, with a luminosity in the [2-10] keV energy band. The cluster has an overall temperature of keV and is not isothermal: the temperature profile shows a decline in the outer regions and a drop in the centre, indicating the presence of a cooling core. The spectral analysis identifies a hot region at radii 50-200 kpc to south-east of the main X-ray peak, at a position consistent with the subclump seen in the X-ray image. Excluding the data of the south-east quadrant, the cluster appears relatively relaxed and we estimate a total mass within 1 Mpc of .
keywords:
Galaxies:clusters:particular:RX J1347.51145 ; X–ray:galaxies:clusters1 Introduction
The cluster RX J1347.51145 detected in the ROSAT All-Sky Survey and further studied with ROSAT HRI and ASCA (Schindler et al. 1995, 1997) is exceptional in many aspects. It is the most X-ray-luminous galaxy cluster known (Schindler et al. 1995), it shows a very peaked X-ray emission profile and presents a strong cooling flow in its central region. Submm observations in its direction showed a very deep SZ decrement (Komatsu et al. 1999, 2001; Pointecouteau et al. 1999, 2001). Due to the presence of gravitational arcs, this cluster is also well suited for a comparison of lensing mass and X-ray mass. Optical studies of weak lensing have been performed by Fischer & Tyson (1997) and Sahu et al. (1998). Recent Chandra observations (Allen et al. 2002) discovered a region of relatively hot, bright X-ray emission, located approximately 20 arcsec to the south-east of the main X-ray peak at a position consistent with the region of enhanced SZ effect.
We present the first results from an XMM-Newton observation of RX J1347.51145, which was performed in July 2002 during rev. 484. Standard processing is applied to prepare data and reject the soft proton flares. The exposure times after cleaning are 32.2 ks for MOS1, 32.5 ks for MOS2 and 27.9 ks for pn. The background estimates are obtained using a blank-sky observation consisting of several high-latitude pointings with sources removed (Lumb et al. 2002). The background subtraction (for spectra and surface brightness profiles) is performed as described in full detail in Arnaud et al. (2002). The source and background events are corrected for vignetting using the weighted method described in Arnaud et al. (2001). RX J1347.51145 is at a redshift . With a Hubble constant of , and , the luminosity distance is 2506 Mpc and the angular scale is 5.77 kpc per arcsec.
2 Spectral analysis
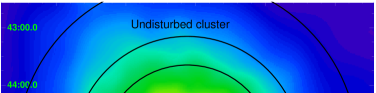
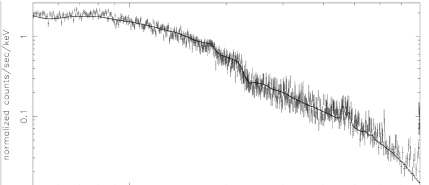
Since a morphological analysis indicates the presence of a substructure 20 arcsec to the south-east (SE) of the X-ray peak (already revealed in previous observations with Chandra, Allen et al. 2002), we perform the spectral analysis for the data excluding the SE quadrant (hereafter undisturbed cluster) and for the full data, separately. In both cases, the data are divided into the annular regions shown in Fig. 1 and detailed in Table 1. A single spectrum is extracted for each region and then the data from the three cameras are modelled simultaneously using the XSPEC code, version 11.3.0. Spectral fitting is performed in the [0.5-8] keV band. The spectra are modelled using a simple, single-temperature model (MEKAL plasma emission code in XSPEC) with the absorbing column density fixed to the Galactic value (, Dickey & Lockman 1990). The free parameters in this model are the temperature , metallicity (measured relative to the solar values) and normalization (emission measure). A typical simultaneous fit to the spectra extracted in each region is shown in Fig. 2.
![[Uncaptioned image]](/html/astro-ph/0412207/assets/x2.png)
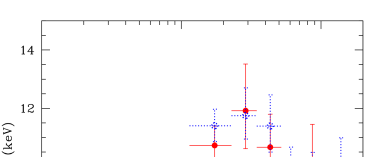
The best-fitting parameter values and 90% confidence levels derived from the fits to the annular spectra are summarized in Table 1. The projected temperature profiles determined with this model from the data excluding the SE quadrant and for the full data are shown in Fig. 3. The temperature of the undisturbed cluster rises from a mean value of keV within 115 kpc to keV over the 0.1-0.5 Mpc region, then declines down to a mean value of keV in the outer regions (1.0-1.7 Mpc). As a general trend, we note that the temperature of the undisturbed cluster is lower than that estimated from the full data, even though consistent within the errors. The derived temperature profile indicates the existence of a cool core: even though the gas temperature in the central 100 kpc is hotter than that usually found in cooling core clusters, there is probably a much cooler gas in the very center, which cannot be resolved due to the relatively high cluster redshift.
| SE sector excluded | full | |||||
|---|---|---|---|---|---|---|
| Radius (kpc) | /DOF | /DOF | ||||
| 0-115 | 982/880 | 1183/1026 | ||||
| 115-230 | 696/664 | 970/855 | ||||
| 230-345 | 433/384 | 610/564 | ||||
| 345-520 | 350/341 | 471/493 | ||||
| 520-690 | 239/210 | 372/300 | ||||
| 690-1040 | 293/264 | 436/346 | ||||
| 1040-1730 | 593/421 | 977/542 | ||||
| 0-1730 | 1957/1452 | 2586/1679 | ||||
The metallicity profile is consistent with being constant, with an overall value of . Within the radius of 1.7 Mpc, a fit to the full 360∘ data gives an overall keV, and .
In order to study in more detail the thermal structure of the cluster, we extract the spectrum in the annular region including the substructure identified by the morphological analysis and compare the results in different directions. A fit to the data for the SE quadrant between radii 50-200 kpc yields a best-fitting temperature keV, while in other directions the mean value is keV. Therefore, the spectral analysis confirms that the region corresponding to the subclump seen in the X-ray image is significantly hotter than the surrounding gas.
3 Spatial analysis and mass determination
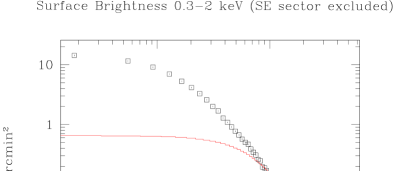
We compute a background-subtracted vignetting-corrected radial surface brightness profile for the undisturbed cluster in the [0.3-2] keV energy band. The surface brightness profile is then fitted with a -model (Cavaliere & Fusco Femiano 1976). We find that for 350 kpc - 1.7 Mpc the data can be described by a -model with a core radius kpc and a slope parameter . However, a single -model is not a good description of the entire profile, as the fit to the outer regions shows a strong excess in the centre when compared to the model (see Fig. 4). The peaked emission is a strong indication for a cooling core in this cluster.
The total gravitating mass distribution is calculated under the usual assumptions of hydrostatic equilibrium and spherical symmetry using the deprojected density distribution calculated from the parameters of the -model. Only data beyond ( kpc) are considered: in the central bins the temperature as estimated in Sect. 2 is affected by the XMM PSF and projection effects, while for the outer regions these effects can be neglected (e.g. Kaastra et al. 2004). Within 1 Mpc we find a total mass of , while within 1.7 Mpc the total mass is . These results are in agreement with Chandra (Allen et al. 2002) and weak lensing analysis (Fischer & Tyson 1997) results and slightly higher than that derived by ROSAT/ASCA (Schindler et al. 1997).
4 Conclusions
The XMM-Newton observation of RX J1347.51145 confirms that it is, with a luminosity (2-10 keV energy band), the most X-ray-luminous cluster discovered to date. RX J1347.51145 is a hot cluster (overall temperature: keV), not isothermal: the temperature profile shows the presence of a cool core and a decline of the temperature in the outer regions. The spectral analysis identifies a relatively hot region at radii 50-200 kpc to the SE of the main X-ray peak. This hot region is found at the same position as the subclump seen in the X-ray image. On the other hand, excluding the data of the SE quadrant the cluster appears relatively relaxed and we estimate a total mass within 1 Mpc of .
Acknowledgements
This work is based on observations obtained with XMM-Newton, an ESA science mission with instruments and contributions directly funded by ESA Member States and the USA (NASA). M.G. would like to thank E. Belsole, A. Castillo-Morales, S. Majerowicz and E. Pointecouteau for suggestions concerning XMM-Newton data analysis, and S.Ettori for his advices in the spectral analysis. This work was supported by the Austrian Science Foundation FWF under grant P15868, ÖAD Amadée Projekt 18/2003 and ÖAD Acciones Integradas Projekt 22/2003.
References
- (1) Allen S.W., Schmidt R.W., & Fabian A.C. 2002, Chandra observations of RX J1347.5-1145: the distribution of mass in the most X-ray-luminous galaxy cluster known, MNRAS, 335, pp. 256-266
- (2) Arnaud M., Neumann D.M., Aghanim N. et al. 2001, Measuring cluster temperature profiles with XMM/EPIC A&A, 365, pp. L80-L86
- (3) Arnaud M., Majerowicz S., Lumb D. et al. 2002, XMM-Newton observation of the distant (z=0.6) galaxy cluster RX J1120.1+4318, A&A, 390, pp. 27-38
- (4) Cavaliere A., & Fusco-Femiano R. 1976, X-rays from hot plasma in clusters of galaxies, A&A, 49, pp. 137-144
- (5) Dickey J.M., & Lockman F.J. 1990, H I in the Galaxy, ARA&A, 28, pp. 215-261
- (6) Fischer P., & Tyson J.A. 1997, The Mass Distribution of the Most Luminous X-Ray Cluster RXJ 1347.5-1145 From Gravitational Lensing, AJ, 114, pp. 14-25
- (7) Kaastra J.S., Tamura T., Peterson J.R. et al. 2004, Spatially resolved X-ray spectroscopy of cooling clusters of galaxies, A&A, 413, pp. 415-439
- (8) Komatsu E., Kitayama T., Suto Y. et al. 1999, Submillimeter Detection of the Sunyaev-Zeldovich Effect toward the Most Luminous X-Ray Cluster at Z = 0.45, ApJ, 516, pp. L1-L4
- (9) Komatsu E., Matsuo H., Kitayama T. et al. 2001, Substructures Revealed by the Sunyaev-Zel’dovich Effect at 150 GHz in a High-Resolution Map of RX J1347-1145, PASJ, 53, pp. 57-62
- (10) Lumb D.H., Warwick R.S., Page M. et al. 2002, X-ray background measurements with XMM-Newton EPIC, A&A, 389, pp. 93-105
- (11) Pointecouteau E., Giard M., Benoit A. et al. 1999, A Sunyaev-Zeldovich Map of the Massive Core in the Luminous X-Ray Cluster RX J1347-1145, ApJ, 519, pp. L115-L118
- (12) Pointecouteau E., Giard M., Benoit A. et al. 2001, Extended Sunyaev-Zeldovich Map of the Most Luminous X-Ray Cluster, RX J1347-1145, ApJ, 552, pp. 42-48
- (13) Sahu, K.C., Shaw R.A., Kaiser M.E. et al. 1998, Imaging and Spectroscopy of Arcs around the Most Luminous X-Ray Cluster RX J1347.5-1145, ApJ, 492, pp. L125-L131
- (14) Schindler S., Guzzo L., Ebeling H. et al. 1995, Discovery of an arc system in the brightest ROSAT cluster of galaxies, A&A, 299, pp. L9-L12
- (15) Schindler S., Hattori M., Neumann D.M., & Böhringer H. 1997, ROSAT/HRI and ASCA observations of the most luminous X-ray cluster RX J1347.5-1145, A&A 317, pp. 646-655