The Surprisingly Steep Mass Profile of Abell 1689, from a Lensing Analysis of Subaru Images1
Abstract
Subaru observations of A1689 are used to derive an accurate, model-independent mass profile for the entire cluster, , by combining magnification bias and distortion measurements. The projected mass profile steepens quickly with increasing radius, falling away to zero at , well short of the anticipated virial radius. Our profile accurately matches onto the inner profile, , derived from deep HST/ACS images. The combined ACS and Subaru information is well fitted by an NFW profile with virial mass, , and surprisingly high concentration, , significantly larger than theoretically expected (), corresponding to a relatively steep overall profile. A slightly better fit is achieved with a steep power-law model, , with a core (), whereas an isothermal profile is strongly rejected. These results are based on a reliable sample of background galaxies selected to be redder than the cluster E/S0 sequence. By including the faint blue galaxy population a much smaller distortion signal is found, demonstrating that blue cluster members significantly dilute the true signal for . This contamination is likely to affect most weak lensing results to date.
Subject headings:
cosmology: observations – gravitational lensing – galaxies: clusters: individual(Abell 1689)1. Introduction
Numerical simulations based on the cold dark matter (CDM) scenario are reliable enough to make statistical predictions for the mass profiles of clusters. The gradient of an ‘NFW’ profile is predicted to monotonically steepen with increasing radius (Navarro, Frenk & White 1997), with logarithmic slopes shallower than an isothermal profile interior to the characteristic radius , but steeper at larger radius, approaching to at . This curvature is particularly pronounced for massive clusters, where the halo is expected to have a relatively low concentration, providing a clear prediction. Weak lensing work has yet to make a definitive statement regarding the validity of the NFW profile, with the analysis claiming only broad consistency with both the singular isothermal case and the NFW model (Clowe & Schneider 2001; Bardeau et al. 2004). Recently, Kneib et al. (2003) made a more comprehensive lensing study using the panoramic sparse-sampled HST/WFPC2 data of Cl0024, showing that at large radius, the mass profile is steeper than the isothermal case, consistent with an NFW profile for . A firmer constraint is possible with magnification information, breaking the mass-sheet degeneracy inherent to distortion measurements (Broadhurst, Taylor & Peacock 1995, hereafter BTP). Detections of a number-count depletion have been claimed for several clusters (Fort et al. 1997; Taylor et al. 1998; Athreya et al. 2002; Dye et al. 2002).
Recently, the central region of A1689 () has been imaged in detail with the Advanced Camera for Surveys (ACS), revealing 106 multiply lensed images of 30 background galaxies (Broadhurst et al. 2004, B04). Many radially directed images define a radial critical curve, inside which small counter-images are identified, so the mass profile can be traced in detail to the center of mass. An NFW profile fits well over the restricted ACS field, , but with a somewhat larger concentration, , than expected for massive clusters, (e.g., Bullock et al. 2001). To examine the shape of the full profile, we turn to the wide-field prime focus camera, Suprime-Cam, of the m Subaru telescope. Suprime-Cam provides an unparalleled combination of area () and depth (Miyazaki et al. 2002). We measure the lensing distortion and magnification of background red galaxies and combine them to derive a model-independent mass profile out to , allowing a definitive comparison with model profiles. Throughout this Letter, the concordance CDM cosmology is adopted (, , ). Note that one arcminute corresponds to the physical scale kpc for this cluster.
2. Data reduction and Sample selection
Suprime-Cam imaging data of A1689 in (1,920s) and SDSS (2,640s) were retrieved from the Subaru archive, SMOKA. Reduction software developed by Yagi et al (2002) was used for flat-fielding, instrumental distortion correction, differential refraction, PSF matching, sky subtraction and stacking. The resulting FWHM is in and in with pix-1, covering a field of .
Photometry is based on a combined image using SExtractor (Bertin & Arnaut 1996). The limiting magnitudes are and for a detection within a ″aperture (we use the AB magnitude system). For the number counts to measure magnification, we define a sample of 8,907 galaxies ( arcmin-2) with . For distortion measurement, we define a sample of 5,729 galaxies ( arcmin-2) with colors mag redder than the color-magnitude sequence of cluster E/S0 galaxies, . The smaller sample is due to the fact that distortion analysis requires galaxies used are well resolved to make reliable shape measurement. We adopt a limit of to avoid incompleteness effect. Our red galaxies are very reasonably expected to lie behind the cluster, made redder by larger k-corrections. The counts of all galaxies including the dominant faint blue population is much larger, arcmin-2. However, as we show below, the distortion signal of the full sample is significantly diluted within , compared to the red sample, indicating that blue cluster members contaminate the sample. The mean redshift of the red galaxies is estimated to be , based on deep photo-z estimation for deep field data (Benitez et al. 2002). In the following we will assume for the mean redshift, but note that the low redshift of A1689 means that for lensing work, a precise knowledge of this redshift is not critical.
3. Lensing Distortions
We use the IMCAT package developed by N. Kaiser for our distortion analysis, following the well tested formalism outlined in Kaiser, Squires & Broadhurst (1995), with modifications described by Erben et al.(2001).
Briefly, to estimate the lensing distortion from the observed ellipticities of galaxy images, we first correct for PSF anisotropy using the available stars. The mean stellar ellipticity before correction is over the survey field, and is reduced by the correction to only and . We also correct for the isotropic smearing effect caused by seeing as well as by the window function used in the shape estimate. Full details will be presented in Umetsu et al. (2004, in preparation) including the 2D maps.
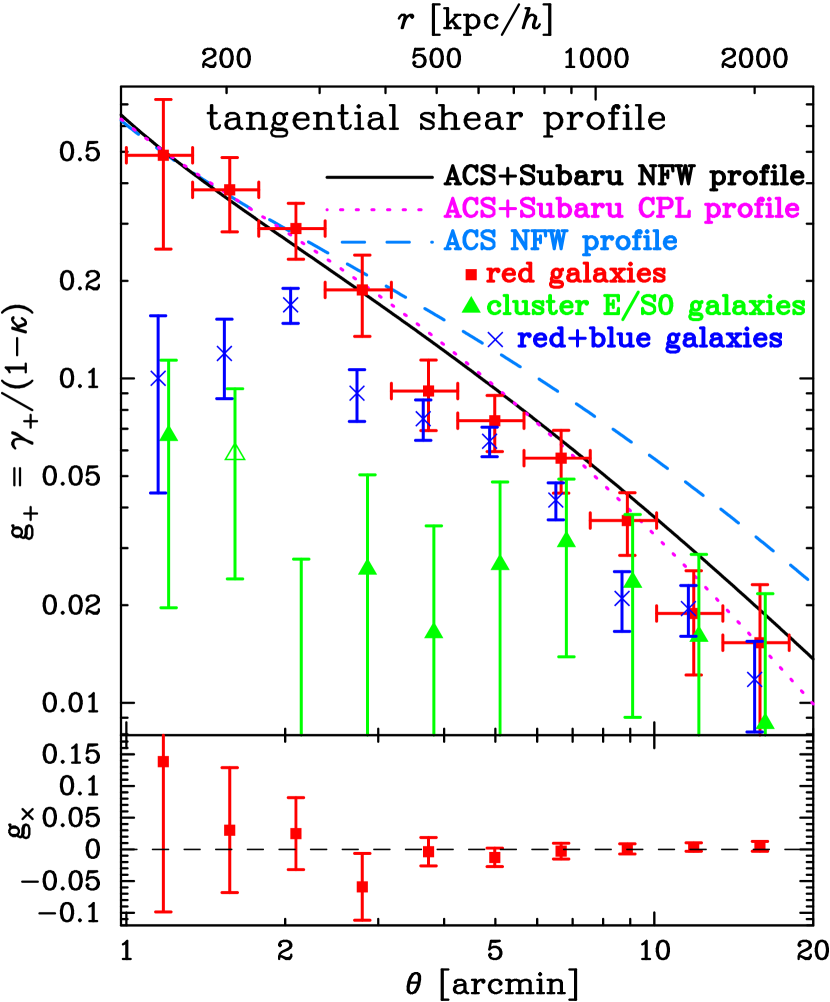
Figure 1 shows the radial profiles of the tangential distortion, , and the 45-degree rotated () component, , for the different samples of galaxies, where the cluster center is well determined by the locations of brightest cluster galaxies and/or giant arcs. Note that lensing induces only the tangential shear in the weak lensing regime. The error bars are 68% confidence intervals computed from the bootstrap resampled data. It is clear that the observed signal is significant to the limit of our data, or Mpc, and that the -component of the red galaxy sample is consistent with a null signal at all radii, indicating the reliability of our distortion analysis.
One can see that the NFW prediction for source redshift ( and ), which fits best the ACS strong lensing data restricted to the central region (B04), matches onto the Subaru distortions at for the background red galaxies, but increasingly overestimates the distortions at larger radii . A steeper NFW profile with (solid curve) better reproduces the distortion profile at all radii, as does a cored power-law profile (dotted curve), (see §5 for the details).
A careful background selection is critical. If we select all galaxies irrespective of color with magnitude limit , and exclude only the cluster sequence galaxies, then we find that the distortion signal falls below the red background sample by a factor of 2-5 at . While the slight dilution within a factor of 2 is still apparent at large radii , blue cluster members must be significantly contaminating the full sample at the small radii, reducing the distortion signal. This full sample selection is very similar to Bardeau et al. (2004) and Clowe & Schneider (2001), and we find close agreement. Hence it is apparent that these analyses underestimate the true distortion signal and explains why they underpredicted the Einstein radius, ″, compared with the much larger observed radius of (for ), a puzzle noted by Clowe & Schneider (2001).
It is also instructive to examine the tangential distortions of galaxies whose photometry places them in the limits bounding the cluster sequence. A null signal is found for as expected, where the cluster member is prominent above the background. But a positive distortion, with weaker signal than the red galaxy sample, is found for , indicating that background, lensed galaxies contribute significantly.
4. Magnification Bias
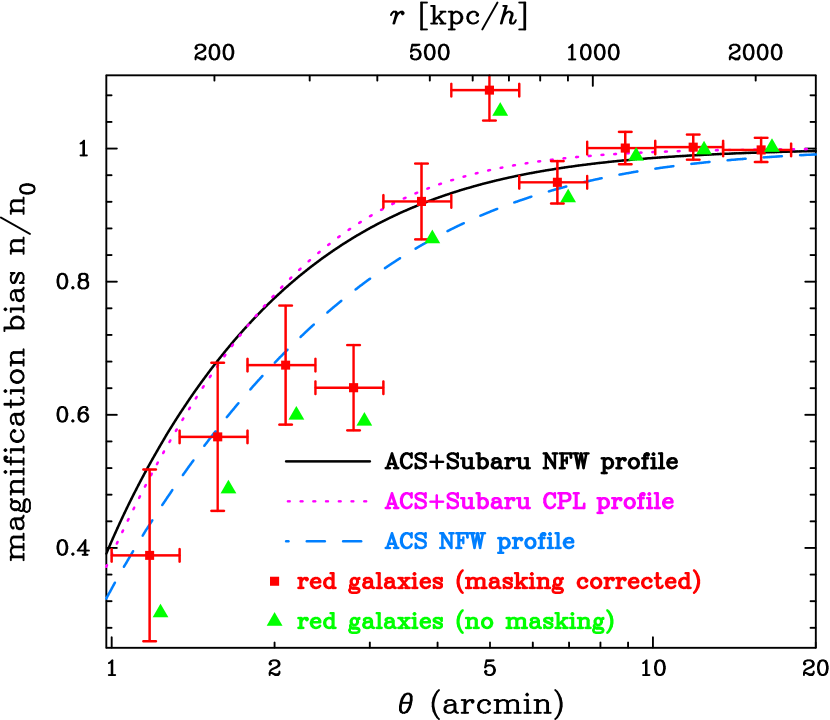
Lensing magnification, , influences the observed surface density of background galaxies, expanding the area of sky, and enhancing the flux of galaxies (BTP). The number counts for a given magnitude cutoff , approximated as a power law with slope , are modified as , where is the unlensed counts. Thanks to the large Subaru FOV, the normalization and slope of for our red galaxy sample are reliably estimated as arcmin-2 and from the outer region . The slope is less than the lensing invariant slope, , so a net deficit of background galaxies is expected.
We conservatively account for the masking of observed sky by excluding a generous area around each cluster sequence galaxy, where and are defined as 3 times the major (A_IMAGE) and minor axes (B_IMAGE) computed from SExtractor, corresponding to the isophotal detection limit (Bertin & Arnouts 1996). The number density in each radial annulus is then calculated by excluding this area and simply renormalising. Note that, if we adopt the masking factor of or instead of , the results shown below are little changed.
Figure 2 shows that the red galaxy counts are clearly depleted, with a clear trend towards higher magnification in the center. The masking area is negligible at large radius and rises to of the sky close to the center, . Comparison with models shows that the data are broadly in agreement with the profiles as described in §5. We have ignored the intrinsic clustering of background galaxies, which seems a good approximation, though some variance is apparent in 2D maps (Umetsu et al. 2004) and may explain a discrepant point at in the radial profile.
5. Model-Independent Mass Profile
The relation between distortion and convergence is non-local, and masses derived from distortion data alone suffers from a mass sheet degeneracy. However, by combining the distortion and magnification measurements the convergence can be obtained unambiguously. Here we derive a model-independent, discrete convergence profile in 10 logarithmically spaced bins for : for , representing 10 free parameters which are constrained with 20 data points in Figures 1 and 2.
To perform the mass reconstruction, we need to express the lensing observables in terms of the binned convergence profile. The tangential shear amplitude in the -th radial bin can be expressed as (Fahlman et al. 1994), where is the average convergence interior to radius and expressed as with the bin width . Once the shear profile is given, it is straightforward to compute the binned tangential distortion and magnification via the relations (at radii of our interest) and . However, for the discrete model, to properly compute the shear in the first bin, we need to specify the mass interior to radius , which is readily obtained from the well constrained ACS derived profile. We have checked that, if we instead adopt the model independent mass interior to the Einstein radius (″), the results are very similar.
The best-fitting model is then derived by properly weighting signal-to-noise () ratios of the distortion and magnification data (e.g., see Schneider, King & Erben 2000). Since covariance between the distortion and magnification signals can be ignored, the is simply expressed as with and Note that denotes the number counts in the -th radial annulus and the model counts is given in terms of the unlensed surface density and the model magnification as , where is the effective observed area of the -th annulus excluding the masking area by the cluster members (see §4).
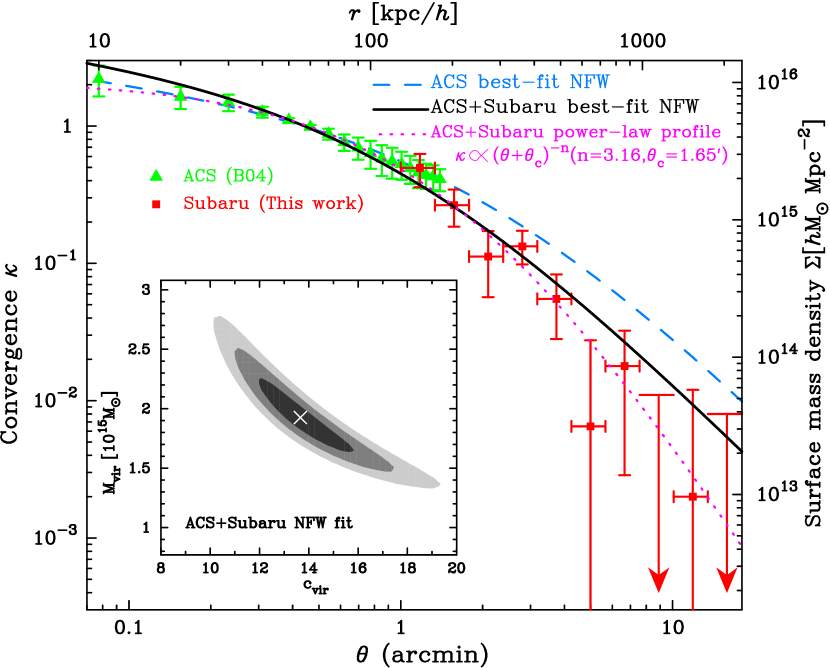
The square symbols in Figure 3 show the best-fitting mass profile obtained from the Subaru data, where the minimized value is for 10 degrees of freedom. The bad is mainly due to the two data points at and in Figure 2, which apparently deviate from a continuous curve and are probably affected by the intrinsic clustering of background galaxies. Excluding the two data points leads to an acceptable fit , meaning the best-fit mass profile well reproduces the distortion and magnification data simultaneously111If we use the distortion data for the red+blue galaxies (the cross symbols in Figure 1), the minimum gets worse, , and the mass profile is significantly underestimated.. The outer profile at is consistent with a null signal to within (the points at and are upper limits), implying a more rapid decay in mass profile than expected from the standard NFW profile, falling well short of the anticipated virial radius. We have also checked that this result is not sensitive to varying the count-slope and the unlensed background galaxy density within the measurement errors.
Force fitting an NFW profile to the Subaru mass profile yields (Mpc/) for the virial mass (radius), where . Note that the NFW profile is specified by the two parameters, and halo concentration (Bartelmann 1996), and we have adopted the flat prior because the NFW profiles with can not be distinguished by the Subaru data alone due to lack of information on the inner density profile. The error quotes 68 confidence intervals (). A pure power-law profile given by also provides a good fit with (), corresponding to a 3D profile, . A singular isothermal sphere with is excluded at more than level
Next, we consider the combined Subaru and ACS profile, where the ACS profile with error bars is taken from Figure 22 in B04 and the amplitude is scaled to from the result. By combining the strong and weak lensing analyses, we can trace the mass distribution over a large range in amplitude and in radius Mpc. In this case, we have 22 independent data points in total excluding the ACS data points at radii overlapping with the Subaru data. The best-fitting NFW profile is given by and (Mpc/), and has an acceptable fit . The inset plot shows how the constraints are degenerate in the (, ) plane. Hence, this result gives the lensing based confirmation of the NFW profile over the radii we have considered, however, the mass distribution appears to be much more concentrated toward the center than the CDM simulations predict for a halo of the above mass, (Bullock et al. 2001). A generalized NFW profile given by (e.g., Moore et al. 1998) is disfavored (; see Umetsu et al. 2004 for more details), being too steep in the center. A cored power-law profile, , gives a better fit: with a steep slope, , and a core of arcmin ( kpc/). A softened isothermal profile is strongly rejected ( level!).
6. Discussion and Conclusions
We have obtained a secure, model-independent mass profile of A1689 over () by combining the distortion and magnification-bias measurements from high-quality Subaru imaging. We have seen that to reliably measure distortions it is critically important to securely select background galaxies in order to avoid dilution of the distortion signal by blue cluster members and foregrounds (see Figure 1). Thus we have resolved the discrepancy between the small Einstein radius (″) inferred from the previous work based on largely monochromatic measurements and the observed radius (″). The mass profile of A1689 obtained from the Subaru and ACS data covers 2 orders of magnitude in radius, , and shows a continuously steepening profile with increasing radius, very similar to an NFW profile but with a much higher concentration than expected. The best-fitting NFW profile has , significantly larger than expected , corresponding to the profile expected for a much lower mass halo of (Bullock et al. 2001), 3-4 orders of magnitude less than the mass of A1689. A higher concentration may imply a higher than expected redshift for cluster formation, corresponding to a greater mean cosmological mass density, so that collapsed objects of a given mass have a higher internal density. A higher redshift of cluster formation may also help account for the lack of evolution observed in the properties of galaxy clusters (Mathis, Diego & Silk 2004). Although A1689 is a very round shaped cluster with evidence of only modest substructure (B04; also see Andersson & Madejski 2004 for related discussion based on the -ray data), projection of structure along the line of sight may potentially boost the surface density increasing the derived concentration. Substructure may be examined further with redshift measurements for this cluster. Simulations may also provide a good guide to the level of bias one may expect due to projection in general (e.g., Clowe, Lucia & King 2004).
Careful lensing work on other clusters may also point to higher concentrations than expected. Gavazzi et al. (2003) quote for the cluster MS2137-23, but with a low significance. The situation for Cl0024 might be complicated by prominent substructure, with a high concentration for the main clump, , and a low concentration, , for the secondary clump (Kneib et al. 2003). Subaru imaging in more passbands will provide many reliable photometric redshifts for refining the background selection, helping to improve the distortion signal and allowing the lens magnification to be separated from the background clustering. In addition, the redshift dependence of the distortion and magnification signals may be extracted to constrain cosmological parameters.
References
- (1) Andersson, K. E., Madejski, G. M., 2004, ApJ, 607, 190
- (2) Athreya, R. M., Mellier, Y., Van Waerbeke, L., Pelló, R., Fort, B., Dantel-Fort, M., 2002, A&A, 384, 743
- (3) Bardeau, S., Kneib, J.-P., Czoske, O., Soucail, G., Smail, I., Ebeling, H., 2004, astro-ph/0407255
- (4) Bartelmann, M., 1996, A&A, 313, 697
- Bertin, Arnouts (1996) Bertin, E., & Arnouts, S. 1998, A&AS, 117, 393
- (6) Broadhurst, T. J., Taylor, A. N., Peacock, J. A., 1995, ApJ, 438, 49 (BTP)
- (7) Broadhurst, T. J., Benitez, N., et al., 2004, ApJ in press, astro-ph/0409132 (B04)
- (8) Bullock, J. S., Kolatt, T. S., Sigad, Y., Somerville, R. S., Kravtsov, A. V., Klypin, A. A., Primack, J. R., Dekel, A., 2001, MNRAS, 321, 559
- (9) Clowe, D., Schneider, P., 2001, A&A, 379, 384
- (10) Clowe, D., Lucia, G. D., King, L., 2004, MNRAS, 350, 1038
- (11) Dye, S., et al., 2002, A&A, 386, 12
- (12) Erben, T., Van Waerbeke, L., Bertin, E., Mellier, Y., Schneider, P., 2001, A&A, 366, 717
- (13) Fahlman, G., Kaiser, N., Squires, G., Woods, D., 1994, ApJ, 437, 56
- (14) Fort, B., Mellier, Y., Dantel-Fort, M., 1997, A&A, 321, 353
- (15) Gavazzi, R., Fort, B., Mellier, Y., Pelló, R., Dantel-Fort, M., 2003, A&A, 403, 11
- (16) Kaiser, N., Squires, G., Broadhurst, T., 1995, ApJ, 449, 460
- (17) Kneib, J.-P., et al., 2003, ApJ, 598, 804
- (18) Mathis, Diego & Silk 2004,MNRAS submitted, astro-ph/0402461
- Miyazaki et al. (2002) Miyazaki, S., et al. 2002, PASJ, 54, 833
- (20) Moore, B., Governato, F., Quinn, T., Stadel, J., Lake G., 1998, ApJ, 499, L5
- (21) Navarro, J. F., Frenk, C. S., White, S. D. M., 1997, ApJ, 490, 493
- (22) Schneider, P., King, L., Erben, T., 2000, A&A, 353, 41
- (23) Taylor, A. N., Dye, S., Broadhurst, T. J., Benitez, N., van Kampen, E., 1998, ApJ, 501, 539
- Yagi et al. (2002) Yagi, M., Kashikawa, N., Sekiguchi, M., et al. 2002, AJ, 123, 66