Correlations among Multi-Wavelength Luminosities of Star-Forming Galaxies
Abstract
It has been known for two decades that a tight correlation exists between global far-infrared (FIR) and radio continuum (1.4 and 4.8 GHz) fluxes/luminosities from galaxies, which may be explained by formation activities of massive stars in these galaxies. For this very reason, a correlation might also exist between X-ray and FIR/radio global luminosities of galaxies. We analyze data from ROSAT All-Sky Survey and IRAS to show that such correlation does indeed exist between FIR (m) and soft X-ray (keV) luminosities and in 17 normal star-forming galaxies (NSFGs) including 16 late-type galaxies and 1 host-dominant Seyfert galaxy as well as in 14 active star-forming galaxies (ASFGs) consisting of starburst-dominant Seyfert galaxies. The quantitative difference in such correlations in NSFGs and in ASFGs may be interpreted in terms of evolutionary variations from classic starburst galaxies to starburst-dominant Seyfert galaxies. Meanwhile, some low-luminosity AGNs (LLAGNs) tend to exhibit such a correlation that we infer for star-forming galaxies, implying that star-forming activities might be more dominant in LLAGNs. In contrast, AGN-dominant Seyfert galaxies do not show such a versus correlation; this is most likely related to accretions towards supermassive black holes (SMBHs) in galactic nuclei. In order to establish a physical connection between the correlation and global star formation rate (SFR) in galaxies, we empirically derive both and relations with the blue-band luminosity roughly representing the mass of a galaxy. It appears that the more massive galaxies are, the more star formation regions exist in these galaxies. The global SFR is not only associated with the mass of a galaxy but also closely related to the level of star-forming activities therein. We propose a relation between soft X-ray luminosity and SFR in star-forming galaxies. In order to probe the relation, we construct an empirical model in which both FIR and X-ray emissions consist of two components with one being closely associated with star formation and the other one not. Based on this model, we infer a linear relation between FIR/soft X-ray in star formation regions and radio luminosities, and get a linear relation between and for star forming regions.
keywords:
infrared: galaxies — X-rays: galaxies — star: formation — galaxies: Seyfert — galaxies: spiral — galaxies: starburst1 Introduction
A strong correlation exists between far-infrared (FIR) and radio continuum (at 1.4 and 4.8 GHz frequencies) global fluxes/luminosities in star-forming galaxies as revealed by Infrared Astronomy Satellite (IRAS) data and radio continuum observations (e.g., Dickey & Salpeter 1984; de Jong, Klein, Wielebinski & Wunderlich 1985; Helou, Soifer & Rowan-Robinson 1985; Hummel et al. 1988; Andersen & Owen 1995; Condon, Anderson & Helou 1991). At the time of this important discovery, this tight global correlation was unexpected because the radio and FIR emissions were thought to involve distinctly different physical processes, that is, the radio continuum emission is primarily caused by synchrotron emissions from relativistic cosmic-ray electrons gyrating around galactic magnetic fields (e.g., Lou & Fan 2003 and references therein), while the FIR emission is primarily caused by thermal emissions from dust grains submerged in an intense ultraviolet (UV) radiation field (e.g., Lou & Fan 2000 and references therein). Currently, the qualitative physical explanation for such a global correlation is that the FIR emission is mainly caused by dust grain absorption of UV photons emitted by young massive stars nearby, while sources of relativistic cosmic-ray electrons are mainly associated with magnetohydrodynamic (MHD) shocks of massive stellar winds or supernova explosions (e.g., Lou 1993, 1994) that are end stages of massive stars — the primary source of UV radiations that heat up interstellar dust grains. Globally, both FIR and radio emissions are thought to be intimately related to formation activities of massive stars in star-forming galaxies. This perspective is also supported by the fact that radio continuum emissions are well correlated with Hα emissions mainly from HII regions ionized by young massive stars (e.g., Lequeux 1971; Rieke & Lebofsky 1979; Klein 1982; Wynn-Williams 1982; Hummel et al. 1988; Anderson & Owen 1995; Lou & Fan 2000, 2003; Lou et al. 2002; Lou & Shen 2003; Lou & Zou 2004a, b; Shen & Lou 2004a, b; Shen, Liu & Lou 2004; Lou & Wu 2004).
There are various sources of X-ray emissions from galaxies (e.g., West, Barber & Folgheraiter 1997 for the nearby M31 – the Andromeda galaxy). X-ray emissions of star-forming galaxies come from coronae of stars, close accreting X-ray binaries such as low-mass X-ray binaries (LMXBs) and high-mass X-ray binaries (HMXBs), supernova remnants and hot plasmas associated with star-forming regions as well as galactic winds pumped by starbursts (e.g., Fabbiano 1989; Dahlem et al. 1998; Fabbiano & White 2003; Persic & Rephaeli 2002; Persic et al. 2004; Lou & Wu 2004).
As some X-ray sources such as HMXBs and Type II supernova remnants can be physically associated with formation activities of massive stars, a correlation may exist between FIR and X-ray global fluxes/luminosities. In fact, an empirical correlation between the FIR and X-ray global luminosities from the young objects (e.g. HMXBs) has been reported in star-forming galaxies and the correlation is naturally interpreted in terms of star formation activities in galaxies, which in turn implies a correlation between X-ray luminosity and star formation rate (SFR). David et al. (1992) derived a linear relationship between the logarithms of X-ray (keV) and FIR luminosities, i.e., in the normal and starburst galaxies using the X-ray data of EINSTEIN satellite and suggested a two-component model for to fit this correlation. Ranalli et al. (2003) inferred a much better correlation between soft X-ray (keV)/hard X-ray (keV) and FIR/radio (1.4GHz) luminosities in star-forming galaxies using X-ray data from the BeppoSAX and ASCA satellites, and further found that such correlation persists in star-forming galaxies of higher redshifts (i.e., ). In particular, they suggested that keV X-ray luminosity may be regarded as an indicator for the SFR. Grimm, Gilfanov & Sunyaev (2003) used the X-ray luminosity from a collection of HMXBs to estimate the SFR and found the correlation between the X-ray luminosity and the SFR to be nonlinear in the low SFR regime, while the relation becomes linear in the high SFR regime with – a result that differs from that of Ranalli et al. (2003). Gilfanov, Grimm & Sunyaev (2004) discussed the different results and suggested that the difference should be caused by X-ray emissions from source objects other than HMXBs in the low SFR regime. Persic et al. (2004) also used the keV X-ray luminosity from a collection of HMXBs as an indicator of SFR and pointed out that the total keV and soft X-ray luminosities may not be reliable SFR indicators.
In this investigation, we shall use the data in soft X-ray (keV) band of Röntgen Satellite (ROSAT) All-Sky Survey and the FIR (m) data of IRAS to examine possible global luminosity correlations in normal star-forming galaxies and in active star-forming galaxies; the latter are also classified as starburst-dominant Seyfert galaxies according to Mouri & Taniguchi (2002). In particular, the correlation between soft X-ray and FIR luminosities in this class of galaxies has not been examined before. Also, galaxies in the data sample we select have not been investigated in the previous work (e.g., David et al. 1992). We have also acquired the radio (1.4GHz) data from the NRAO/VLA Sky Survey (NVSS) and the B-band (B) optical data from both the Lyon/Meudon Extragalactic Database (LEDA) and the NASA Extragalactic Database (NED).
| Name | |||||
|---|---|---|---|---|---|
| (erg/s) | (erg/s Hz) | (erg/s) | |||
| F00146-1934 | 40.92 | 43.18 | 28.17 | 43.70 | 0.32 |
| F00317-2142 | 42.83 | 44.53 | 29.82 | 44.34 | 0.49 |
| F00361-2432 | 41.10 | 43.38 | 28.60 | 43.58 | 0.35 |
| F01134+3045 | 41.57 | 43.36 | 29.28 | 44.16 | 0.41 |
| F01590-3158 | 41.28 | 43.85 | 28.92 | 43.62 | 0.84 |
| F02223-1921 | 43.02 | 44.32 | 29.88 | 44.53 | 0.43 |
| F05128+5308 | 42.31 | 44.38 | 29.53 | 44.30 | 0.74 |
| F06483-1955 | 42.08 | 44.11 | - | - | 0.71 |
| F10290+6517 | 40.01 | 42.64 | - | 43.43 | 0.30 |
| F10354-2651 | 41.07 | 42.85 | - | 42.91 | 0.45 |
| F15370+3155 | 40.67 | 42.63 | 27.42 | 42.84 | 0.52 |
| F17376+7207 | 40.89 | 43.20 | - | 43.71 | 0.42 |
| F17364+2458 | 41.48 | 43.59 | - | 43.74 | 0.64 |
| F20240-5233 | 41.27 | 43.45 | - | 43.88 | 0.38 |
| F21468-5530 | 42.90 | 44.13 | - | - | 0.46 |
| F23229+2834 | 42.06 | 44.35 | - | 44.38 | 0.58 |
Column 1 lists names of source objects identified by the IRAS catalogue. Columns 2 through 5 list the logarithms of soft X-ray ( keV) luminosity, FIR (m) luminosity, radio (1.4 GHz) luminosity and optical B-band luminosity, respectively. Column 6 lists the FIR colour temperature defined by .
In Section 2, we describe the procedure of data sample selection and introduce identifications for various types of galaxies. We analyze available data in Section 3 to reveal correlations between global soft X-ray and FIR luminosities in normal star-forming galaxies (NSFGs) (i.e. late-type galaxies and host-dominant Seyfert galaxies) and in active star-forming galaxies (ASFGs) (i.e. starburst-dominant Seyfert galaxies); similar analysis fails to show such a correlation in AGN-dominant Seyfert galaxies. In parallel, we have also analyzed , and to examine soft X-ray and star formation properties in NSFGs. In Section 4, we indicate that multi-wavelength luminosity correlations may be associated with star formation processes and the global SFR in galaxies. We infer empirically the relation between soft X-ray luminosity and the SFR in star-forming galaxies. In Section 5, we introduce a two-component model to fit the correlation between soft X-ray and FIR global luminosities and estimate relevant errors.
| Name | Notes | |||||
|---|---|---|---|---|---|---|
| (erg/s) | ||||||
| F00392-7930 | 42.63 | 44.18 | 44.22 | AGN | ||
| F00489+2908 | 42.65 | 44.15 | 44.24 | AGN | ||
| F01194-0118 | 43.39 | 44.64 | 44.07 | SB | ||
| F01572+0009 | 44.38 | 45.75 | 44.81 | |||
| F02366-3101 | 42.75 | 44.53 | 44.35 | SB | ||
| F02553-1642 | 43.56 | 44.62 | 44.15 | SB | ||
| F04305+0514 | 44.22 | 44.23 | 44.47 | AGN | ||
| F04340-1028 | 43.68 | 44.56 | 44.63 | AGN | ||
| F04565+0454 | 42.09 | 43.68 | 44.01 | AGN | ||
| F05136-0012 | 44.32 | 43.92 | 44.59 | AGN | ||
| F05177-3242 | 41.43 | 43.37 | 43.66 | AGN | ||
| F06279+6342 | 42.65 | 43.47 | 43.64 | AGN | ||
| F06563-6529 | 42.89 | 43.85 | - | - | ||
| F07327+5852 | 41.25 | 42.58 | 42.53 | SB | ||
| F07431+6103 | 43.49 | 43.89 | 44.68 | AGN | ||
| F09497-0122 | 41.91 | 43.69 | - | - | ||
| F09595-0755 | 43.63 | 44.49 | - | - | ||
| F12393+3520 | 42.49 | 43.91 | 44.28 | AGN | ||
| F12495-1308 | 43.01 | 43.47 | 43.69 | AGN | ||
| F13204+0825 | 42.62 | 44.41 | 43.98 | SB | ||
| F13224-3809 | 43.78 | 44.84 | - | - | ||
| F15091-2107 | 43.02 | 44.47 | 44.21 | SB | ||
| F15288+0737 | 43.18 | 44.05 | 44.13 | AGN | ||
| F15572+3510 | 43.27 | 43.89 | 44.05 | AGN | ||
| F17550+6520 | 43.51 | 44.36 | - | - | ||
| F18402-6224 | 42.80 | 43.06 | 43.78 | AGN | ||
| F20044-6114 | 42.83 | 43.47 | 44.01 | AGN | ||
| F20437-0259 | 43.30 | 43.73 | 44.19 | AGN | ||
| F22062-2803 | 43.05 | 44.18 | 44.45 | AGN | ||
| F22402+2927 | 44.20 | 43.73 | 43.97 | AGN | ||
| F23279-0244 | 42.67 | 43.96 | 44.27 | AGN | ||
| F08518+1752 | 43.58 | 44.57 | - | - | ||
| 04312+4008 | 43.10 | 44.07 | - | - | ||
| F05262+4432 | 42.77 | 44.35 | - | - | ||
| F09494-0635 | 42.47 | 43.27 | 44.11 | AGN | ||
| F14400+1539 | 44.82 | 44.59 | 44.77 | |||
| F16136+655 | 42.18 | 44.83 | 43.41 | |||
| F20414-1054 | 44.39 | 44.19 | 44.75 | AGN | ||
Column 1 lists names of source objects identified by the IRAS catalogue. Columns 2 through 5 list the logarithms of X-ray ( keV) luminosity, FIR (m) luminosity and optical B-band luminosity, respectively. Column 6 lists brief notes: AGN for active galactic nucleus, SB for starburst and for brightness magnitude in B-band.
| Name | Notes | |||||
|---|---|---|---|---|---|---|
| (erg/s) | ||||||
| F00076-0459 | 42.94 | 43.82 | 44.04 | AGN | ||
| F01413+0205 | 41.66 | 43.57 | 43.56 | SB | ||
| F02537-1641 | 42.28 | 43.92 | 43.49 | SB | ||
| F04265-4801 | 41.17 | 43.76 | 44.02 | AGN | ||
| F04575-7537 | 41.66 | 43.44 | 43.82 | AGN | ||
| F05497-0728 | 41.07 | 43.42 | 43.91 | AGN | ||
| F11210-0823 | 41.67 | 43.48 | 44.08 | AGN | ||
| F13445+1121 | 41.50 | 44.21 | 43.31 | |||
| F14288+5255 | 42.07 | 44.29 | - | - | ||
| F17020+4544 | 44.10 | 44.62 | - | - | ||
| F17489+6843 | 42.62 | 44.25 | 44.14 | SB | ||
See the same definitions of columns contained in Table 2.
| Name | Notes | |||||
|---|---|---|---|---|---|---|
| (erg/s) | ||||||
| F14207+3304 | 41.89 | 44.04 | 44.28 | host | ||
| F15083+6825 | 42.74 | 44.49 | 44.19 | SB | ||
| F22377+0747 | 43.31 | 43.76 | 43.97 | AGN | ||
| F22454-1744 | 44.04 | 45.07 | 44.08 | SB | ||
See the same definitions of columns contained in Table 2. Here, ‘host’ stands for a host-dominant Seyfert galaxy.
| Name | Notes | |||||
|---|---|---|---|---|---|---|
| (erg/s) | ||||||
| F11353-4854 | 42.35 | 43.76 | 44.40 | AGN | ||
| F13218-1929 | 42.20 | 43.77 | 43.38 | SB | ||
| F15564+6359 | 42.45 | 43.98 | 43.62 | SB | ||
| F16277+2433 | 42.05 | 44.16 | 43.84 | SB | ||
| F17551+6209 | 42.93 | 44.50 | - | - | ||
See the same definitions of columns contained in Table 2.
| Name | Notes | |||||
|---|---|---|---|---|---|---|
| (erg/s) | ||||||
| F01248+1855 | 42.99 | 43.56 | 43.76 | AGN | ||
| F06457+7429 | 42.17 | 43.53 | 43.72 | AGN | ||
| F11034+7250 | 41.72 | 43.12 | 43.89 | AGN | ||
| F11112+0951 | 42.93 | 44.27 | 44.44 | AGN | ||
| F14157+2522 | 43.68 | 43.53 | 44.16 | AGN | ||
| F23163-0001 | 43.29 | 43.97 | 44.30 | AGN | ||
See the same definitions of columns contained in Table 2.
2 SELECTION OF DATA SAMPLES
Soft X-ray observations of the ROSAT All-Sky Survey were in the photon energy band keV. The 120,000 X-ray sources detected in the RASS II processing of the ROSAT All-Sky Survey have been systematically compared and correlated with 14,315 IRAS galaxies selected from the IRAS Point Source Catalogue, among which 197 objects of soft X-ray emissions are most likely associated with the corresponding IRAS galaxies. For these 197 source objects, their soft X-ray emission properties are examined and compared with their FIR emission properties. The data in the soft X-ray band are provided by the ROSAT satellite which features a high sensitivity X-ray telescope and a low background Position Sensitive Proportional Counter (PSPC) detector (see e.g., Boller et al. 1992 and Boller et al. 1998).
Among these 197 objects, there are 15 spiral galaxies (peculiar galaxies not included here) and 1 irregular galaxy (see Table 1) which are classified as late-type galaxies belonging to NSFGs, 38 Seyfert 1 galaxies (see Table 2), 11 Seyfert 2 (see Table 3), 4 Seyfert 1.8 galaxies (see Table 4), 5 Seyfert 1.9 galaxies (see Table 5) and 6 Seyfert 1.5 galaxies (see Table 6). The rest of the source objects not tabulated here are elliptical galaxies, normal galaxies with peculiar characteristics or FIR sources each corresponding to two or more X-ray sources.
In order to compute a soft X-ray (keV) energy flux from a PSPC count rate, Boller et al. (1998) presumed a simple power-law energy spectrum, namely
| (1) |
where is the energy flux in the photon energy range of and from a source galaxy, the fixed photon spectral index is taken to be – a typical value estimated for extragalactic source objects found by ROSAT (see e.g., Hasinger, Trümper & Schmidt 1991 and Walter & Fink 1993), and the proportional coefficient in expression (1) involves an absorbing column density of hydrogen fixed at the Galactic value along the line of sight (e.g., Stark et al. 1992).
The total FIR (m) flux may be estimated (see Helou et al. 1985) by using the and band fluxes, and , of the IRAS data, namely
| (2) |
The X-ray and FIR fluxes were converted to luminosities using the formula adopted by Schmidt & Green (1986), namely
| (3) |
where is the speed of light, the Hubble constant km s-1Mpc-1 was recently determined by observations of the Wilkinson Microwave Anisotropy Probe (WMAP) (e.g., Spergel et al. 2003) and the power-law spectrum in the energy range is such that the two redshift dependent functions and are given by
| (4) |
and
| (5) |
respectively. For the photon spectral index in the FIR band, we take (e.g., Boller et al. 1998). Meanwhile, we have also acquired the radio continuum (1.4 GHz) and optical B-band data from the NED and the LEDA.
In this sample, we classify Seyfert galaxies as AGN-dominant Seyfert galaxies that are characterized by and , starburst-dominant Seyfert galaxies that are characterized by , and host-dominant Seyfert galaxies that are characterized by . We have only selected those galaxies with total apparent corrected B-band magnitude mag (see Mouri & Taniguchi 2002).
Here we identify 34 AGN-dominant Seyfert galaxies, 14 starburst-dominant Seyfert galaxies and 1 host-dominant Seyfert galaxy. Emissions from AGN-dominant Seyfert galaxies were presumably powered by accretion processes around SMBHs in the galactic centers, while those from starburst-dominant Seyfert galaxies are powered by star formation activities in circumnuclear regions (e.g. Lou et al. 2001) and are also regarded as ASFGs. For the only host-dominant Seyfert galaxy F14207+3304 with the host galaxy being a spiral galaxy, we regard it as a NSFG.
On the basis of the preceding classification, we find that starburst-dominant Seyfert galaxies consist preferentially of Seyfert 2 galaxies, while AGN-dominant Seyfert galaxies consist preferentially of Seyfert 1 galaxies. From this difference, we may be able to test the unification scheme of AGN scenario indirectly. In this model scenario, there is a dust torus around the central SMBH and the different observational appearances of Seyfert 1 and 2 galaxies are related to the different geometrical orientations of the system relative to the line of sight. Seyfert 1 galaxies are thought to be face-on towards us, so that the dust torus cannot block or obscure radiations from the central SMBH. In this picture, AGN-dominant Seyfert galaxies and Seyfert 1 galaxies should be closely related to each other. In comparison, for a Seyfert 1 galaxy nearly edge-on towards us, if the dust torus is Compton thick, most of the radiation from the central SMBH will be blocked and obscured by the torus with reduced apparent AGN emissions. This would make starburst-dominant Seyfert galaxies appear as Seyfert 2 galaxies.
3 DATA ANALYSIS OF GALACTIC LUMINOSITIES
Here we perform the least-square analysis to reveal possible correlations in luminosities of galaxies in different bands, and provide an estimate for the dispersion or scattering around the best-fit relation in terms of for the standard deviation , namely
| (6) |
where is the observationally inferred luminosity and is the luminosity expected from the best fit relation, is the number of sample used and is the number of free parameters. In our case, and we further introduce a parameter for the logarithm of the ratio to , namely
| (7) |
This parameter is analogous to the suggested parameter by Helou et al. (1986) for the correlation between and and we here analyze the correlation between soft X-ray and FIR luminosities, and the standard deviation of can be similarly defined by
| (8) |
where is the mean and is the number of data sample.
| GS | ||||||||
|---|---|---|---|---|---|---|---|---|
| NSFGs | 0.91 | 0.37 | 2.04 | 0.38 | ||||
| NSFGs | 0.92 | 0.36 | - | - | ||||
| ASFGs | 0.90 | 0.32 | 1.56 | 0.38 | ||||
| AGNs | 0.57 | 0.71 | 0.82 | 0.71 | ||||
| NSFGs | 0.80 | 0.50 | - | - | ||||
| NSFGs | 0.87 | 0.33 | - | - |
Here we assume a linear fitting expression in the form of and we summarize the , physical variables, galaxy samples (GS), the fitting slope , the fitting intercept , the correlation coefficient , the standard deviation of the correlation , the mean of parameter , and the standard deviation in parameter.
3.1 Correlations of Global FIR (Radio) and X-Ray Luminosities from Galaxies
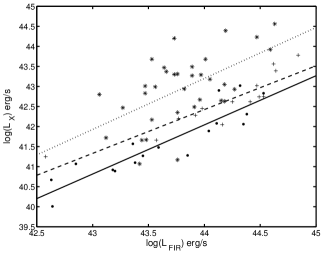
Displayed in Figure 1 are soft X-ray (keV) luminosity versus FIR luminosity of NSFGs (solid circles), ASFG (crosses) and AGN-dominant galaxies (asterisks), respectively, in a log-log plot to confirm the correlations between soft X-ray and FIR global luminosities, and their least-square fit lines are straight solid, dashed and dotted lines, respectively. We list the results of correlation and the mean value of in Table 7. The value for the source object F14207+3304 is suggesting that F14207+3304 belongs to the class of NSFGs.
We notice the difference of the correlation in NSFGs and ASFGs, that is, the mean value of in NSFGs is larger than that in ASFGs. For the same soft X-ray luminosity, the global FIR emission from the ASFGs is weaker than that from the NSFGs. Or equivalently, for the same global FIR luminosity, the X-ray luminosity from the NSFGs is weaker than that from the ASFGs.
In reference to the luminosity correlations in star-forming galaxies (including NSFGs and ASFGs), such a correlation in AGN-dominant Seyfert galaxies becomes much weaker with considerable scatters. By using the F-test (e.g., Taylor 1981), we find that the correlations in the NSFGs and the ASFGs are much better than that in the AGN-dominant Seyfert galaxies at level. And the mean value of in the AGN-dominant Seyfert galaxies is much lower than those in the NSFGs and the ASFGs; this is most likely caused by central accretion activities around SMBHs harboured in galactic nuclei. By a visual inspection of Fig. 1, it is clear that for the same FIR luminosity, the soft X-ray emission is considerably higher in AGN-dominant Seyfert galaxies. Also from Fig. 1, we note that the distribution of AGN-dominant Seyfert galaxies is bound from below by a relatively narrow region occupied by star-forming galaxies. Some LLAGNs also show a similar correlation that we infer for star-forming galaxies, implying that emission processes from these LLAGNs might be more controlled by star formation activities.
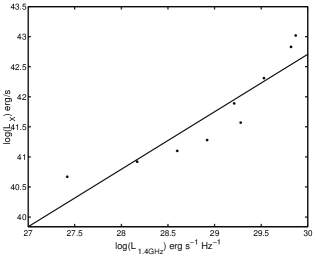
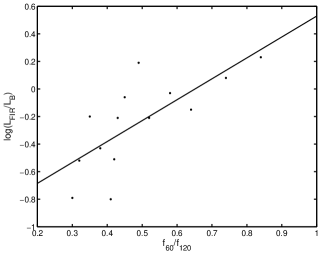
In addition, we infer a correlation between soft X-ray and 1.4GHz radio continuum luminosities in NSFGs as shown in Fig. 2; details of this empirical relation are summarized in Table 7.
3.2 Correlations of X-Ray (FIR) and Optical B-Band Luminosities in Star-Forming Galaxies
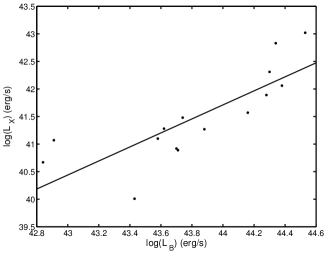
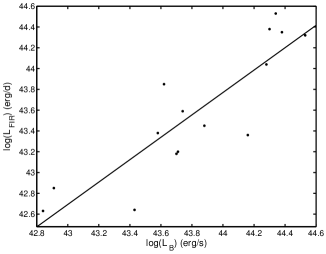
In the previous section, we have inferred the correlations between soft X-ray and FIR global luminosities in star-forming galaxies. In Figs. 3 and 4 of this section, we examine the versus and versus relations in the NSFGs, with details of this relation contained in Table 7.
Except at the level, the correlation in soft X-ray and FIR luminosities is not significantly better than that in soft X-ray and optical B-band luminosities. In star-forming galaxies, the more massive the galaxy is, the more regions of star formation it will contain, because the optical B-band luminosity may roughly represent the mass of a galaxy. The X-ray/FIR luminosities can be determined by star formation activities and this may be the underlying cause for the correlation between X-ray/FIR and optical B-band emissions. It is sensible to reason that the star formation rate is not only associated with the mass of a galaxy but also with the active level of star formation processes in that galaxy. The active level of star formation processes in galaxies can be roughly represented by both and the FIR colour temperature ; their gross correlation is therefore shown in Fig. 5 with a correlation coefficient .
3.3 Evolution from Starburst Galaxies to Starburst-Dominant Seyfert Galaxies
In Fig. 1, we call attention to a quantitative difference in global luminosity correlations in NSFGs and ASFGs. This difference can also be expressed in terms of different mean values of , that is, for the same global soft X-ray luminosity, the FIR emission tends to be stronger in NSFGs, or equivalently, for the same global FIR luminosity, the soft X-ray emission tends to be stronger in ASFGs. We suspect that this difference might be related to an evolution from starburst galaxies to starburst-dominant Seyfert galaxies.
The physical process of starbursts is thought to be a key piece of the AGN machinery. The central AGN and the process of starbursts may be either symbiotic or evolutionary (e.g., Perry & Dyson 1985). Circumnuclear starbursts occur at radii of pc, while the fueling of an AGN occurs at radii of pc. More observational evidence and theoretical studies (e.g., Lou et al. 2001 and references therein) point to the possibility of MHD density waves as the underlying cause of large-scale “ring” or spiral as well as other patterns. In some cases, these circumnuclear patterns are likely driven by galactic bars on even larger scales (e.g., NGC 1097). From the evolutionary point of view, it is conceivable that a young starburst galaxy may gradually evolve towards a maximum phase of starburst-dominant Seyfert galaxy and then decay as starburst activities gradually peter out.
The difference in correlations between and in the NSFGs and in the ASFGs as observed may reflect the two phases along one evolutionary track. Circumnuclear starbursts in Seyfert galaxies are thought to be sustained over a relatively long period of time. Their starburst ages might be on the order of yr – approximately 10 times longer than the typical classical starburst age (e.g., Glass & Moorwood 1985). In cases of relatively long-lived starburst activities, stellar winds and supernova explosions might have driven away considerable amount of dust grains that would be responsible for FIR emissions, and UV photons from young massive stars may then travel longer distances before being absorbed by dust grains (e.g., Mouri & Taniguchi 2002). In this scenario, the FIR luminosity will decrease leading to a difference in the correlation of and and thus lower values of .
4 SOFT X-RAY LUMINOSITY AND STAR FORMATION RATE (SFR)
The SFR is one of the key parameters to characterize the formation and evolution of galaxies. Some empirical relations have been found between global luminosities in different wave bands and SFR in galaxies (see some examples in Table 3 of Grimm et al. 2003). In particular, Kennicutt (1998) inferred a correlation between the FIR and SFR through a set of numerical simulations, namely
| (9) |
Condon (1992) derived an empirical relation between the radio continuum luminosity at 1.4 GHz and the SFR in galaxies in the form of
| (10) |
The existence of empirical correlations in the logarithms of FIR/radio and soft X-ray global luminosities is naturally suggestive that these emission bands may contain physically relevant information of star formation activities. There are a few more plausible reasons for doing so. In terms of statistics, galactic X-ray emissions are more abundant in soft bands. While soft X-ray emissions may suffer random scatters, they are less affected by contributions of non-star-formation origins, including for example Compton-thick AGNs. We therefore tentatively propose a relation between the SFR and the soft X-ray (keV) luminosity in reference to . On the basis of a mean for NSFGs and equation (9), we then infer
| (11) |
Using the similar procedure, we can derive another SFR relation based on correlation (10) between soft X-ray and radio global luminosities,
| (12) |
which is fully compatible with equation (9) as expected. By equations (9) or (10), one may empirically estimate SFRs via soft X-ray (keV) global luminosities in star-forming galaxies. In other words, the soft X-ray luminosity in the energy band keV may serve as a SFR indicator.
Whether the global soft X-ray luminosity is a sure SFR indicator in a galaxy still remains an interesting open question. In a recent work of data analysis (e.g. Persic et al. 2004), as scatters in the SFR relation is somewhat higher in the soft band than in the hard band, the soft X-ray global luminosity was regarded as a poor indicator for the SFR. Persic et al. (2004) noted that part of these scatters was due to observational errors and most scatters might be caused by X-ray emissions from SN-powered outgoing galactic winds.111For a recently suggested concept of a spiral galactic wind away from both sides of a galactic disc plane, the reader is referred to the global construction of stationary MHD perturbation patterns in a composite system of a stellar disc and an isopedically magnetized gaseous disc by Lou & Wu (2004). Open magnetic field lines and disc activities facilitate ecapes of hot gases. Large-scale MHD density waves lead to large-scale spiral galactic winds. Although a galactic wind may also be associated with star formation processes (e.g., even as an important signature of starbursts; Dahlem et al. 1998; Persic & Rephaeli 2002; Persic et al. 2004), the luminosity of the wind is also influenced by various local source properties. Tyler et al. (2004) found that there exists a fairly good correlation between the level of diffuse soft X-ray emissions and the level of mid-infrared emissions in different regions along spiral arms; such a correlation between diffuse soft X-ray and mid-IR fluxes around galactic centers becomes less clear, tending to support the conclusion of Persic et al. (2004). On the other hand, Ranalli et al. (2003) get less scatters in correlation in soft X-ray band. This does not rule out the possibility that intrinsic absorptions may cause considerable scatters in some cases. In short, global soft X-ray luminosity may seem to serve as an indicator for the SFR in star-forming galaxies in some cases (e.g., Compton thick AGNs or the diffuse X-ray luminosity in the center caused by SN explosions is much weaker than that from the spiral arms.)
5 TWO-COMPONENT MODEL
For NSFGs, we propose an empirical model that both FIR and soft X-ray global luminosities consist of two components, respectively (e.g., David et al. 1992). For FIR emissions, one component is warmer and is presumably originated from active regions of star formation processes, and the other component is cooler and might be cirrus-like dust conglomerations heated by an interstellar radiation field within a galactic disc that are only weakly associated with star formation processes. For soft X-ray emissions, one component of radiation comes from relatively young objects, including HMXBs, Type II supernovae, hot plasmas associated with regions of active star formation and with hot galactic winds from circumnuclear starburst rings as well as possibly from luminous spiral arms (Lou & Wu 2004). These sources usually involve massive stars that heat dusts and grains to radiate FIR bands during certain evolution stages. This may be the physical origin for the correlation between FIR and soft X-ray global luminosities. The other component of soft X-ray radiation comes from relatively older objects, including LMXBs and Type I supernovae; a correlation between this component and star-formation activities is thought to be relatively weak.
Based on these physical ideas, we propose to decompose and in simple forms of
| (13) |
and
| (14) |
where and are respectively FIR and soft X-ray luminosities that are more closely associated with star formation processes (hence the added subscript ‘sf’), and are respectively FIR and X-ray luminosities that belong to the component without associations to star formation processes (hence the added subscript ‘nsf’). The life time of source objects without association to star formation (e.g., LMXBs etc.) might be comparable to the life time of the host galaxy. Consequently, their luminosities may be proportional to the total stellar mass of the respective host galaxies which can be represented by the B-band luminosity (e.g., Grimm et al. 2002; Gilfanov et al. 2004). In reference to optical B-band luminosities of galaxies, we presume and where and are two numerical fitting factors to characterize FIR and soft X-ray luminosities of non-star-formation origins in respective proportions to the B-band luminosity. In the NSFGs, global radio continuum emissions at 1.4 GHz frequency are thought to be primarily caused by star formation processes (e.g., relativistic cosmic-ray electrons gyrating in magnetic field). Based on earlier empirical results, we aim at fitting and (i.e., ) with a linear correlation. Taking as an example, our procedure of fitting is as follows. We write
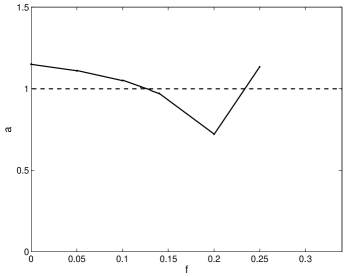
where is the slope and is the intersection in a log-log plot. For a trial value of , we input data for , and to search for a least-square fit parameters and . We then plot the variation of (i.e., the least-square slope ) for a set of values as shown in Fig. 6. For , we have the proportional to linearly. In reference to Fig. 9, we may estimate the value of that is compatible with the result derived earlier by Devereux & Eales (1989).
Using the same method of estimation, we have inferred a value of to be for .
On the basis of expressions (13), (14) and , may be expressed by the linear relation of and ,
| (15) |
where and . Using the sample of NSFGs and performing a minimization, we derive the best fit as
| (16) |
for equation (8), where we infer again a value of .
6 SUMMARY AND PERSPECTIVE
We have analyzed a sample of 17 NSFGs, 14 ASFGs and 34 AGN-dominant Seyfert galaxies, taken from ROSAT RASS II observations of IRAS galaxies. We infer different correlations in these groups of galaxies and discuss plausible causes for these differences. The difference between NSFGs and ASFGs might be caused by an evolution from classic starburst to starburst-dominant Seyfert galaxies, while the difference between NSFGs/ASFGs and AGN-dominant Seyfert galaxies is likely to be caused by the excess of X-ray emissions from the nuclei of galaxies. And the distribution of the AGN-dominant Seyfert galaxies implies that some LLAGNs might be more dominantly influenced by star formation processes.
In addition, we also estimate the , , , relations in NSFGs to complement our study of the correlation between the FIR and soft X-ray global luminosities as well as the relation between such correlation and star formation activities.
Condon (1992) and later Kennicutt (1998) inferred the SFR and SFR relations, respectively. The correlations among FIR, radio continuum and soft X-ray luminosities studied here then imply that FIR, radio continuum and soft X-ray luminosities come from physical processes involved in star formation activities. We thus propose an empirical relation between the SFR and the soft X-ray global luminosity in star-forming galaxies. As an additional diagnostics, it is then possible to estimate SFRs in star-forming galaxies from soft X-ray global luminosities.
In order to plausibly account for these empirical luminosity correlations and deviations for galaxies, we advance a two-component model in this paper: one component of FIR (soft X-ray) emission is associated with star formation processes, while the other component is not.
On the basis of this model analysis, we infer a linear correlation between FIR/X-ray and radio global luminosities from star formation regions, and express soft X-ray luminosity as a linear combination of and . By two different yet complementary ways, we infer almost the same value of factor.
In our data samples, the redshift of selected galaxies are fairly small with majority of them being . Recently, two of the NASA’s Great Space Observatories [i.e., Chandra X-ray Observatory (CXO) and Hubble Space Telescope (HST)] bolstered by the largest ground-based telescopes including the Very Large Telescope (VLT), Keck Telescope, Gemini Telescope and National Optical Astronomy Observatory (NOAO) around the world, are beginning to harvest new clues to the origin and evolution of galaxies in the universe. Barger et al. (2003) obtained optical and near infrared properties for the 2 ms Chandra deep field north X-Ray Sources using the data of Subaru — an 8.2m telescope operated by the National Astronomical Observatory Japan (NAOJ). In particular, the Spitzer Space Telescope (previously known as SIRTF) launched last year has already joined the survey referred to as the Great Observatories Origins Deep Survey (GOODS). By higher sensitivity, better pointing accuracy and broad-band spectral capabilities of the Spitzer, CXO and HST, the GOODS survey will provide unprecendented opportunities for more systematic investigations on interrelations and classifications among optical, FIR and X-ray global luminosities of galaxies in the deep field of higher redshifts (), where earlier star formation can be probed. The empirical correlation between far-infrared and soft X-ray luminosities/fluxes inferred here for fairly low will then be further tested for higher .
Acknowledgments
We thank the anonymous referee for valuable constructive suggestions to improve the manuscript. This research was supported in part by the ASCI Center for Astrophysical Thermonuclear Flashes at the University of Chicago under Department of Energy contract B341495, by the Special Funds for Major State Basic Science Research Projects of China, by the Tsinghua Center for Astrophysics, by the Collaborative Research Fund from the National Natural Science Foundation of China (NSFC) for Young Outstanding Overseas Chinese Scholars (NSFC 10028306) at the National Astronomical Observatory, Chinese Academy of Sciences, by NSFC grant 10373009 at the Tsinghua University, and by the Yangtze Endowment from the Ministry of Education through the Tsinghua University. Affiliated institutions of Y.Q.L. share the contribution.
References
- \beginrefs
- [1] Andersen V., Owen F. N., 1995, AJ, 109, 1582
- [2] Barger A. J., et al., 2003, AJ, 126, 632
- [3] Boller Th., Bertoldi F., Dennefeld M., Voges W., 1998, A&AS, 129, 87
- [4] Boller Th., Meurs E. J. A., Brinkmann W., Fink H., Zimmermann U., Adorf H.-M., 1992, A&A, 261, 57
- [5] Condon J. J., 1992, ARA&A, 30, 575
- [6] Condon J. J., Anderson M. L., Helou G., 1991, ApJ, 376, 95
- [7] Contini T., Considere S., Davoust E., 1998, A&A, 130, 285
- [8] David L. P., Jones C., Forman W., 1992, ApJ, 388, 82
- [9] Dahlem M., Weaver K. A., Heckman T. M., 1998, ApJS, 118, 401
- [10] de Jong T., Klein U., Wielebinski R., Wunderlich E. W., 1985, A&A, 147, L6
- [11] Devereux N. A., Eales S. A., 1989, ApJ, 340, 708
- [12] Dickey J. M., Salpeter, E. E., 1984, ApJ, 284, 461
- [13] Dopita M. A., Pereira M., Kewley L. J., Capaccioli M., 2002, ApJS, 143, 47
- [14] Fabbiano G., 1989, ARA&A, 27, 87
- [15] Fabbiano G., White N. E., 2003 (astro-ph/0307077)
- [16] Gilfanov M., 2004, MNRAS, 349, 146
- [17] Gilfanov M., Grimm H.-J., Sunyaev R., 2004, MNRAS, 347, L57
- [18] Glass I. S., Moorwood A. F. M., 1985, MNRAS, 214, 429
- [19] Grimm H.-J., Gilfanov M., Sunyaev R., 2002, A&A 391, 923
- [20] Grimm H.-J., Gilfanov M., Sunyaev R., 2003, MNRAS, 339, 793
- [21] Helou G., Soifer B.T., Rowan-Robinson M., 1985, ApJ, 298, L7
- [22] Hummel E., Davies R. D., Wolsencroft J. M., van der Hulst, Pedler A., 1988, A&A, 199, 91
- [23] Inoue A. K. 2002, ApJ, 570, L97
- [24] Kennicutt R. C. J., 1998, ApJ, 498, 541
- [25] Klein U., 1982, A&A, 116, 175
- [26] Leitherer C., Heckman T. M., 1995, ApJS, 96, 9
- [27] Lequeux J., 1971, A&A, 15, 42
- [28] Lou Y.-Q., 1993, ApJ, 414, 656
- [29] Lou Y.-Q., 1994, ApJ, 428, L21
- [30] Lou Y.-Q., Fan Z. H., 2000, MNRAS, 315, 646
- [31] Lou Y.-Q., Fan Z. H., 2003, MNRAS, 341, 909
- [32] Lou Y. Q., Shen Y., 2003, MNRAS, 343, 750 (astro-ph/0304270)
- [33] Lou Y.-Q., Walsh W. M., Han J. L., Fan Z.H., 2002, ApJ, 567, 289
- [34] Lou Y.-Q., Yuan C., Fan Z. H., Leon S., 2001, ApJ, 553, L35 (astro-ph/0105133)
- [35] Lou Y. Q., Wu Y., 2004, MNRAS, submitted
- [36] Lou Y. Q., Zou Y., 2004a, MNRAS, 350, 1220 (astro-ph/0312082)
- [37] Lou Y. Q., Zou Y., 2004b, MNRAS, submitted
- [38] Mouri H., Taniguchi Y., 2002, ApJ, 565, 786
- [39] Persic M., Rephaeli Y., 2002, A&A, 382, 843
- [40] Persic M., Rephaeli Y., Braito V., Cappi M., Della Ceca R., Franceschini A., Gruber D. E., 2004, A&A, 419, 849
- [41] Ranalli P., Comastri A., Setti G., 2003, A&A, 399, 39
- [42] Rieke G. H., Lebofsky M. J., 1979, ARA&A, 17, 477
- [43] Shen Y., Liu X., Lou Y.-Q., 2004, MNRAS, in press (astro-ph/0410658)
- [44] Shen Y., Lou Y.-Q., 2004a, MNRAS, 353, 249 (astro-ph/0405444)
- [45] Shen Y., Lou Y.-Q., 2004b, ApJ, 611, L117 (astro-ph/0407328)
- [46] Spergel D. N., et al., 2003, ApJS, 148, 175
- [47] Stark A. A., et al., 1992, ApJS, 79, 77
- [48] Storchi-Bergmann T., González Delgado R. M., Schmitt H. R., Cid Fernandes R., Heckman T., 2001, ApJ, 559, 147
- [49] Taylor J. R., 1981, An Introduction to Error Analysis. University Science Books, Mill Valley, California
- [50] Tyler K., Quillen A. C., LaPage A., Rieke G. H., 2004 ApJ, 610, 213
- [51] Walter R., Fink H. H, 1993, A&A, 274, 105
- [52] West R. G., Barber C. R., Folgheraiter E. L., 1997, MNRAS, 287, 10
- [53] Wynn-Williams C. G., 1982, ARA&A, 20, 587