STIS ultraviolet/optical spectroscopy of ‘warm’ ultraluminous infrared galaxies
Abstract
We present high spatial resolution ultraviolet and optical spectroscopy, obtained using the Space Telescope Imaging Spectrograph on board the Hubble Space Telescope, of nuclear structures within four ‘warm’ Ultraluminous Infrared Galaxies (ULIRGs). We find an AGN in at least three, and probably all four of our sample, hosted in a compact, optically luminous ‘knot’. In three cases these knots were previously identified as a putative AGN nucleus from multiband optical imaging. Three of the sample also harbor a starburst in one or more knots, suggesting that the optically luminous knots seen in local ULIRGs are the most likely sites of the dust-shrouded starburst and AGN activity that power the infrared emission. The four AGN have a diverse range of properties; two are classical narrow line AGN, one shows both broad and narrow lines and evidence for lines of sight from the narrow through to the broad line regions, and one is plausibly a FeLoBAL AGN. The probable presence in one object of an FeLoBAL AGN, which are extremely rare in the QSO population, supports the idea that LoBAL AGN may be youthful systems shrouded in gas and dust rather than AGN viewed along a certain line of sight. The three starbursts for which detailed constraints are possible show a smaller range in properties; all three bursts are young with two having ages of Myr and the third having an age of 20Myr, suggesting that ULIRGs undergo several bursts of star formation during their lifetimes. None of the starbursts show evidence for Initial Mass Function slopes steeper than about 3.3. The metallicities of the knots for which metallicities can be derived are all at least 1.5. The properties of one further starburst knot are consistent with it being the forming core of an elliptical galaxy. Our results suggest that detailed studies of the ‘knots’ seen in ULIRGs can give important insights into the most violent starburst and AGN activity at both low and high redshift.
1 Introduction
Ultraluminous Infrared Galaxies (ULIRGs, those objects with 1-1000m luminosities in excess of ) were first discovered by Rieke & Low (1972), and have been intensely studied since the discovery by the Infrared Astronomical Satellite (IRAS) of significant populations of ULIRGs in the local Universe (Soifer et al, 1984). Unveiling the power source for the infrared (IR) emission in ULIRGs, thought to be some combination of starburst and AGN activity triggered by ongoing interactions (see Sanders & Mirabel (1996) for a review), is important for two reasons. Firstly, local ULIRGs, although rare, represent the closest examples of the most extreme cases of star formation and black hole accretion in galaxies, and can be used to study in detail how such processes drive galaxy evolution. Secondly, the ULIRG luminosity function shows strong evolution with redshift (Saunders et al, 1990) and deep sub-mm surveys (Hughes et al, 1998; Eales et al, 2000; Scott et al, 2002; Borys et al, 2003) have found that systems with ULIRG-like luminosities are much more numerous at than locally. A detailed understanding of local ULIRGs can therefore give insights into the power source (Rowan-Robinson, 2000; Verma et al, 2002; Farrah et al, 2002b, 2004) and the role of interactions (Farrah et al, 2002a; Chapman et al, 2003; Conselice et al, 2003a, b) in distant IR-luminous sources, and the impact of these sources on the cosmic history of star formation.
After just over three decades of study, a consensus has begun to emerge on the origin of the IR emission in ULIRGs. Early studies using optical spectroscopy showed that some ULIRG spectra resembled those of starburst galaxies (Joseph & Wright, 1985), whereas others contained emission lines characteristic of Seyferts (Sanders et al, 1988a). Radio observations showed direct evidence for dust shrouded starbursts in some ULIRGs (Condon et al, 1991; Smith et al, 1998) and AGN cores in others (Lonsdale et al, 2003; Nagar et al, 2003). Papers based on mid-infrared spectroscopy suggested that most ULIRGs () are powered by starbursts (Rigopoulou et al, 1999; Genzel et al, 1998), but that at least half of local ULIRGs contain both a starburst and an AGN. Results from modelling the 1-1000m spectral energy distributions of local ULIRGs (Farrah et al, 2003) show that all ULIRGs contain a dusty starburst, but that only about half contain an AGN that contributes significantly to the total IR emission. These results are consistent with X-ray observations of small samples of ULIRGs, which indicate that the bolometric emission from most ULIRGs is dominated by starburst activity rather than an AGN (Franceschini et al, 2003; Ptak et al, 2003). There is also evidence that the presence of an AGN in ULIRGs depends on the total IR luminosity; optical and near-IR spectroscopic surveys (Veilleux et al, 1995; Veilleux, Sanders & Kim, 1999) show a sharp rise in the fraction of ULIRGs with AGN signatures with increasing IR luminosity, and mid-IR spectroscopy from ISO (Tran et al, 2001) showed that ULIRGs with were mostly starburst dominated, whereas ULIRGs with were more likely to contain an AGN.
Although we now have a much clearer picture of the role of starbursts and AGN in ULIRGs, few studies have, to date, correlated starburst and AGN activity in ULIRGs with morphological features (as opposed to correlating the power source in ULIRGs with broad scale morphologies, see e.g. Veilleux, Kim, & Sanders (2002)), due mainly to the poor spatial resolution of current mid- and far-IR instruments when compared to the sub-arcsecond scale structures seen in UV/optical images of local ULIRGs. Correlating power source with morphological features in ULIRGs however has the potential to be a powerful probe of their nature and evolution; most ULIRGs display a plethora of tails and loops, and compact ‘knots’ in the nuclear regions (Surace et al, 1998; Farrah et al, 2001; Bushouse et al, 2002), and the ‘knots’ in particular are suggested by some observations as possible sites for the dust-shrouded starburst and AGN activity in ULIRGs (Surace et al, 1998; Soifer et al, 2000).
A subset of the ULIRG population that is well suited to exploring links between morphology and power source are those ULIRGs with ‘warm’ infrared colors ()111The quantities , , & represent the non color corrected IRAS flux densities in units of Janskys at 12m 25m 60m & 100m respectively. This color selection favors ULIRGs that contain dust at temperatures K, which is most plausibly attributed to an AGN rather than a starburst. Coupled with the apparent ubiquity of starbursts in ULIRGs (Farrah et al, 2003), this color selection is likely to include those ULIRGs that contain both a starburst and an AGN, where the interplay between these two processes can be studied in detail. In this paper, we use the Space Telescope Imaging Spectrograph (STIS) on board the Hubble Space Telescope (HST) to obtain long-slit ultraviolet and optical spectra of several ‘knots’ within the nuclear regions of four ‘warm’ ULIRGs. Observations and analysis are described in §2 and results are given in §3. Our conclusions are presented in §4. We assume , and km s-1 Mpc-1. Luminosities are quoted in units of bolometric solar luminosities, where Watts.
2 Observations & analysis
We selected for observation ULIRGS from the sample with ‘warm’ mid-infrared colors imaged in the optical using the Wide Field Planetary Camera 2 (WFPC2) on board HST by Surace et al (1998) and with adaptive optics by Surace & Sanders (1999). This imaging demonstrated the presence of compact (100 pc) high surface brightness features in the galaxy cores. Furthermore, these ‘warm’ systems show evidence for Seyfert activity, which led Sanders et al (1988a) to postulate that these were objects transitioning between the general ULIRG population and optically selected quasars. Increasing central concentration in the infrared, as well as optical colors and luminosities, led Surace et al (1998) and Surace & Sanders (1999) to further identify some of these knots as possible active nuclei.
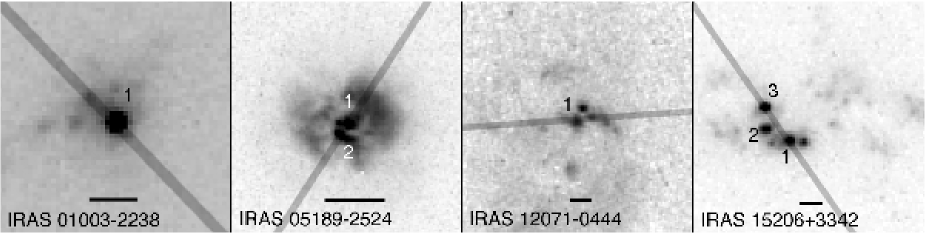
The four objects that were observed (Table 1) span a range in properties, including both red (F12071-0444) and blue (F01003-2238) colors, simple (F01003-2238) and complex (F15206+3342) nuclear morphologies, single (F01003-2238, F12071-0444) and double (F05189-2524) nucleus systems, and HII, Sy 2, and Sy 1.5 spectral types. The data were taken in cycle 8 (proposal ID 8190) with STIS in longslit spectroscopy mode on board the HST. Three spectra were taken of each object, with the slit and the G140L, G470L and G750L gratings, providing coverage over the wavelength ranges 1000Å - 1700Å and 3000Å - 10000Å in the observed frame. Spatial resolutions are 0.024 arcseconds pixel-1 for the UV spectra, and 0.05 arcseconds pixel-1 for the optical spectra. Spectral resolutions are a FWHM of 1.5 pixels at 1500Å for the G140L grating, 1.3 pixels at 3200Å for the G430L grating, and 1.6 pixels at 7000Å for the G750L grating.
In all cases the slit was centered on the putative nucleus whose luminosity and color were consistent with an obscured AGN (Surace et al, 1998), and oriented so it also covered one or more off-nuclear ‘knots’, if such knots were present. In Figure 1 we present the WFPC2 images of our sample, with the STIS slit positions superimposed. In Table 2 we list the magnitudes and radii of these knots, together with the stellar masses inferred by Surace et al (1998) under the assumption that all of the B and I band flux is stellar in origin. The total exposure times were 5500s for the G140L spectra, 2700s for the G470L spectra, and 1750s for the G750L spectra. Each observation was split into three or more exposures dithered with integer pixel shifts to allow the removal of cosmic rays and bad pixels.
Individual exposures were reduced using the automated calstis pipeline at the STScI and the latest calibration files available as of January 2004. The exposures were then combined into a single image using the Image Reduction and Analysis Facility (IRAF) task ocrreject. Spectra were extracted using apertures corresponding to the same physical size in the UV and optical for each object. For F01003-2238, F12071-0444 and F15206+3342, apertures of width 3 pixels for the optical spectra and 7 pixels for the UV spectra were used, corresponding to a size of approximately 350pc. For F05189-2524, where the two knots covered by the STIS slit lie pc from each other, apertures of width 5 pixels for the optical spectra and 11 pixels for the UV spectrum were used, corresponding to a smaller physical size of approximately 220pc.
Line profiles and errors were measured using the specfit package within IRAF. This package can fit a wide variety of emission profiles, absorption profiles and continuum shapes to an input spectrum, and can disentangle multiple blended lines. The fitting itself was carried out via minimization, using a combination of Levenberg-Markwardt and Simplex algorithms. Input parameters for specfit were determined using the IRAF task splot.
To deredden the UV spectra the color excess of the ionized gas, was derived from the observed and (assumed) intrinsic Balmer decrements:
| (1) |
where intrinsic Balmer decrements of 2.85 and 3.1 were assumed, corresponding to heating by stars and an AGN respectively. This color excess was then converted to the reddening of the stellar populations via (Calzetti, 2001):
| (2) |
The extinction at some wavelength , , can then be computed using the prescription given by Leitherer et al (2002):
| (3) |
This formula is valid over the wavelength range . The optical spectra were dereddened using the prescription given by Cardelli et al (1989)222This paper also presents a prescription for dereddening UV spectra at wavelengths as small as 0.1m, however their far-UV segment is derived using limited data, and therefore we do not adopt their prescription.
Line Full Widths at Half Maximum (FWHM) were corrected for the effects of finite instrument resolution using the quadrature method, where:
| (4) |
This method assumes that the real and instrument profiles are Gaussians, and therefore gives line widths that are systematically too high for profiles that are more peaky than Gaussians. As such peaky line profiles are known to be present in AGN (Veilleux, 1991), the discussion of line widths in this paper should be regarded with caution.
3 Results
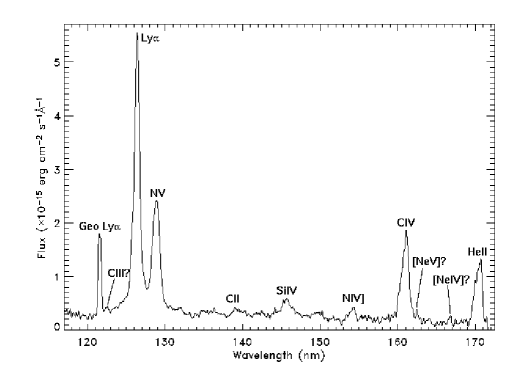
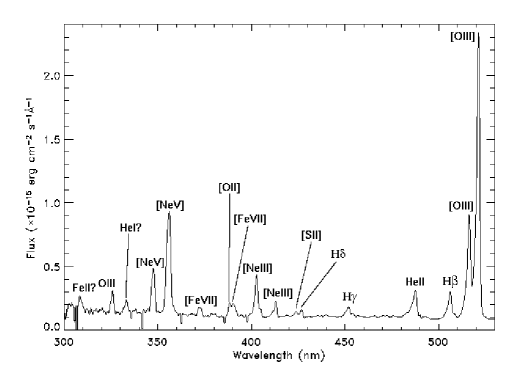
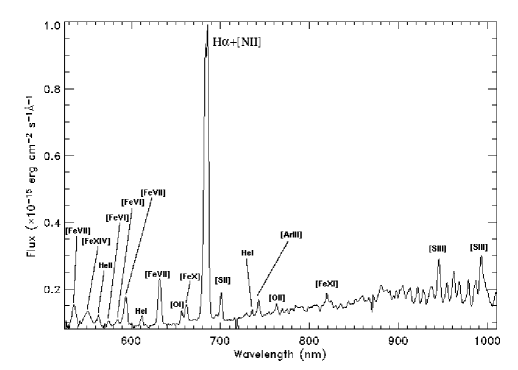
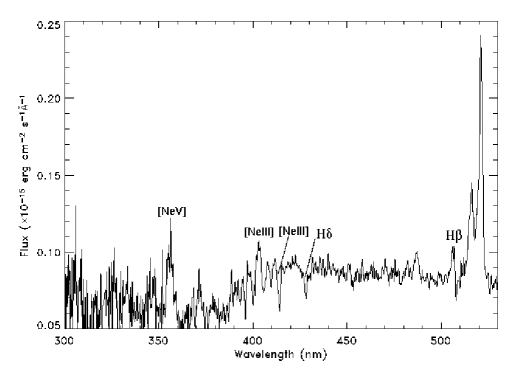
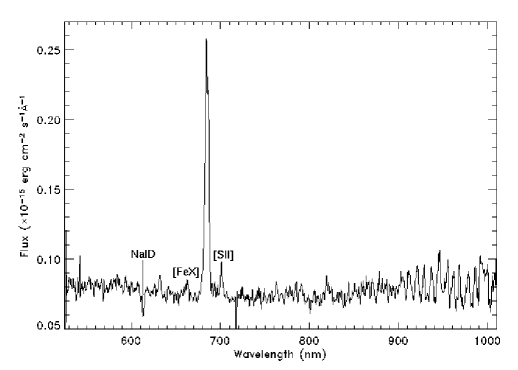
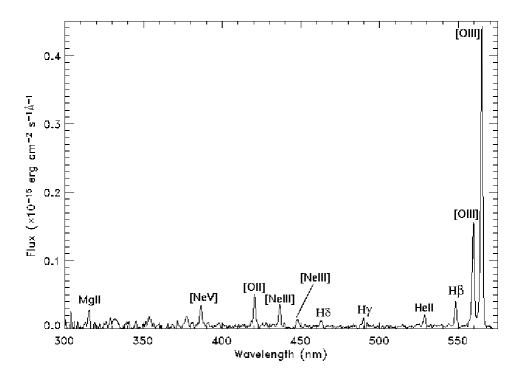
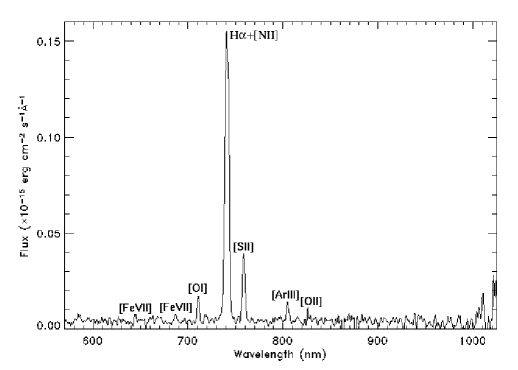
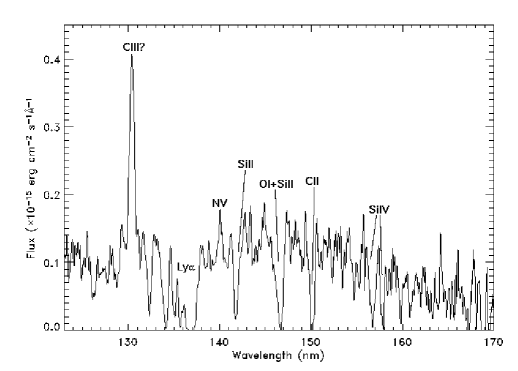
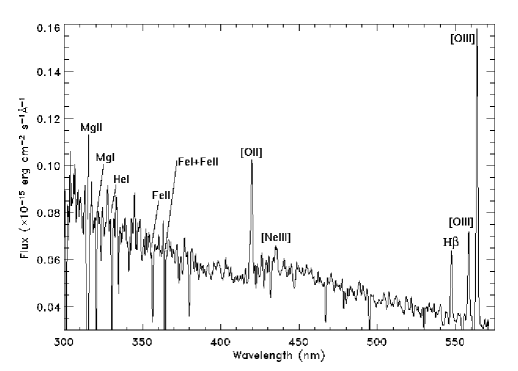
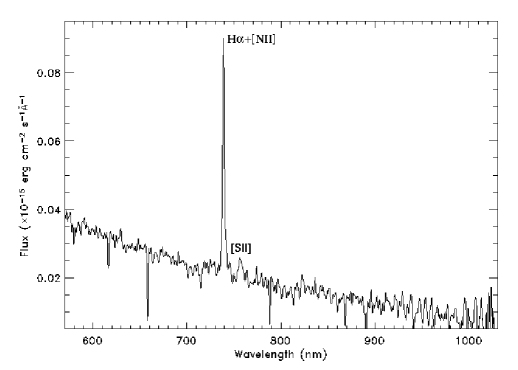
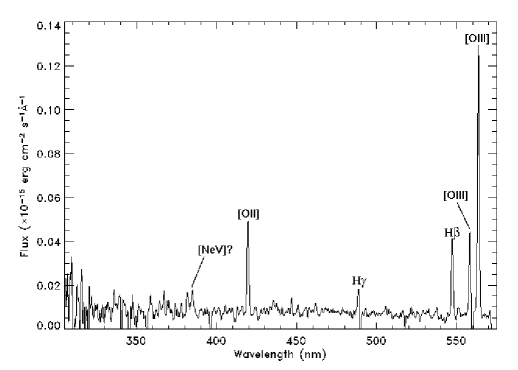
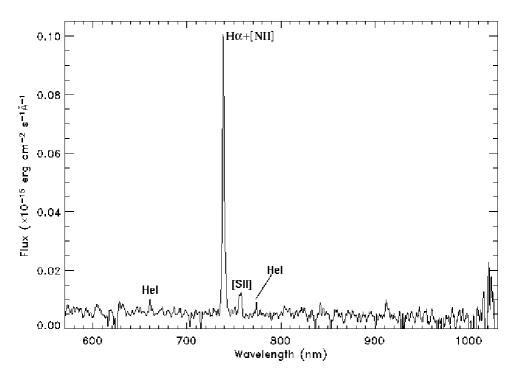
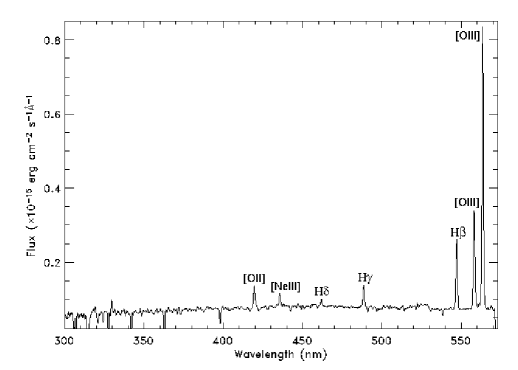
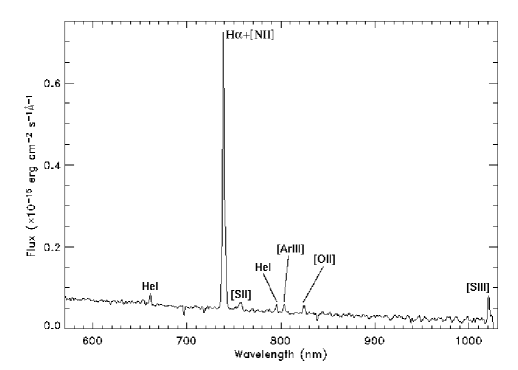
The UV and optical spectra for each ULIRG are presented in Figures 2, 3, 4, 5, 6, 7 & 8. The UV and optical emission line fluxes are presented in Tables 3 & 4 respectively. Widths of selected emission lines are given in Table 5.
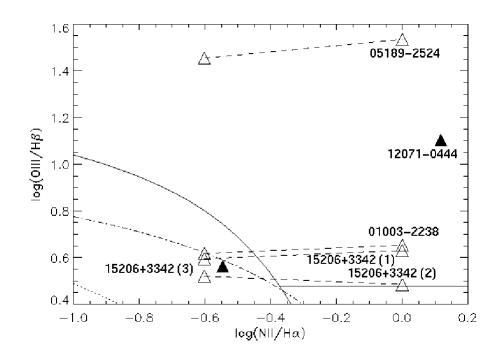
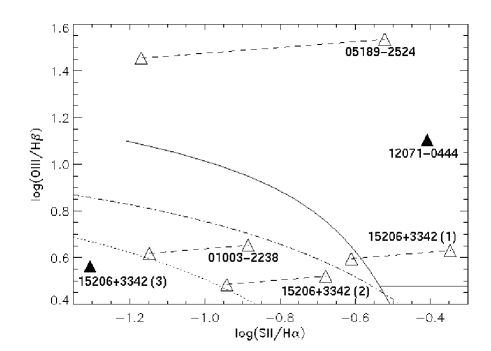
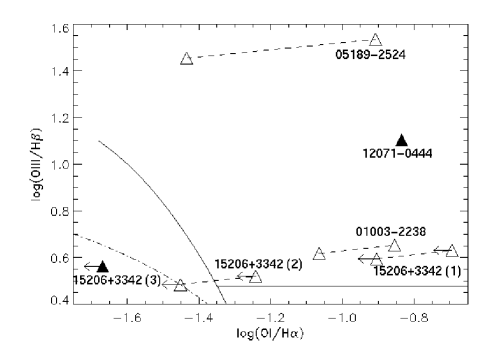
All of the spectra show at least two emission lines, while a few also show absorption lines. These lines are a powerful tool in determining physical conditions in the ionized gas in our sample. In the optical, diagnostics using the stronger emission lines can be used to constrain the temperature, density and kinematics of the hot gas in galaxies. In this paper we have used the three line ratio diagnostics presented by Veilleux & Osterbrock (1987) as the primary method to distinguish between HII and AGN spectra; [OIII] H vs. [NII] H, [OIII] H vs. [SII] H, and [OIII] H vs. [OI] H. For those spectra classified as AGN we adopt the definition that a LINER is an AGN with log([OIII] H. For those spectra classified as HII regions we have used the theoretical upper limits on these line ratio diagnostics for both continuous star formation (Kewley et al, 2001a) and instantaneous bursts (Dopita et al, 2000). All of these diagnostics are presented in Table 6, and plotted in Figure 9. We supplemented these with two additional diagnostics; [OIII] H vs. [OII] /[OIII] (Baldwin, Phillips & Terlevich, 1981) and [OIII] H vs. [OII] H (Osterbrock, Tran & Veilleux, 1992).
Spectroscopy in the ultraviolet, despite suffering significant extinction uncertainties, is the best way of directly studying the hottest, youngest stars, as at wavelengths longward of 3000Å features from these stars are weak, and are often blended with nebular emission lines. The shapes of the stronger UV lines can be used to distinguish between starburst and AGN activity and shocks vs. photoionization, and determine parameters for the stellar initial mass function (IMF). Here we have analysed the UV spectra of our sample using both UV line ratio diagnostics, and modelling using the spectral synthesis package Starburst99 v4.0 (Leitherer et al, 1999).
In the optical, star formation rates are commonly estimated using the fluxes of recombination lines, particularly H, calibrated using spectral synthesis models (see Kennicutt (1998) for a review). Though the scatter in the calibration can be up to 30, due to differences between spectral synthesis models, this method has the advantages of high sensitivity, and direct coupling between the H flux and the (massive) star formation rate. The primary disadvantage, for the purposes of our study, is that the H flux from stars must be disentangled from the nebular [NII] lines, and from any broad H line arising from an AGN. In most cases it was not possible to reliably isolate the H flux arising from star formation (with errors of a factor of two or more, see §§3.1 - 3.4 for more details); we have therefore, for consistency, estimated optical star formation rates for all objects using the extinction corrected luminosity of the [OII] line, and the prescription presented by Kennicutt (1998):
| (5) |
where the SFR is in units of yr-1 and L[OII] is in units of ergs s-1. The luminosity of [OII] is sensitive to the metallicity and ionization state of the gas in the narrow line region, and the calibration for [OII] as a star formation rate indicator is derived empirically through relationships derived for H. The errors on the star formation rates from Equation 5 are therefore at least 30%, and these star formation rates should therefore be regarded with caution. We also emphasize that, for those ‘knots’ that contain an AGN, the star formation rates derived using Equation 5 should be regarded as upper limits.
Where possible, we estimated electron densities and temperatures using the IRAF task temden. The commonly used line ratios for estimating electron temperatures are [OIII] / [OIII] and [NII]/[NII], however [OIII] and [NII] are not detected in any galaxy of our sample. Electron temperatures were therefore estimated using the line ratio [OII] / [OII] . To estimate electron densities we used the [SII] / [SII] line ratio, though this was only possible in a few cases due to the blending of the two [SII] lines.
3.1 IRAS F01003-2238
3.1.1 Background
This object contains a single nucleus embedded in a small halo of extended emission, with a series of small blue knotlike features extending to the north-west (Surace et al, 1998). A serendipitous observation of this object by ROSAT did not detect any X-ray emission, and gave a upper limit to the soft X-ray luminosity of ergs s-1 (Stevens & Strickland, 1998). Previous efforts to identify the power source in this galaxy have produced conflicting results. An early study by Armus, Heckman & Miley (1988), using ground-based spectroscopy of the whole galaxy, identified several features characteristic of Wolf-Rayet stars (HeII , HeI , and tentatively NIII CIII , NIV , and several features around 7900Å, though see also Conti (1991)), and concluded that this galaxy contains approximately WN-type Wolf-Rayet stars, consistent with results from 2-D spectroscopy (Wilman, Crawford & Abraham, 1999). Surace et al (1998) however postulate that the central nucleus is an AGN, based on its position in optical colour-colour plots, and mid-infrared spectroscopy suggests that the IR emission is not dominated by a starburst (Tran et al, 2001). Near-infrared spectroscopy (Veilleux, Sanders & Kim, 1997) however shows no evidence for a hidden broad line region.
3.1.2 Emission & absorption line properties
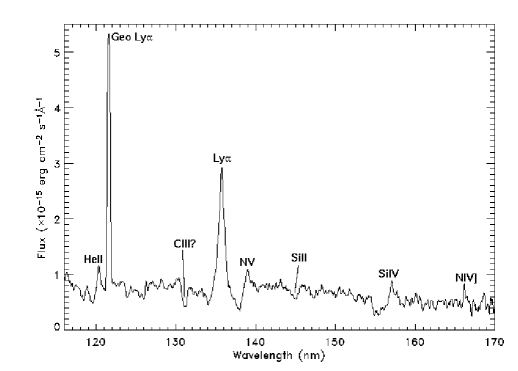
The data show a single, bright spectrum in the UV and optical bands. In the UV spectrum Ly emission is present, together with weaker emission lines of NV , SiIV , and NIV] . There are also a number of absorption systems, and weak, but distinct PCygni profiles on the SiIV doublet and NV lines, which imply winds from O supergiants. The SiIV doublet is commonly seen in O star photospheres, however the NIV] line is only seen in winds from W-R stars. We also clearly detect the Wolf-Rayet star signature triplet NIII (which may be blended with CIV ). We do not however detect the ‘bump’ between 7875Å and 7965Å claimed by Armus, Heckman & Miley (1988). This could indicate either that this feature does not exist, or that it is produced outside the nuclear region. The B band spectrum contains the [NeV] line, which is thought to originate in AGN. The emission lines in the UV and optical spectra are spatially symmetric with respect to the continuum, with extents of 550-600pc for the Ly and stronger optical lines, and pc for the high ionization UV lines (for F01003-2238 one pixel in the UV frame corresponds to 55pc and 1 pixel in the optical corresponds to 110pc). The line profiles of H and [OIII] are also symmetric, and show no blue wings. This is at odds with ground-based spectra (Armus, Heckman & Miley, 1988; Veilleux, Sanders & Kim, 1999; Lipari et al, 2003) which show a double peaked profile on H and [OIII], with an inferred outflow velocity of km s-1. As our spectra are of comparable spectral resolution, we would expect to see these wings, if they are present. The implications from this are discussed in §3.1.4. The ground-based spectra also show a flat continuum, whereas our optical spectra are very blue; this difference can be ascribed to our spectra targeting only the active nuclear regions rather than the whole galaxy.
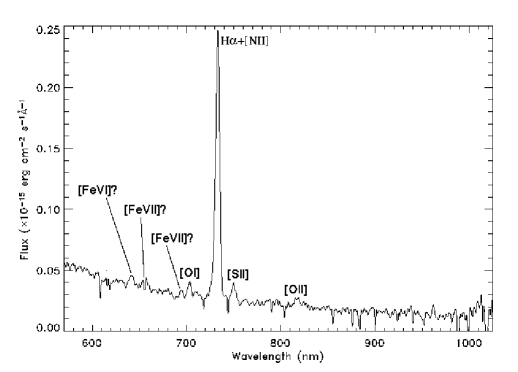
Three lines in the I band spectrum, at (observed-frame) 6416Å, 6535Å and 6941Å, proved difficult to identify reliably. The line at 6941Å has no plausible IDs at the systemic redshift (z=0.117). This line could be [FeVII]6087, but this implies a velocity shift of km s-1 relative to systemic (or a redshift of z=0.141). This shift is, to our knowledge, at least 3000km s-1 larger than the shifts seen for this line in any other galaxy. Adopting this same shift, then the features at 6416Å and 6535Å would be identified as [FeVI]5632 and [FeVII]5721 respectively. In this circumstance the required ratio is also satisfied. Equally plausible IDs for the features at 6416Å and 6535Å however are CIII5696 and CIV5808 respectively, both signatures of WC type Wolf-Rayet stars. In this case the implied velocity shift is a perfectly reasonable km s-1 (or a redshift of z=0.125). Finally, plausible IDs for the features at 6416Å and 6535Å at the systemic redshift are [NII]5756 and HeI5876.
These three lines at 6416Å, 6535Å and 6941Å present a conundrum. All three can be identified as high excitation iron lines at the same redshift, but the implied velocity shift is barely believable. Two of the three features can also be identified as lines characteristic of WC type W-R stars, which is consistent with the other W-R star signatures seen in the UV and optical spectra. These same two lines can also be identified as commonly seen emission lines at the systemic redshift. Given this uncertainty, any conclusions we draw are uncertain. Barring a plausible alternative for the feature at 6941Å we tentatively conclude that this feature is [FeVII]6087. This implies that the other two feature may be due at least in part to high excitation iron lines, but the presence of NIII also implies that they could be due to W-R stars. Without higher spectral resolution data, we can only adopt the most conservative conclusions; the line at 6535Å we conclude is a blend of [FeVII]5721, CIV5808 and HeI5876, and the feature at 6416Å we conclude is a blend of [FeVI]5632, CIII5696 and [NII]5756.
A careful search for the more common stellar absorption features (Ca(H)3934 and Ca(K)3968; the ‘G’ band feature at 4250Å due to CN and CH; Mg I 5176,5200; Na I, dTiO 6180,7100,7700; CaII 8542) revealed only weak G band absorption, and a possible absorption feature from CaII 8542. Their weakness or absence in these spectra is not unexpected; our observations only include the small part of the host galaxy that lies along the line of sight to the nucleus, and these features are known to be diluted by either an AGN power-law continuum, or the continuum from hot young stars.
3.1.3 Wolf-Rayet stars
The presence of W-R star spectral features allows us to set limits on the stellar populations within the nuclear regions (see e.g. Schaerer & Vacca (1998)). Armus, Heckman & Miley (1988) postulate, based on the comparable strength of the NIII lines and the HeII line, and the absence of NV and CIV , that the W-R stars in F01003-2238 are mainly WN stars, with relatively few WC stars. Our spectra are consistent with the presence of a large population of WN stars, but for the reasons given in §3.1.2 we cannot draw reliable conclusions about the presence or otherwise of WC stars solely on the basis of line identifications. Our spectra however do not show the oxygen lines that are characteristic of WO stars (OIV , OVI , Barlow & Hummer (1982)). We therefore conclude that at least some of the WR stars in the nucleus of F01003-2238 are of the WN subtype, with some unquantified fraction being WC stars. Concerning ourselves solely with the WN stars, then identifying the subtype of WN star is difficult. Again based on the relative strengths of the HeII line and the NIII ‘bump’ at 4600Å, we postulate that the WN stars in F01003-2238 are probably late type (i.e. WNL stars), in agreement with Armus, Heckman & Miley (1988), though higher spectral resolution data to resolve the NIII lines would be required to confirm or refute this.
With an identified WR star subtype, the number of WR stars can be estimated, as can the ratio of the number of WR stars to the number of O stars (strictly speaking the number of O stars of sufficient mass to evolve into WR stars, typically ). We here assume, solely for the purposes of deriving , that all the W-R stars are WNL stars. In the solar neighborhood, , a value consistent with continuous star formation. Higher values of can only be accommodated if the star formation happens in short duration bursts, or if the metal abundance is above Solar. The number of WNL stars can be estimated using the flux of the HeII line (Vacca & Conti, 1992), assuming that all of the HeII flux is due to WNL stars. Taking the HeII luminosity of a single WNL star to be ergs s-1, then for our spectra this gives or WNL stars for intrinsic Balmer decrements of 2.85 and 3.1 respectively. Computing the ratio of WNL stars to O stars is more complex. The prescription given by Vacca & Conti (1992) for local W-R galaxies assumes pure case B recombination, and a single effective temperature and electron density. The maximum value of L/Lobs(H from Vacca & Conti (1992) is 0.21, corresponding to excitation purely by WNL stars, whereas our derived value is 0.24. We therefore conclude that our initial assumption is not valid, and that F01003-2238 contains a significant number of WC stars in addition to the WN stars. Given the uncertainties in reddening introduced because the H and [NII]6548,6583 lines could not be resolved, and the probable presence of an AGN (§3.1.4), reliable estimates of the ratio of W-R stars to O stars are not possible without higher spectral resolution data. Nevertheless, our results imply at least 105 W-R stars in the nucleus of F01003-2238, and a value of that is substantially higher than in the Solar neighborhood; this is supportive of a ‘burst’ rather than continuous star formation.
3.1.4 Analysis
The I-band spectrum lacks the spectral resolution to reliably deblend the and [NII] lines, with variations in the derived flux of up to a factor of 3 depending on the initial line parameters input to Specfit. We therefore adopted two canonical values for the [NII] line ratio, [NII] (corresponding to an AGN) and [NII] (corresponding to an HII spectrum), and derived line ratio classifications. In both cases, the diagnostics, presented in Table 6 and Figure 9, are ambiguous. Other diagnostics do not clarify matters; the [OIII] vs. [OII] /[OIII] diagnostic classifies the spectrum as an HII region, and the [OIII] vs. [OII] diagnostic classifies the spectrum as an AGN, irrespective of the assumed intrinsic Balmer decrement. The extinction corrected star formation rate derived using Equation 5 is M⊙ yr-1 and M⊙ yr-1 for assumed intrinsic Balmer decrements of 2.85 and 3.1 respectively.
The [SII] and lines could not be deblended in this object, hence we only present an estimate of the electron temperature in the narrow line region. For an assumed intrinsic Balmer decrement of 2.85 the [OII] / [OII] ratio is 8.11, whereas for an intrinsic Balmer decrement 3.1 the ratio is 1.7. For a ratio of 1.7, the electron temperatures are K, K, and K for assumed electron densities of cm-3, cm-3 and cm-3 respectively. For a ratio of 8.11, the electron temperatures are lower, at K, K and K for assumed densities of cm-3, cm-3, and cm-3 respectively. This indicates that the narrow line region in F01003-2238 does not contain particularly dense gas, and that shock heating does not play a significant role. The detection of the [OII] line is however marginal, at ; these results should therefore be regarded with caution.
The clear signatures of massive star formation in the UV spectrum allow us to examine the starburst activity in F01003-2238 in detail. We have modeled the UV spectrum using the Starburst99 v4.0 spectral synthesis code (Leitherer et al, 1999) using model parameters spanning the following ranges; the mode of star formation (i.e. continuous or a ‘burst’), a starburst age of between 1Myr and 100Myr, an initial mass function slope of between 2 and 30, and a lower stellar mass limit of between 0.1M⊙ and 8M⊙. The following analysis assumes that the star formation in F01003-2238 can be described by a Salpeter IMF, and that the stellar evolutionary tracks used by Starburst99 are applicable. The dereddened UV spectrum, together with the best-fit Starburst99 model, are plotted in Figure 11. The W-R star lines, together with the strong PCygni profile on the NV line and SiIV doublet, provide strong constraints on the starburst age, limiting the age to 3-4Myr (corresponding to the time taken for a 40M⊙ O star to evolve into a W-R star). A ‘burst’ of star formation is also favored over continuous star formation. The youth of the starburst makes constraining the lower stellar mass limits difficult; we found that the data were consistent across the whole 0.1M⊙ to 8M⊙ range. Constraints can however be set on the slope of the IMF: the PCygni profiles, together with the CIII 1175 absorption feature, require an IMF slope of 3.3 or less. IMF slopes steeper than about 3.3 predict weak or no PCygni profiles or absorption troughs in young starbursts, and can be excluded. There are however two significant differences between the observed spectrum and the best-fit model. Firstly, the Ly emission seen in the spectrum is not in the model, as Starburst99 models younger than about 10Myr in general show Ly in absorption. As the Ly line is broad, with a corrected FWHM of km s-1, we attribute this line to an AGN rather than the starburst (though we note that this width is only slightly over the ‘official’, but entirely arbitrary lower limit for line widths in broad line regions of km s-1). A corollary to this is that, if high excitation iron lines are present in the I band spectrum, then this would also indicate the presence of an AGN (a full discussion of possible origins of the ‘coronal’ iron lines is presented in §3.2). Secondly, the SiII1260 and CII1335 lines seen in the model are not seen in the spectrum. We attribute this to a combination of lack of instrumental resolution, and dilution from the AGN continuum.
The non-detection of blue wings on the H and [OIII] lines is intriguing, given that such wings are clearly detected in lower resolution ground based spectra. The simplest conclusion would be that these blue wings do not exist, however they were detected in two independent ground-based measurements (Armus, Heckman & Miley, 1988; Lipari et al, 2003). This apparent conflict is best explained in terms of different apertures; the STIS spectra cover only the central 350pc, whereas the ground-based spectra cover 2kpc or more. If the blue wings seen in the ground-based spectra are interpreted as evidence for an outflow, then two possibilities exist. The first is that the outflow does not originate in the nucleus. We cannot discount this possibility, however we consider it unlikely. The outflow found in the ground-based spectra is almost certainly driven by a starburst or AGN (the other possibility being that it is a dynamical relic from the merger); we expect starbursts and AGN to be triggered in the nuclei of ULIRGs, and F01003-2238 is a single nucleus system. The second possibility is that this wind was generated some time ago, and that the STIS aperture only covers a small part of the wind. Taking a mean velocity of 1000km s-1 and assuming a distance of 500pc then this implies that the wind was initiated around 500,000 years ago.
3.2 IRAS F05189-2524
3.2.1 Background
This object is classified as a late-stage merger from WFPC2 and ground-based imaging (Surace et al, 1998; Veilleux, Kim, & Sanders, 2002). Ground based observations show a Sy2 spectrum (Veilleux et al, 1995), and what appears to be a single, very red nucleus bisected by a dust lane (Surace & Sanders, 1999; Scoville et al, 2000). The presence of an obscured AGN was confirmed both by the observations of broad lines in polarized flux (Young et al, 1996), and in direct light (Veilleux, Sanders & Kim, 1999). Later observations (Dudley, 1999) observed the m dust feature, suggesting that this object also contains an obscured starburst. The 2-10KeV X-ray spectrum (Risaliti et al, 2000) is well fit by a two-component model, consisting of a power law with , absorbed by a column density of cm-2, and a thermal component with kT = keV. The power law component can be interpreted as arising from a Compton thin AGN, with the thermal component either due to the AGN or to starburst activity. Results from fitting the m spectral energy distribution of this object (Farrah et al, 2003) found that both a starburst and an AGN were required to explain the infrared emission, with the starburst as the major contributor. Conversely, recent X-ray observations (Imanishi et al, 2003) suggest that the starburst is not energetically dominant, with the AGN as the probable source of most of the bolometric emission.
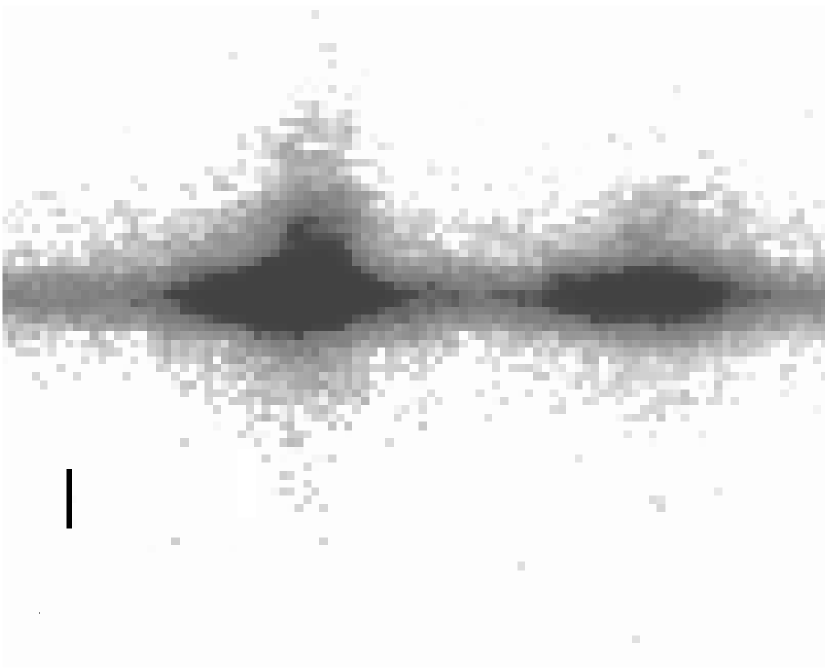
As shown in Figure 1 the STIS slit was placed across both bright regions in the center of F05189-2524. Consequently, two spectra are visible in the STIS image, which are discussed in the following subsections.
3.2.2 Knot one
Emission line properties This knot is the brighter of the two in both the UV and the optical. In the UV several strong emission lines can be seen, including Ly and CIV. Several weaker emission lines are also present, including NIV] . This line is not seen in AGN, including composite QSO spectra (Vanden Berk et al, 2001) and is thought to originate in winds from Wolf-Rayet stars. None of the UV lines show PCygni profiles or evidence for absorption. The Ly line is spatially extended, and asymmetric with respect to the continuum, whereas the spatially compact higher ionization lines, including NV1240, show no asymmetry (Figure 10). Asymmetry is also seen in the H, H and [OIII] lines. The spatial extent of the Ly, H, H and [OIII] lines is approximately 450 - 500pc, whereas for the higher ionization UV lines the spatial extent is 250 - 300pc. The asymmetric region on the Ly and optical lines is pc across (for F05189-2524 the STIS pixel scale is pc pixel-1 in the UV and pc pixel-1 in the optical). We interpret this region as evidence for asymmetry in the ionized gas in the nuclear regions, possibly a sign of a late stage merger. In the UV the line widths are broad, with a corrected Ly FWHM of 2175km s-1. In the optical both a narrow and broad component can be seen on the H line. None of the optical or UV lines show blue wings, though the broad components of H and [OIII] show a systematic blueshift compared to the other optical lines, corresponding to a velocity of 300-600 km s-1 for H and 900-1200 km s-1 for [OIII]. The widths of the ‘narrow’ lines are broad, with corrected FWHMs of order 1000 km s-1. No W-R star features are visible in the optical spectra.
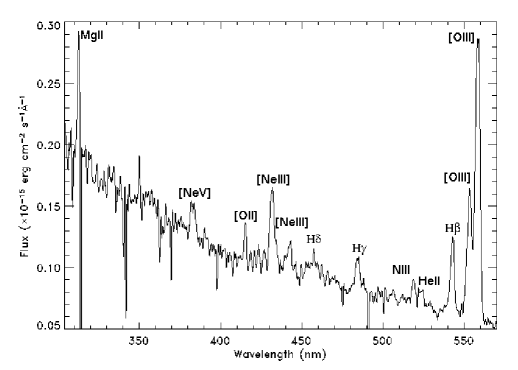
In addition to the standard emission lines (Figure 3 and Table 4), three features are present in the B band spectrum between 3050Å and 3350Å that are not commonly seen in starburst or AGN spectra. The features at Å are most likely to be FeII multiplets; as they lie at the extreme edge of the spectrum we do not consider them further. The line at 3250Å we identify as the OIII resonance-fluorescence line. Our reasoning is as follows. Adopting a redshift based on the Ly line gives a rest-frame wavelength for this feature of 3131Å, which is the same within the errors as the wavelength of the strongest of the Bowen resonance-fluorescence lines of OIII, at 3133Å . The OIII resonance-fluorescence lines are created in nebulae via excitation from HeII Ly photons with rest-frame wavelength 303.8Å (Osterbrock, 1989), so there is a physical motivation for adopting a redshift based on the UV lines rather than the optical lines. The OIII 3133 line is also seen in composite QSO spectra (Vanden Berk et al, 2001). Finally, we identify the line at 3333Å as being the HeI 3189Å triplet.
High excitation iron lines A number of high excitation iron lines, listed in Table 7, are present in the optical spectra. These lines show a systematic blueshift, corresponding to a velocity of km s-1, and include the very high ionization states [FeX] 6375, [FeXI] 7892 and, remarkably, [FeXIV] 5303 (which may be blended with [CaV] 5309). The [FeX]-[FeXIV] lines are usually only seen in spectra of local supernova remnants, and in the Solar corona (hence their description as ‘coronal’ lines), and are rare in extragalactic objects. To our knowledge, only two other galaxy spectra show a direct detection of [FeXIV]; III ZW 77 (Osterbrock, 1981) and MCG-6-30-15 (Reynolds et al, 1997).
Two possible origins have been proposed for these coronal iron lines: (1) they originate in a ‘Coronal Line Region’ (CLR) intermediate in distance between the broad and narrow line regions (Penston et al, 1984), (2) they are generated in the ISM several kpc from a ‘naked’ Seyfert nucleus (Korista & Ferland, 1989). The second of these possibilities makes predictions regarding relative line luminosities (assuming solar metallicity). Specifically, this model predicts that [NeV] 3426 will have a comparable line width to [FeX], and be 12 times stronger, and makes further predictions for the ratio of the luminosities of the iron lines to the luminosity of the narrow component of H. While the widths of [FeX] and [NeV] 3426 are comparable (2100600km s-1 vs. 2500800km s-1), [NeV] 3426 is approximately 40 times stronger than [FeX] (we corrected the [FeX] 6375 flux from contamination from [OI] 6364 by assuming [OI] /[OI] ). Furthermore, the L([FeX])/H, L([FeXI])/H and L([FeXIV])/H ratios predicted by Korista & Ferland (1989) and those in our spectra all differ by factors of between 2 and 30, depending on the assumed Balmer decrement. The first of the models predicts that these iron lines may show a shift (blue or red) compared to the systematic redshift of the system, and that the FWHMs of the iron lines will be intermediate between the forbidden lines and the broad components of the permitted lines. Both these criteria are met, hence we conclude that the high excitation iron lines in F05189-2524 originate in a CLR between the narrow and broad line regions.
Under the assumption that these high excitation iron lines are produced in photoionized gas (rather than shocks in radio jets), then the lines can be used to constrain the temperature and density of this gas within a few pc of the central ionizing source. The detection of [FeXIV] implies (Ferguson, Korista & Ferland, 1997) a range in Hydrogen column density of log n(H)(cm, and a peak electron temperature of K. The detection of this line also implies that we have a line of sight to regions very close to the central ionizing source; if the hydrogen column density range and electron temperature are correct then [FeXIV] is expected to be produced only within pc of the broad line region.
Analysis The complex lines of sight to the AGN intimated by the presence of the high ionization iron lines makes deriving reliable optical line diagnostics complex. The line cannot be reliably fitted with more than a single Gaussian and single Lorentzian component. Attempts to fit the line with more than a single component were similarly unsuccessful; when a broad and narrow component were simultaneously fitted then the flux of the broad component varied by , whereas the flux of the narrow component varied by up to an order of magnitude, depending on the values of the input parameters to specfit. We therefore assumed, solely for the purposes of deriving line diagnostics, [NII] (narrow) = 1.0. For the line we used only the Gaussian component when measuring the [OIII] . The flux we used is thus likely too low as it does not include any contribution from a narrow Lorentzian component. The value of log([OIII] ) plotted in Figure 7 is thus probably too high, and indeed a value of 1.56 is higher than any other published AGN. This overestimate however should not affect the classification. The three primary line ratio diagnostics all classify this object as an AGN, as do the [OIII] vs. [OII] /[OIII] and [OIII] vs. [OII] diagnostics. Furthermore, as the I band spectrum shows the [SIII] lines we were able to employ the [SIII] vs. [OII] diagnostic described in Osterbrock, Tran & Veilleux (1992), which also classifies this spectrum as an AGN.
With an assumed intrinsic Balmer decrement of 3.10, the extinction corrected star formation rate derived using Equation 5 is M⊙ yr-1; this should of course be regarded as an upper limit due to the presence of an AGN. The [SII] & [SII] lines could not be reliably deblended in this object, hence we only present an estimate of the electron temperature in the narrow line region. For an assumed intrinsic Balmer decrement of 3.1 the [OII] / [OII] ratio is 16.98, which predicts an electron temperature of K for an assumed electron density of cm-3, and K for an assumed electron density of cm-3.
The strong, broad emission lines in the UV spectrum evidently arise from an AGN, however the analysis we could perform was limited, for two reasons. Firstly, most emission line diagnostics for the ionizing source in the narrow line region of AGN use one or both of the OVI and CIII] 1909 lines (Hamann & Ferland, 1999), and both these lines lie outside the G140L bandpass at . Secondly, due to the limited spectral resolution of our data it proved impossible to separate the broad and narrow components of most of the emission lines in the UV; the only line this was achieved for was CIV 1549 and even in this case the 1 errors on the resulting widths and fluxes were . We therefore first used the [OIII]/H vs. [NeV]3426/[NeIII]3869 diagnostic (Allen, Dopita & Tsvetanov, 1998) to distinguish between shocks and photoionization, which implied a photoionizing continuum with . We then used the NIV]/CIV diagnostic presented by Hamann et al (2002) and the total CIV1549 flux, to derive a lower limit to the metallicity, which gave log.
Overall, F05189-2524 knot 1 clearly contains an AGN, based on both the line shapes in the optical and UV and the optical line diagnostics. Furthermore, we have a line of sight very close to the central regions of this AGN, based on the broad component on H and the detection of the high excitation ‘coronal’ iron lines. Although there are no unambiguous signs of a starburst in the optical spectra, the presence of NIV] 1488 in the UV suggests a large population of W-R stars, implying that a young (3-4Myr) starburst is also present.
Finally, we note that an interesting experiment would be to measure the polarization of the high-ionization lines found in this spectrum. The broad components found on the H and H lines in our spectra, and results from previous authors (Young et al, 1996; Veilleux, Sanders & Kim, 1999) imply that the BLR in this knot is moderately, though not completely, obscured. As the distance of the source of the high-excitation iron lines from the BLR is predicted to decrease with increasing ionization stage (Ferguson, Korista & Ferland, 1997), the relative polarizations of these lines would be an interesting diagnostic of the change in obscuration as a function of distance from the BLR.
3.2.3 Knot two
This knot is fainter than knot one, and is not detected in the UV. Due to the spatially extended emission lines in knot 1, which contaminate most of the key diagnostic lines in knot 2, little quantitative information can be derived. Nevertheless, a simple comparison of the optical spectra of knots 1 and 2 shows two clear differences. Knot 2 shows a distinct Balmer break and Na ID 5896 absorption, neither of which is seen in knot 1. Furthermore, knot 2 does not show the HeII 4686 line; based on the H and [NeIII] 3869 fluxes of the two knots we would have expected to detect HeII 4686 in knot 2, if it were present. We speculate that knot 2 has a higher obscuration level than knot 1, and somewhat lower ionization, though our data do not allow us to quantify this. Overall, the properties of this knot combined with the properties of knot 1 are not consistent with the central region of F05189-2524 being a single nucleus bisected by a dust lane, contrary to the results of Surace & Sanders (1999) and Scoville et al (2000). Instead, the most likely interpretation is that F05189-2524 is a single nucleus system, and that knot 2 is a second line emitting region ionized by the nucleus in knot 1, but with a different level of excitation and obscuration.
One puzzling point is the clear detection of a line we identify as [FeX] 6375 in knot 2. Careful inspection of the 2-d image shows that this line does not arise via contamination from knot 1, but if it does arise from knot 2 then the apparent lack of other high excitation lines is strange. The simplest scenario which fits with a single nucleus interpretation is that the [FeX] emission from knot 2 is a result of scattering and reflection from knot 1, in which case we would expect this line to be polarized, but we cannot quantify this or explain the absence of the other high excitation iron lines without higher quality data.
3.3 IRAS F12071-0444
HST imaging shows a central, reddened, compact nucleus surrounded by a ‘chaotic’ high surface brightness region and a number of small blue knots, and two tidal tails (Surace et al, 1998). Ground based optical spectroscopy shows a Sy2 spectrum (Veilleux et al, 1995; Kewley et al, 2001b), and Veilleux, Sanders & Kim (1997) use near-infrared spectroscopy to infer the presence of a hidden BLR.
A single spectrum is evident in the STIS B and I band frames, with nothing detected in the UV frame. The optical spectra contain several high excitation Neon lines and the MgII 2796,2803 doublet. Both H and H are seen in emission. The optical lines are symmetric about the continuum, with spatial extents of 800 - 1000pc (for F12071-0444 the STIS pixel scale is pc pixel-1 in the optical). Two high excitation iron lines are also present in the I band spectrum, Fe VII 5721 and 6087 (Table 7), detected at the level. All the line ratio diagnostics classify this spectrum as an AGN, and as a Sy2 rather than a LINER. The [SII] doublet was not resolved for this object, hence we only estimated electron temperatures in the narrow line region. The [OII] / [OII] ratio, at 55.58, predicts a temperature in the NLR of K for cm-3, and K for cm-3. Overall we classify this object as an AGN, with no clear signs of an accompanying starburst, though we cannot rule out the presence of a starburst in the other knots in this object.
3.4 IRAS F15206+3342
Sanders et al (1988b) classify this galaxy as a Sy2 on the basis of ground based optical spectroscopy. Veilleux, Sanders & Kim (1997) do not however find any evidence for a hidden BLR. HST and ground-based imaging shows a complex morphology, with a large number of knots and a tidal tail (Surace et al, 1998; Veilleux, Kim, & Sanders, 2002). Most of these knots are probably starbursts, but two may be active nuclei. Arribas & Colina (2002) find evidence for gas inflow along the tidal tail, and postulate that this object is a late stage merger between two disk galaxies which suffered a retrograde encounter.
For this object the STIS slit was oriented so that it covered the centers of two knots, one of which was identified as a possible AGN by Surace et al (1998), and partially covered a third (Figure 1). Three spectra are thus visible in the STIS frames, and are discussed in the following subsections.
3.4.1 Knot one
Emission & absorption lines Knot 1 is the brightest of the three in the UV, and the UV spectrum contains a number of absorption systems, including Ly. Only two emission lines are present; NV 1240 and CIII 1175. The (unsaturated) absorption systems have FWHMs of 800 - 1500 km s-1 and show a blueshift of km s-1. In addition to the commonly seen UV absorption lines there are two weak features at observed-frame 1598Å and 1609Å that proved difficult to identify; features at these wavelengths are (to our knowledge) not seen in spectra of AGN or starburst galaxies, or composite QSO spectra, and do not correspond to absorption features commonly seen in Damped Lyman Alpha systems (Prochaska et al, 2001). These two features are most likely spurious, and so are not marked in Figure 6, even though they are detected at . If they are real, then the most likely candidates, based on currently available atomic line list data, are multiplets of allowed and semi-forbidden transitions of Fe II and Fe III (another possible ID motivated by absorption features seen in DLAs for the longer wavelength feature is PbII 1433), but it is beyond the scope of this paper to provide a secure identification.
The optical spectra show a steep continuum and a Balmer break. The emission lines, which are offset from the continuum by pc, have a spatial extent of 800 - 900pc. We detect both the [NeV] 3426 and [NeIII] 3869 lines, but no high excitation iron lines. A number of absorption features are present blueward of 4000Å; we identify MgII 2796,2803 and (cautiously) MgI 2852, HeI 2945, FeII 3180 and FeI+FeII 3261. These absorption features show blueshifts of between km s-1 (for MgII 2796,2803) and km s-1 (for FeI+FeII 3261) relative to the systemic redshift as measured from [OII]. The optical emission line widths are narrow, with a corrected [OIII] FWHM of km s-1.
Analysis It proved impossible to disentangle the H and [NII] emission; attempts to do so produced errors of at least a factor of two on the derived H flux depending on the input paramaters to specfit, hence the same procedure as for IRAS F01003-2238 was used to derive line ratio diagnostics. There is some ambiguity in the classification of this spectrum. The [OIII] vs. [NII] and [OIII] vs. [SII] diagnostics classify this knot as either an AGN or a starburst, depending on the assumed intrinsic Balmer decrement. The weak upper limit on [OI] renders diagnostics based on this line inconclusive. The [OIII] vs. [OII] and [OIII] vs. [OII] /[OIII] diagnostics classify this object as an AGN and HII region respectively, irrespective of any assumptions. We do not present estimates for electron densities or temperatures in the NLR as the [OII] line is not detected, and the [SII] doublet could not be deblended. With an assumed intrinsic Balmer decrement of 2.85, the extinction corrected star formation rate (if all the [OII] flux arises from star formation) derived using Equation 5 is M⊙ yr-1.
To quantify the presence of a starburst and/or AGN within this knot, we have modeled the UV spectrum using the Starburst99 v4.0 code (Leitherer et al (1999) and the same parameter ranges as for F01003-2238 (§3.1.4), under the ab initio assumption that the UV spectrum is starburst dominated. The observed UV spectrum is not consistent with a single episode or any combination of two episodes of star formation (Figure 12), irrespective of the adopted age, IMF slope and lower stellar mass limit, or whether the star formation is continuous or a ‘burst’. The emission line we identify as CIII 1175Å is not present (this line is in fact not predicted to exist in any of the starburst models we investigated), and the multiple strong absorption features in the observed spectrum are poorly matched by the model. Significant absorption at 1465Å due to OI and SiII could be generated by a starburst with a very steep IMF slope () but then the other absorption lines, particularly Ly, would not be consistent with the data. A close match around the Ly and NV lines can however be obtained with a single starburst model. The remainder of the UV spectrum requires a different explanation.
There are two possible origins for the absorption features in the UV spectrum of F15206+3342. The first is that they arise due to interstellar absorption. Interstellar absorption features in the rest-frame UV that are qualitatively similar to those seen in our spectrum are seen in, for example, UV spectra of Lyman Break Galaxies (Pettini et al, 2000; Shapley et al, 2003). It is possible therefore that the features in our spectrum are due to interstellar absorption. An argument against this however is that most of the absorption features in our spectrum are between 2 and 5 times broader than those seen in Lyman Break Galaxy spectra. For example, for the SiIV doublet; Pettini et al find rest-frame widths of 1.94Å and 1.42Å, Shapley et al find widths of 1.83Å and 0.81Å, whereas we find widths of 4.65Å and 3.71Å. The exception is the CII line, which has a comparable width in our spectrum and that of Shapley et al.
The second possible origin for these features is that they arise all or in part from a Broad Absorption Line (BAL) region, itself an outflow driven by a hidden AGN. Approximately 10% of QSOs show BALs with widths km s-1 (Weymann et al, 1991; Arav et al, 2001; Hall et al, 2002; Lacy et al, 2002; Reichard et al, 2003). The existence of an AGN driven BAL outflow in F15206+3342 is supported by the presence of MgII 2796,2803 and other absorption lines seen in BALs (Hall et al, 2002) in the B band spectrum, which would classify this object as a low ionization BAL, or ‘LoBAL’, which comprise % of the BAL population. The UV and B band spectra contain absorption features that are thought to arise from metastable excited levels of iron; such features are very rare amongst LoBALs, and would place F15206+3342 knot one in the so-called ‘FeLoBAL’ class of AGN (Hazard et al, 1987; Becker et al, 1997; Lacy et al, 2002). This picture however is also problematic, for two reasons. Firstly, the absorption lines are narrow compared to the classical definition of absorption lines in a BAL QSO (Weymann et al, 1991); the corrected FWHMs of MgII 2796,2803 and SiIV 1394 in our spectra are km s-1 and km s-1, though Hall et al (2002) do find absorption troughs of comparable widths to ours in some SDSS BAL QSOs. Our object would thus be formally termed a ‘mini-FeLoBAL’ AGN (Hamann, 2001). Secondly, a BAL nucleus cannot be responsible for all the observed features in the UV spectrum. BAL QSOs show absorption in CIV, NV, SiIV and Ly in order of decreasing strength (Hall et al (2002) & refs therein) whereas our spectrum shows strong Ly absorption and weak NV emission. Overall therefore, we conclude that the most likely scenario is that the Ly absorption and NV emission arise from a starburst, and the UV and optical absorption features arise from an outflow driven by a mini-FeloBAL AGN, but we cannot discount the possibility that some or all of the absorption features (particularly CII ) arise due to interstellar absorption of a starburst wind.
If the BAL AGN interpretation is correct then it would have interesting implications for the origin of the BAL QSO phenomenon. There are currently two models for the origin of the absorption lines in BAL QSOs; the ‘disk wind’ model and the ‘youth’ model. In the disk wind model (Murray & Chiang, 1998; Proga, Stone & Kallman, 2000) a wind from an accretion disk encounters a high column density, highly ionized gas. The high ionization state of this gas means it can transmit UV photons from (and thus be driven outwards by) resonance lines such as CIV , but the high column density of the gas shields it from higher energy photons that would otherwise completely ionize the gas. In this model BAL QSOs are those QSOs viewed along a line of sight that coincides with this outflowing gas, marking the detection of BALs in QSOs as largely orientation dependent (Elvis, 2000). The ‘youth’ model on the other hand contends that BAL QSOs are young objects, still surrounded by large quantities of gas and dust; in this case the BALs do not arise due to a particular line of sight (Voit, Weymann & Korista, 1993; Becker et al, 1997; Williams, Baker & Perry, 1999). The ‘youth’ model is often applied to LoBAL QSOs; Sprayberry & Foltz (1992) propose that the differences between the line properties of LoBAL QSOs and those of non-BAL QSOs cannot be explained solely in terms of different relative orientations. Voit, Weymann & Korista (1993) propose an alternative scenario in which LoBALs form via ablation of dust by UV photons in outflows arranged either as a thick disk or as an isotropic distribution of clouds; in this case LoBALs do fit within AGN orientation schemes, and this scenario is consistent with polarimetric observations of large samples of BAL QSOs (Schmidt & Hines, 1999; Ogle et al, 1999; Hutsemekers & Lamy, 2000). Even for this model, Voit, Weymann & Korista (1993) note that BAL QSOs would likely evolve into less obscured QSOs as the outflowing material either settles into a thinner configuration or entirely ablates away, and propose that this scenario is consistent with LoBAL QSOs being youthful objects. An evolutionary link between LoBAL QSOs and ULIRGs has also been previously suggested from other observations (Lipari, Colina & Macchetto, 1994; Canalizo & Stockton, 2001). The presence of a BAL nucleus within F15206+3342 would add further credence to the ‘youth’ model for LoBAL QSOs.
3.4.2 Knot two
Knot 2 is the faintest of the three in the optical, and the UV emission is also very weak. This is due at least in part to the positioning of the slit; as can be seen from Figure 1 the slit passes over only one edge of this knot. The discussion of this spectrum should therefore be regarded with caution. In the optical, similar emission lines are present as in knot 1, including the [NeIII] 3869 line, but also the H and HeI 5876 lines. The [NeV] 3426 line may be double peaked; adopting the systemic redshift then the rest-frame wavelengths of both features, at 3396Å and 3422Å lie just within the range seen in (for example) SDSS QSOs (Vanden Berk et al, 2001), but we conservatively only identify the longer wavelength feature as [NeV] 3426. No stellar absorption features were reliably identified.
It proved impossible to disentangle the and [NII] emission, hence the same procedure was used as for knot 1. The results from our three primary diagnostics are ambiguous between an HII and AGN, as is the [OIII] vs. [OII] /[OIII] diagnostic, though the [OIII] vs. [OII] /[OIII] diagnostic robustly classifies this object as an HII region. Overall therefore, we classify this knot as a starburst.
The [OII] line is not detected in this object, however the [SII] doublet was successfully deblended, hence we present estimates for the electron density in the NLR. The [SII] / [SII] ratio, at 0.90, infers electron densities of 1200cm-3, 910cm-3, and 690cm-3 for temperatures of 5,000K, 10,000K and 20,000K respectively, which implies a moderately dense NLR. With an assumed intrinsic Balmer decrement of 2.85, the optical star formation rate derived using Equation 5 is M⊙ yr-1
3.4.3 Knot three
Knot 3 is optically the brightest of the three, but is not detected at all in the UV. The lines are symmetric, with a spatial extent of pc. The line widths are narrow compared to the other spectra in the sample, with a corrected [OIII] FWHM of km s-1. Though the continuum detection was strong in both the B and I band spectra, no stellar absorption features were identified.
For this object the lines are sufficiently narrow that the and [NII] lines can be reliably deblended. All five of our adopted line diagnostics classify this spectrum as a starburst rather than an AGN. Both the [OII] doublets are detected, and the [SII] doublet was successfully deblended. From the [OII] / [OII] ratio, 31.53, we derive electron temperatures of 13900K, 9300K and 5100K for densities of 102cm-3, 103cm-3 and 104cm-3 respectively. From the [SII] / [SII] ratio of 0.77 we derive electron densities of 1200cm-3, 1600cm-3 and 2100cm-3 for assumed temperatures of 5000K, 10000K and 20000K respectively.
As this knot is universally classified as an HII region, and because the [NII] and H lines could be deblended, we have estimated the oxygen abundance using the [NII] 6584 /[OII] 3726,3729 diagnostic presented by Kewley & Dopita (2002), though we note that this diagnostic is only reliable for metallicities above one half solar. We derive:
| (6) |
which corresponds to an oxygen abundance of:
| (7) |
This oxygen abundance is higher than solar (8.69, Allende Prieto, Barklem & Asplund (2001)) and is comparable to the most metal rich local UV selected galaxies (e.g. Contini et al (2002)).
With an assumed intrinsic Balmer decrement of 2.85, the extinction corrected star formation rate derived using Equation 5 is M⊙ yr-1. Even by the standards of local ULIRGs, this star formation rate is extraordinarily high (Farrah et al, 2003), and is comparable to that seen in distant HLIRGs (Farrah et al, 2002b). If we instead use the extinction corrected H luminosity, and the calibration given by Kennicutt (1998):
| (8) |
then we obtain a comparable value; M⊙ yr-1. Even if all the star formation in F15206+3342 was in this knot and visible in the optical, this star formation rate is likely to be too high by a few hundred M⊙ yr-1. Establishing whether or not this is the case, and the reasons behind any overestimate, is beyond the scope of this paper, but we briefly mention two possibilities. As noted by Kennicutt (1998), star formation rate calibrations for H and [OII] depend strongly on both the optical extinction, and the assumed stellar IMF. It is quite possible that the measured extinction in this knot is incorrect. It is also possible that the IMF slope is steeper than that assumed in deriving Equations 5 and 8, this would mean there are a larger number of high-mass stars present, producing a greater ionising flux per M⊙.
The unambiguous classification of this knot as an HII region means that an AGN is unlikely to contribute significantly to the continuum emission. We can therefore estimate the stellar mass of this knot by combining the extinction measure from our observations with diagnostics from HST WFPC2 imaging (Surace et al, 1998); we note this is the only knot in our sample for which this analysis is possible, as the others are either weakly detected or contain an AGN. This gives a mass of M⊙ (note this differs from the mass presented in Table 2 as we have applied a reddening correction based on our spectra). This translates, assuming the knot is approximately spherical, to a stellar mass density of M⊙pc-3. Both the mass and stellar density of this knot are comparable to, but at the lower ends of, the ranges seen in the cores of elliptical galaxies, which typically have masses up to M⊙ and stellar densities in the range M⊙ (Lauer, 1989). Coupled with the very high star formation rate (at least a few hundred M⊙ yr-1) this makes this knot an excellent candidate for the forming core of an elliptical galaxy.
4 Summary & Conclusions
We have presented HST STIS longslit optical and UV spectra of the knots in the nuclear regions of four ‘warm’ ULIRGs, and used a combination of line ratio diagnostics and spectral synthesis modelling to constrain the active power source in each knot. A summary of the properties of the knots in each object is as follows:
1) IRAS F01003-2238 - The STIS data show a single bright narrow line spectrum. The UV spectrum contains signatures of O supergiants, both WC and WN type Wolf-Rayet stars, and (probably) an AGN. Results from spectral synthesis modelling are consistent with a ‘burst’ of star formation with age 3-4Myr and an IMF slope . The optical spectra show what may be high excitation iron lines, indicating a line of sight close to the broad line region, and evidence for a wind, probably starburst driven, that originated in the nucleus around 0.5Myr ago.
2) IRAS F05189-2524 - Two spectra can be seen, corresponding to the two sections of the central bisected ‘nucleus’. The UV spectrum of knot 1 shows several strong permitted lines from an AGN, together with weak NIV] 1488 emission that probably arises from a young (Myr) ‘burst’ of star formation. The B and I band spectra of knot 1 show a large number of lines, including the OIII 3133 Bowen resonance-fluorescence line. Also present are several high excitation iron lines, including [FeXIV] 5303, which imply lines of sight from the narrow line region through to pc from the accretion disk. The optical line diagnostics classify this knot as an AGN. Further diagnostics show no evidence for shock heating, and imply a metallicity of 2.5Z⊙ or higher. Knot 2 is fainter than knot 1, and is not detected in the UV. Its properties are consistent with a higher obscuration and lower ionization level than knot 1. Considered together, the properties of the two knots are not consistent with a single nucleus bisected by a dust lane, but rather with a single nucleus (knot 1) together with a second knot of line emitting gas ionized by the nucleus in knot 1 but with different ionisation conditions and obscuration.
3) IRAS F12071-0444 - A single spectrum of the nucleus can be seen. This object is undetected in the UV, and the continuum is only weakly detected in the B and I bands. Only a few optical emission lines are present, limiting the scope of the analysis. The optical line ratio diagnostics universally classify this object as a Sy2. There is no evidence for an accompanying starburst, though we cannot rule out the possiblility of starbursts in the other knots in this object.
4) IRAS F15206+3342 - Three spectra can be seen. The UV spectrum of knot 1 is a chimera; containing Ly and NV lines that can be modeled as arising from a starburst, together with a CIII 1175 line that is not present in any spectral synthesis model we investigated, and thus likely arises from an AGN. The UV and B band spectra contain a number of absorption systems that probably arise from a hidden FeLoBAL AGN, the alternative being that they arise from interstellar absorption. Knot 2 is only weakly detected; this spectrum is classified as an HII region with a moderately dense narrow line region. Knot 3 is optically bright but not detected in the UV. Line ratio diagnostics classify this knot as an HII region with a supersolar (Z1.5Z⊙) metallicity and a very high star formation rate. Combined with previous results this implies that this knot is plausibly the forming core of an elliptical galaxy. This is the only object in the sample for which the knot classifications given by Surace et al (1998) were found to be incorrect, for knots 1 and 3.
The knots in our sample of 4 ‘warm’ ULIRGs are remarkable both for their similarities and their differences. Three of the four objects contain a knot with clear AGN signatures, and one object (F01003-2238) also likely contains an AGN, demonstrating that selection based on ’warm’ mid-IR colors does preferentially find ULIRGs with an AGN. In three out of four cases this AGN was found in the knot identified as a putative AGN from multiband HST imaging. Three of the four ULIRGs in our sample also contain at least one starburst knot, confirming that most ULIRGs are ‘composite’ objects, containing both a starburst and an AGN. The detection of luminous AGN and/or starbursts in all of the knots in our sample constitutes plausible, though not compelling evidence that these knots are the sites for the dust-shrouded starburst and AGN activity that power the IR emission in ULIRGs. The AGN display a wide range of properties; two are classical narrow line AGN, one shows both broad and narrow lines and has multiple lines of sight to the center, and one is a narrow line AGN with (plausibly) an FeLoBAL outflow. Of the starbursts, only 3 have constraints on their ages, with two having ages 3-4Myr and the third with an age of Myr. Though this could be a selection effect, it seems that young bursts of star formation are common in ULIRGs, indicating that most ULIRGs probably undergo several such bursts during their lifetime. Finally, the properties of one starburst knot are consistent with it being the forming core of an elliptical galaxy, the first time to our knowledge that such a structure has been identified in a ULIRG. The identification of such a structure is supportive of the idea that ULIRGs can evolve into systems similar to local elliptical galaxies.
Our study has demonstrated the power of combining high spatial resolution optical and UV spectroscopy to study local ULIRGs; the optical data, in addition to providing lines for standard line ratio diagnostics, also isolated several rare, high excitation lines in most systems. In several cases the AGN was only unambiguously seen in the UV, and quantitative constraints on the properties of the starbursts only came from modelling the UV spectra. In one case (F01003-2238) this approach showed (probable) AGN signatures, when such signatures had previously only been seen in mid-IR spectroscopy. While this method does not directly measure what contributes to the IR emission it does give a sensitive, largely model free measure of what could contribute to the IR emission. Indeed, this study would not have been possible without a space-based optical/UV spectrograph with spatial resolution of . Future multiwavelength studies focused on these knots are likely to give powerful insights into the nature of starburst and AGN activity in ULIRGs, and into ULIRG evolution.
References
- Allen, Dopita & Tsvetanov (1998) Allen M. G., Dopita M. A., Tsvetanov Z. I., 1998, ApJ, 493, 571
- Allende Prieto, Barklem & Asplund (2001) Allende Prieto C., Barklem P. S., Asplund M., 2001, ApJ, 556, L63
- Arav et al (2001) Arav N., et al, 2001, ApJ, 561, 118
- Armus, Heckman & Miley (1988) Armus L., Heckman T. M., Miley G. K., 1988, ApJ, 326, L45
- Arribas & Colina (2002) Arribas S., Colina L., 2002, ApJ, 573, 576
- Baldwin, Phillips & Terlevich (1981) Baldwin J. A., Phillips M. M., Terlevich R., 1981, PASP, 93, 5
- Barlow & Hummer (1982) Barlow M. J., Hummer D. G., In IAU Symp. 99, Wolf-Rayet stars: Observations, physics, evolution, ed C. W. H. de Loore & A. J. Willis (Dordrecht: Reidel), 387
- Becker et al (1997) Becker R. H., Gregg M. D., Hook I. M., McMahon R. G., White R. L., Helfand D. J., 1997, ApJ, 479, L93
- Borys et al (2003) Borys C., Chapman S., Halpern M., Scott D., 2003, MNRAS, 344, 385
- Bushouse et al (2002) Bushouse H. A., et al, 2002, ApJS, 138, 1
- Calzetti (2001) Calzetti D., 2001, PASP, 113, 1449
- Canalizo & Stockton (2001) Canalizo G., Stockton A., 2001, ApJ, 555, 719
- Cardelli et al (1989) Cardelli J. A., Clayton G. C., Mathis J. S., 1989, ApJ, 345, 245
- Chapman et al (2003) Chapman S. C., Windhorst R., Odewahn S., Yan H., Conselice C., 2003, ApJ, 599, 92
- Condon et al (1991) Condon J. J., Huang Z.-P., Yin Q. F., Thuan T. X., 1991, ApJ, 378, 65
- Conselice et al (2003a) Conselice C. J., Bershady M. A., Dickinson M., Papovich C., 2003, AJ, 126, 1183
- Conselice et al (2003b) Conselice C. J., Chapman S. C., Windhorst R. A., 2003, ApJ, 596, L5
- Conti (1991) Conti P. S., 1991, ApJ, 377, 115
- Contini et al (2002) Contini T., Treyer M. A., Sullivan M., Ellis R. S., 2002, MNRAS, 330, 75
- Crowther et al (1995) Crowther P. A., Smith L. J., Hillier D. J., Schmutz W., 1995, A&A, 293, 427
- de Robertis, Dufour & Hunt (1987) de Robertis M. M., Dufour R. J., Hunt R. W., 1987, JRASC, 81, 195
- Dopita et al (2000) Dopita M. A., Kewley L. J., Heisler C. A., Sutherland R. S., 2000, ApJ, 542, 224
- Dudley (1999) Dudley C. C., 1999, MNRAS, 307, 553
- Eales et al (2000) Eales S., Lilly S., Webb T., Dunne L., Gear W., Clements D., Yun M., 2000, AJ, 120, 2244
- Elvis (2000) Elvis M., 2000, ApJ, 545, 63
- Farrah et al (2001) Farrah D., et al, 2001, MNRAS, 326, 1333
- Farrah et al (2002a) Farrah D., Verma A., Oliver S., Rowan-Robinson M., McMahon R., 2002a, MNRAS, 329, 605
- Farrah et al (2002b) Farrah D., Serjeant S., Efstathiou A., Rowan-Robinson M., Verma A., 2002b, MNRAS, 335, 1163
- Farrah et al (2003) Farrah D., et al, 2003, MNRAS, 343, 585
- Farrah et al (2004) Farrah D., Geach J., Fox M., Serjeant S., Oliver S., Verma A., Kaviani A., Rowan-Robinson M., 2004, MNRAS, 349, 518
- Franceschini et al (2003) Franceschini A., et al, 2003, MNRAS, 343, 1181
- Ferguson, Korista & Ferland (1997) Ferguson J. W., Korista K. T., Ferland G. J., 1997, ApJS, 110, 287
- Genzel et al (1998) Genzel R., et al, 1998, ApJ, 498, 579
- Hall et al (2002) Hall P., et al, 2002, ApJS, 141, 267
- Hamann & Ferland (1999) Hamann F., Ferland G., 1999, ARA&A, 37, 487
- Hamann (2001) Hamann F., in ‘Encyclopaedia of Astronomy and Astrophysics’, ed P. Murdin, IOP Publishing
- Hamann et al (2002) Hamann F., Korista K. T., Ferland G. J., Warner C., Baldwin J., 2002, ApJ, 564, 592
- Hazard et al (1987) Hazard C., McMahon R. G., Webb J. K., Morton D. C., 1987, ApJ, 323, 263
- Heckman (1980) Heckman T. M., 1980, A&A, 87, 152
- Hughes et al (1998) Hughes D. H., et al, 1998, Nat, 394, 241
- Hutsemekers & Lamy (2000) Hutsemekers D., Lamy H., 2000, A&A, 358, 835
- Imanishi et al (2003) Imanishi M., Terashima Y., Anabuki N., Nakagawa T., 2003, ApJ, 596L, 167
- Joseph & Wright (1985) Joseph R. D., Wright G. S., 1985, MNRAS, 214, 87
- Kennicutt (1998) Kennicutt R. C., 1998, ARA&A, 36, 189
- Kewley et al (2001a) Kewley L. J., Dopita M. A., Sutherland R. S., Heisler C. A., Trevena J., 2001, ApJ, 556, 121
- Kewley et al (2001b) Kewley L. J., Heisler C. A., Dopita M. A., Lumsden S., 2001, ApJS, 132, 37
- Kewley & Dopita (2002) Kewley L. J., Dopita M. A., 2002, ApJS, 142, 35
- Kim & Sanders (1998) Kim D.-C., Sanders D. B., 1998, ApJS, 119, 41
- Korista & Ferland (1989) Korista K. T., Ferland G. J., 1989, ApJ, 343, 678
- Kunth & Sargent (1981) Kunth D., Sargent W. L. W., 1981, A&A, 101, L5
- Lacy et al (2002) Lacy M., Gregg M., Becker R. H., White R. L., Glikman E., Helfand D., Winn J. N., 2002, AJ, 123, 2925
- Lauer (1989) Lauer T. R., in ‘Dynamics of dense stellar systems’; Proceedings of the Workshop, Toronto, Canada, May 27, 28, 1988 (A90-42876 19-90). Cambridge, England and New York, Cambridge University Press, 1989, p. 3-12.
- Leitherer, Robert & Heckman (1995) Leitherer C., Robert C., Heckman T. M., 1995, ApJS, 99, 173
- Leitherer et al (1999) Leitherer C., et al, 1999, ApJS, 123, 3
- Leitherer et al (2002) Leitherer C., Li I.-H., Calzetti D., Heckman T. M., 2002, ApJS, 140, 303
- Lipari, Colina & Macchetto (1994) Lipari S., Colina L., Macchetto F., 1994, ApJ, 427, 174
- Lipari et al (2003) Lipari S., Terlevich R., Díaz R. J., Taniguchi Y., Zheng W., Tsvetanov Z., Carranza G., Dottori H., 2003, MNRAS, 340, 289
- Lonsdale et al (2003) Lonsdale Carol J., Lonsdale Colin J., Smith, H. E., Diamond P. J., 2003, ApJ, 592, 804
- Murray & Chiang (1998) Murray N., Chiang J., 1998, ApJ, 494, 125
- Nagar et al (2003) Nagar N. M., Wilson A. S., Falcke H., Veilleux S., Maiolino R., 2003, A&A, 409, 115
- Ogle et al (1999) Ogle P. M., Cohen M. H., Miller J. S., Tran H. D., Goodrich R. W., Martel A. R., 1999, ApJS, 125, 1
- Osterbrock (1981) Osterbrock D. E., 1981, ApJ, 246, 696
- Osterbrock (1989) Osterbrock D. E., 1989, ‘Astrophysics of Nebulae and Active Galactic Nuclei’, University Science Books
- Osterbrock, Tran & Veilleux (1992) Osterbrock D. E., Tran H. D., Veilleux S., 1992, ApJ, 389, 196
- Penston et al (1984) Penston M. V., Fosbury R. A. E., Boksenberg A., Ward M. J., Wilson A. S., 1984, MNRAS, 208, 347
- Pettini et al (2000) Pettini M., Steidel C. C., Adelberger K. L., Dickinson M., Giavalisco M., 2000, ApJ, 528, 96
- Prochaska et al (2001) Prochaska J. X., et al, 2001, ApJS, 137, 21
- Proga, Stone & Kallman (2000) Proga D., Stone J. M., Kallman T. R., 2000, ApJ, 543, 686
- Ptak et al (2003) Ptak A., Heckman T., Levenson N. A., Weaver K., Strickland D., 2003, ApJ, 592, 782
- Reichard et al (2003) Reichard T., et al, 2003, AJ, 126, 2594
- Reynolds et al (1997) Reynolds C. S., Ward M. J., Fabian A. C., Celotti A., 1997, MNRAS, 291, 403
- Rieke & Low (1972) Rieke G. H., Low F. J., 1972, ApJ, 176, L95
- Rigopoulou et al (1999) Rigopoulou D., Spoon H. W. W., Genzel R., Lutz D., Moorwood A. F. M., Tran Q. D., 1999, AJ, 118, 2625
- Risaliti et al (2000) Risaliti G., Gilli R., Maiolino R., Salvati M., 2000, A&A, 357, 13
- Robert, Leitherer & Heckman (1993) Robert C., Leitherer C., Heckman T. M., 1993, ApJ, 418, 749
- Rowan-Robinson (2000) Rowan-Robinson M., 2000, MNRAS, 316, 885
- Sanders et al (1988a) Sanders D. B., Soifer B. T., Elias J. H., Madore B. F., Matthews K., Neugebauer G., Scoville N. Z., 1988a, ApJ, 325, 74
- Sanders et al (1988b) Sanders D. B., Soifer B. T., Elias J. H., Neugebauer G., Matthews K., 1988b, ApJ, 328, L35
- Sanders & Mirabel (1996) Sanders D. B., Mirabel I. F., 1996, ARA&A, 34, 749
- Saunders et al (1990) Saunders W., Rowan-Robinson M., Lawrence A., Efstathiou G., Kaiser N., Ellis R. S., Frenk C. S., 1990, MNRAS, 242, 318
- Schaerer & Vacca (1998) Schaerer D., Vacca W. D., 1998, ApJ, 497, 618
- Schmidt & Hines (1999) Schmidt G. D., Hines D. C., 1999, ApJ, 512, 125
- Scoville et al (2000) Scoville N. Z., et al, 2000, AJ, 119, 991
- Scott et al (2002) Scott S. E., et al, 2002, MNRAS, 331, 817
- Shapley et al (2003) Shapley A. E., Steidel C. C., Pettini M., Adelberger K. L., 2003, ApJ, 588, 65
- Smith et al (1998) Smith H. E., Lonsdale Carol J., Lonsdale Colin J., Diamond P. J., 1998, ApJ, 493, L17
- Soifer et al (1984) Soifer B. T., et al, 1984, ApJ, 283L, 1
- Soifer et al (2000) Soifer B. T., et al, 2000, AJ, 119, 509
- Sprayberry & Foltz (1992) Sprayberry D., Foltz C. B., 1992, ApJ, 390, 39
- Stevens & Strickland (1998) Stevens I. R., Strickland D. K., 1998, MNRAS, 301, 215
- Surace et al (1998) Surace J. A., Sanders D. B., Vacca W. D., Veilleux S., Mazzarella J. M., 1998, ApJ, 492, 116
- Surace & Sanders (1999) Surace J. A., Sanders D. B., 1999, ApJ, 512, 162
- Tacconi et al (2002) Tacconi L. J., Genzel R., Lutz D., Rigopoulou D., Baker A. J., Iserlohe C., Tecza M., 2002, ApJ, 580, 73
- Tran et al (2001) Tran Q. D., et al, 2001, ApJ, 552, 527
- Turnshek et al (1996) Turnshek D. A., Kopko M., Monier E., Noll D., Espey B. R., Weymann R. J., 1996, ApJ, 463, 110
- Vacca & Conti (1992) Vacca W. D., Conti P. S., 1992, ApJ, 401, 543
- Vanden Berk et al (2001) Vanden Berk D. E., et al, 2001, AJ, 122, 549
- Veilleux & Osterbrock (1987) Veilleux S., Osterbrock D. E., 1987, ApJS, 63, 295
- Veilleux (1991) Veilleux S., 1991, ApJS, 75, 383
- Veilleux et al (1995) Veilleux S., Kim D.-C., Sanders D. B., Mazzarella J. M., Soifer B. T., 1995, ApJS, 98, 171
- Veilleux, Sanders & Kim (1997) Veilleux S., Sanders D. B., Kim D.-C., 1997, ApJ, 484, 92
- Veilleux, Sanders & Kim (1999) Veilleux S., Sanders D. B., Kim D.-C., 1999, ApJ, 522, 139
- Veilleux, Kim, & Sanders (2002) Veilleux S., Kim D.-C., Sanders D. B., 2002, ApJS, 143, 315
- Verma et al (2002) Verma A., Rowan-Robinson M., McMahon R., Efstathiou A., 2002, MNRAS, 335, 574
- Voit, Weymann & Korista (1993) Voit G. M., Weymann R. J., Korista K. T., 1993, ApJ, 413, 95
- Weymann et al (1991) Weymann R. J., Morris S. L., Foltz C. B., Hewett P. C., 1991, ApJ, 373, 23
- Williams, Baker & Perry (1999) Williams R. J. R., Baker A. C., Perry J. J., 1999, MNRAS, 310, 913
- Wilman, Crawford & Abraham (1999) Wilman R. J., Crawford C. S., Abraham R. G., 1999, MNRAS, 309, 299
- Young et al (1996) Young S., Hough J. H., Efstathiou A., Wills B. J., Bailey J. A., Ward M. J., Axon D. J., 1996, MNRAS, 281, 1206
| Galaxy | RA (J2000) | Dec | Redshift | aaknots identified by Surace et al (1998) as putative AGN based on their broad-band colors. | |
|---|---|---|---|---|---|
| IRAS F01003-2238 | 01 02 49.99 | -22 21 57.5 | 0.1177 | 12.39 | 18.5 |
| IRAS F05189-2524 | 05 21 01.47 | -25 21 45.4 | 0.0426 | 12.20 | 15.6 |
| IRAS F12071-0444 | 12 09 45.12 | -05 01 13.9 | 0.1284 | 12.51 | 18.2 |
| IRAS F15206+3342 | 15 22 38.05 | +33 31 35.9 | 0.1244 | 12.33 | 16.8 |
aLogarithm of the m luminosity, taken from Kim & Sanders (1998) and rescaled to our cosmology.
| Galaxy | Knot | Radius | Mass | ||
|---|---|---|---|---|---|
| pc | M⊙bbstellar mass inferred by Surace et al (1998) assuming that all of the B and I band flux is due to stellar emission | ||||
| F01003-2238 | 1aaknots identified by Surace et al (1998) as putative AGN based on their broad-band colors. | 19.27 | 18.32 | 28 | |
| F05189-2524 | 1aaknots identified by Surace et al (1998) as putative AGN based on their broad-band colors. | 18.78 | 16.55 | 25 | |
| 2 | 19.01 | 17.37 | 27 | ||
| F12071-0444 | 1aaknots identified by Surace et al (1998) as putative AGN based on their broad-band colors. | 21.59 | 19.00 | 244 | |
| F15206+3342 | 1 | 19.45 | 18.54 | 88 | |
| 2 | 19.50 | 18.68 | 104 | ||
| 3aaknots identified by Surace et al (1998) as putative AGN based on their broad-band colors. | 19.29 | 17.37 | 57 | ccbut see §3.4.3 |
| Line | Wavelength | F01003-2238 | F05189-2524 | F12071-0444 | F15206+3342 |
|---|---|---|---|---|---|
| Å | 1 | 1 | 1 | 1 | |
| HeII | 1085 | 1.19 | – | – | – |
| CIII aaUncertain ID | 1175 | abs | 0.13: | – | 1.23: |
| Ly | 1216 | 10.83 | 52.74 | – | abs |
| NV | 1240 | 1.58: | 20.51 | – | 0.22: |
| SiII | 1260 | abs | – | – | abs |
| CII | 1335 | – | 0.90 | – | abs |
| SiIV | 1394,1403 | 1.08: | 2.74 | – | abs |
| NIV | 1488 | 0.53: | 1.12 | – | – |
| CIV | 1548,1551 | – | 28.54 | – | – |
| NeV aaUncertain ID | 1575 | – | 0.30:: | – | – |
| NeIVaaUncertain ID | 1601 | – | 0.35:: | – | – |
| HeII | 1640 | – | 13.22 | – | – |
Note. — Fluxes are in units of ergs cm-2s-1 and have not been corrected for extinction. Flux errors are of the order for most sources; those fluxes marked with a colon have flux errors of and those fluxes with a double colon have errors of .
| Line | Wavelength | F01003-2238 | F05189-2524 | F12071-0444 | F15206+3342 | |||
|---|---|---|---|---|---|---|---|---|
| Å | 1 | 1 | 2aaextracted using a 1 pixel (pc) aperture, fluxes are uncertain due to contamination from knot 1. | 1 | 1 | 2 | 3 | |
| MgII | 2796,2803 | 5.13 | N/A | N/A | 0.42: | abs | – | – |
| MgI | 2852 | – | N/A | N/A | – | abs | – | – |
| FeII | 2985 | – | N/A | N/A | – | abs | – | – |
| HeI | 2945 | – | N/A | N/A | – | abs | – | – |
| OIII | 3133 | – | 7.13 | N/A | – | – | – | – |
| FeII | 3180 | – | – | N/A | – | abs | – | – |
| HeI | 3189 | – | 5.26: | N/A | – | – | – | – |
| FeI+FeII | 3261 | – | – | N/A | – | abs | – | – |
| NeV | 3346 | – | 21.96 | N/A | – | – | – | – |
| NeV | 3426 | 2.68: | 58.44 | 0.72: | 0.39: | 0.41: | 0.34: | 0.55 |
| OII | 3727 | 1.27: | 3.91: | – | 0.71 | 1.70 | 1.55 | 2.01 |
| NeIII | 3869 | 6.09 | 17.11 | 0.38: | 1.16 | 0.52:: | 0.16:: | 1.14 |
| NeIII | 3968 | 2.26 | 5.50 | abs | 0.37: | – | – | – |
| SII | 4068,4076 | – | 1.75: | – | – | – | – | – |
| H | 4102 | 3.18:: | 2.09 | abs | 0.41:: | – | – | 0.63: |
| H | 4340 | 2.38 | 5.51 | – | 0.40: | – | 0.43 | 1.84 |
| NIII | 4634,4640,4642 | 1.26: | – | – | – | – | – | – |
| HeII | 4686 | 1.23:: | 15.92 | – | 0.64 | – | – | – |
| H | 4861 | 4.96 | 34.12 | 0.23: | 1.42 | 0.95 | 1.25 | 5.49 |
| OIII | 4959 | 9.07 | 62.44 | N/A | 6.91 | 1.28 | 1.32 | 8.37 |
| OIII | 5007 | 23.67 | 177.98 | N/A | 20.82 | 4.20 | 4.31 | 21.43 |
| HeII | 5412 | – | 5.72 | – | – | – | – | – |
| HeI | 5876 | –bbbut see notes for Table 7 | 4.28 | – | – | – | 0.35: | 2.66: |
| OI | 6300 | 3.23 | 4.37 | – | 1.97 | – | – | – |
| NII | 6548 | – | 13.30 | N/A | 6.17 | – | – | 6.54 |
| H | 6563 | – | 202.20 | N/A | 13.99 | – | – | 68.26 |
| NII | 6583 | – | 39.94 | N/A | 18.54 | – | – | 19.66 |
| H+NII | – | 56.94 | – | N/A | – | 8.76 | 12.49 | – |
| SII | 6716,6731 | 3.29 | 12.95 | 0.51: | 5.94 | 1.71: | 1.15 | 3.76 |
| HeI | 7065 | – | 1.47: | – | – | – | – | – |
| ArIII | 7138 | – | 5.14 | – | 1.29 | – | – | 1.96:: |
| OII | 7320,7330 | 2.28: | 2.86: | – | 0.58: | – | – | 2.27: |
| SIII | 9069 | – | 17.22 | N/A | – | – | – | 8.35:: |
| SIII | 9531 | – | 25.08: | N/A | – | – | – | – |
Note. — Fluxes are in units of ergs cm-2s-1 and have not been corrected for extinction. ‘–’: Undetected. ‘N/A’: line is either outside the bandpass, contaminated by companion spectra, or in a noisy part of the spectrum. Flux errors are of the order for most sources; those fluxes marked with a colon have flux errors of and those fluxes with a double colon have errors of .
| Line | F01003-2238 | F05189-2524 | F12071-0444 | F15206+3342 | ||
|---|---|---|---|---|---|---|
| 1 | 1 | 1 | 1 | 2 | 3 | |
| Ly | N/A | – | abs | – | – | |
| CIV 1549 | – | (B) | – | – | – | – |
| – | (N) | – | – | – | – | |
| OII 3727 | ||||||
| H | (B) | |||||
| – | (N) | – | – | – | – | |
| OIII 5007 | (B) | |||||
| – | (N) | – | – | – | – | |
| FeXIV 5303 | – | – | – | – | – | |
| Fe VII 5721 | aabut see notes for Table 7 | – | – | – | ||
| Fe VII 6087 | aabut see notes for Table 7 | – | – | – | ||
| OI 6300 | – | – | ||||
| Fe X 6375 | – | – | – | – | ||
Note. — Widths are given in km s-1. FWHM of Ly and NV cannot be measured in F05189-2524 as the broad and narrow components of these two lines cannot be reliably deblended, see text for details.
| Galaxy | (1) | (2) | (3) | |||||||||
|---|---|---|---|---|---|---|---|---|---|---|---|---|
| F01003-2238 | 1 | 8.61 | 3.46 | 4.77 | 0.05: | 0.25 | 0.08 | 0.05 | 0.05: | – | – | – |
| 2.85 | 0.0 | 4.15 | 0.20: | 0.25 | 0.07 | 0.06 | 0.04: | HII | HII | AGN | ||
| F01003-2238 | 1 | 4.92 | 1.45 | 4.77 | 0.05: | 1.0 | 0.13 | 0.09 | 0.09: | – | – | – |
| 3.10 | 0.0 | 4.50 | 0.09: | 1.0 | 0.13 | 0.10 | 0.08: | AGN | HII | AGN | ||
| F05189-2524 | 1 | 35.08 | 7.87 | 39.08 | 0.02: | 0.25 | 0.08 | 0.03 | 0.02: | – | – | – |
| 2.85 | 0.0 | 28.42 | 0.46: | 0.25 | 0.07 | 0.04 | 0.01: | AGN | AGN | AGN | ||
| F05189-2524 | 1 | 8.77 | 3.26 | 39.08 | 0.02: | 1.0 | 0.32 | 0.11 | 0.07: | – | – | – |
| 3.10 | 0.0 | 34.25 | 0.08: | 1.0 | 0.30 | 0.12 | 0.05: | AGN | AGN | AGN | ||
| F12071-0444 | 1 | 9.87 | 3.63 | 14.69 | 0.09 | 1.33 | 0.42 | 0.14 | 0.04 | – | – | – |
| 3.10 | 0.0 | 12.68 | 0.38 | 1.31 | 0.39 | 0.16 | 0.03 | AGN | AGN | AGN | ||
| F15206+3342 | 1 | 6.88 | 2.76 | 4.40 | 0.40 | 0.25 | 0.26 | 0.18 | 0.11 | – | – | – |
| 2.85 | 0.0 | 3.93 | 1.17 | 0.25 | 0.25 | 0.09 | 0.08 | HII | A | A | ||
| 1 | 3.93 | 0.75 | 4.40 | 0.40 | 1.0 | 0.46 | 0.20 | 0.20 | – | – | – | |
| 3.10 | 0.0 | 4.27 | 0.54 | 1.0 | 0.45 | 0.20 | 0.18 | AGN | AGN | A | ||
| 2 | 7.50 | 3.03 | 3.45 | 0.36 | 0.25 | 0.12 | 0.03 | 0.03 | – | – | – | |
| 2.85 | 0.0 | 3.05 | 1.16 | 0.25 | 0.11 | 0.04 | 0.02 | HII | HII | HII | ||
| 2 | 4.29 | 1.02 | 3.45 | 0.36 | 1.0 | 0.21 | 0.06 | 0.06 | – | – | – | |
| 3.10 | 0.0 | 3.31 | 0.53 | 1.0 | 0.21 | 0.06 | 0.05 | AGN | HII | A | ||
| 3 | 12.44 | 4.62 | 4.40 | 0.08 | 0.29 | 0.06 | 0.05 | 0.03 | – | – | – | |
| 2.85 | 0.0 | 3.65 | 0.49 | 0.28 | 0.05 | 0.02 | 0.02 | HII | HII | HII |
Note. — (1) [OIII] vs. [NII] classification. (2) [OIII] vs. [SII] classification. (3) [OIII] vs. [OI] classification. ‘HII’: HII/Starburst spectrum. ‘AGN’: AGN spectrum. ‘A’: ambiguous classification between an HII and AGN spectrum. For F01003-2238 and F15206+3342 knots 1 & 2 the [NII] and H lines could not be deblended, and for F05189-2524 the narrow and broad components on H could not be deblended, hence two sets of line ratio diagnostics have been derived for these three objects assuming intrinsic Balmer decrements of 2.85 and 3.10 respectively. In these cases the ratio is shown in bold. Uncertainties on the line ratios are , except for those ratios marked with a colon, where the uncertainty is .
| Line | wavelength | F01003-2238 | F05189-2524 | F12071-0444 | |
|---|---|---|---|---|---|
| Å | 1 | 1 | 2aaextracted using a 1 pixel (pc) aperture, IDs and fluxes are uncertain due to contamination from knot 1, see §3.2.3 for more details. | 1 | |
| Fe VI | 5530 | – | 2.07: | – | – |
| Fe VI | 5632 | 1.95ccUncertain ID, may be blended with CIII5696, [NII]5756 | 3.66 | – | – |
| Fe VII | 3582 | – | 3.32 | – | – |
| Fe VII | 3760 | – | 6.39: | – | – |
| Fe VII | 5159 | – | 16.15 | – | – |
| Fe VII | 5721 | 1.5:ddUncertain ID, may be blended with CIV5808, HeI5876 | 19.96 | – | 0.46: |
| Fe VII | 6087 | 1.00:eeUncertain ID | 31.76 | – | 0.58: |
| Fe Xbbcorrected for contamination from [OI] assuming [OI] /[OI] . | 6375 | – | 9.44 | 0.53 | – |
| Fe XI | 7892 | – | 7.85 | – | – |
| Fe XIV | 5303 | – | 18.58 | – | – |
Note. — Line fluxes are in units of ergs cm-2s-1 and have not been corrected for extinction. Flux errors are of the order for most sources; those fluxes marked with a colon have flux errors of .